Personalized Immunotherapy Market Size and Share Forecast Outlook 2025 to 2035

The Personalized Immunotherapy Market is estimated to be valued at USD 11.2 billion in 2025 and is projected to reach USD 38.6 billion by 2035, registering a compound annual growth rate (CAGR) of 13.2% over the forecast period.
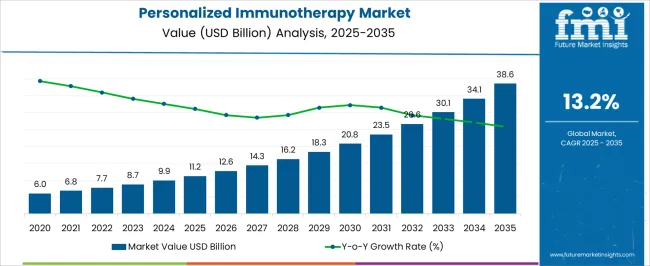
Quick Stats for Personalized Immunotherapy Market

  • Personalized Immunotherapy Market Value (2025): USD 11.2 billion
  • Personalized Immunotherapy Market Forecast Value (2035): USD 38.6 billion
  • Personalized Immunotherapy Market Forecast CAGR: 13.2%
  • Leading Segment in Personalized Immunotherapy Market in 2025: Monoclonal Antibodies (46.8%)
  • Key Growth Regions in Personalized Immunotherapy Market: North America, Asia-Pacific, Europe
  • Top Key Players in Personalized Immunotherapy Market: Novartis AG, F. Hoffmann-La Roche Ltd, Bristol-Myers Squibb Company, Merck & Co., Inc., Pfizer Inc., Gilead Sciences, Inc., Amgen Inc., Johnson & Johnson, AstraZeneca plc, GlaxoSmithKline plc, Sanofi S.A., Eli Lilly and Company, Bluebird Bio, Inc., Adaptimmune Therapeutics plc, Kite Pharma (a Gilead Company), Cellectis S.A., Autolus Therapeutics plc
Personalized Immunotherapy Market Market Value Analysis

Personalized Immunotherapy Market Key Takeaways

Metric Value
Personalized Immunotherapy Market Estimated Value in (2025 E) USD 11.2 billion
Personalized Immunotherapy Market Forecast Value in (2035 F) USD 38.6 billion
Forecast CAGR (2025 to 2035) 13.2%

Why is the Personalized Immunotherapy Market Growing?

The Personalized Immunotherapy market is witnessing strong growth, driven by the rising focus on individualized treatment approaches that leverage patients’ genetic and molecular profiles. The current market scenario is shaped by increasing adoption of targeted therapies that optimize treatment efficacy while minimizing adverse effects. Personalized immunotherapy is being increasingly preferred for cancers and chronic diseases, where traditional therapies have limited effectiveness.

Advancements in biotechnology, immuno-oncology, and molecular diagnostics have enabled the development of more precise therapies, resulting in improved patient outcomes. Rising awareness among patients and healthcare providers about the benefits of personalized treatment, coupled with expanding healthcare infrastructure and investment in clinical research, is further supporting market growth.

Additionally, regulatory approvals for novel therapies and the growing emphasis on patient-centered care models are expected to create significant opportunities for future expansion As precision medicine continues to advance, the Personalized Immunotherapy market is projected to experience sustained growth driven by innovation, clinical adoption, and increasing demand from both developed and emerging markets.

Segmental Analysis

The personalized immunotherapy market is segmented by therapy type, application, distribution channel, and geographic regions. By therapy type, personalized immunotherapy market is divided into Monoclonal Antibodies, Non-Specific Immunotherapies, Cytokines, T-Cell Therapy, and Cancer Vaccines. In terms of application, personalized immunotherapy market is classified into Breast Cancer, Prostate Cancer, Brain Cancer, Leukemia, and Others. Based on distribution channel, personalized immunotherapy market is segmented into Hospital Pharmacies, Retail Pharmacies, and Drug Stores. Regionally, the personalized immunotherapy industry is classified into North America, Latin America, Western Europe, Eastern Europe, Balkan & Baltic Countries, Russia & Belarus, Central Asia, East Asia, South Asia & Pacific, and the Middle East & Africa.
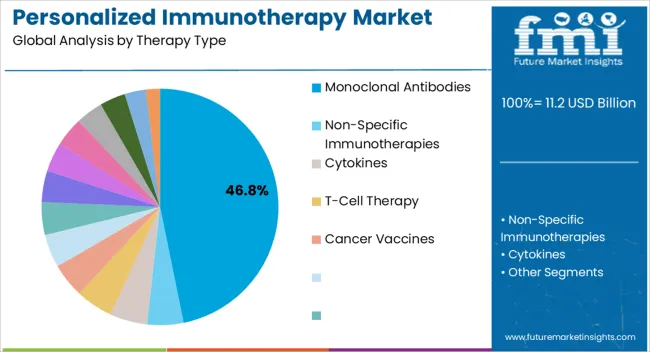
Insights into the Monoclonal Antibodies Segment

Personalized Immunotherapy Market Analysis By Therapy Type

The Monoclonal Antibodies therapy type is projected to hold 46.80% of the Personalized Immunotherapy market revenue share in 2025, establishing it as the leading therapy type. This dominance is being attributed to the ability of monoclonal antibodies to selectively target specific antigens, enhancing efficacy while reducing off-target effects. The growth of this segment has been facilitated by significant clinical adoption across oncology, autoimmune disorders, and infectious disease treatments.

Monoclonal antibodies allow for the development of personalized treatment regimens that are adaptable to patient-specific molecular profiles. The segment has benefited from technological advances in antibody engineering, including humanized and bispecific antibodies, which improve safety and therapeutic outcomes. Furthermore, the scalability of production and compatibility with hospital-based infusion protocols have reinforced its widespread adoption.

The ability to integrate these therapies with companion diagnostics and real-time patient monitoring systems has also strengthened their position as the preferred immunotherapy modality As precision medicine becomes central to modern healthcare, monoclonal antibodies are expected to continue driving revenue in this market.
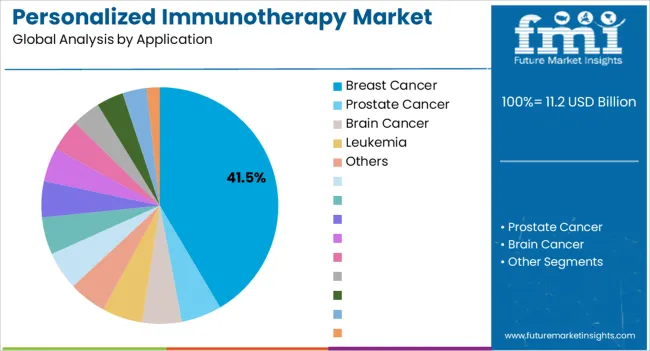
Insights into the Breast Cancer Application Segment

Personalized Immunotherapy Market Analysis By Application

The Breast Cancer application segment is expected to account for 41.50% of Personalized Immunotherapy market revenue in 2025, making it the dominant application. This prominence is being driven by the high prevalence of breast cancer and the need for targeted, patient-specific therapies that improve survival rates and reduce recurrence. Personalized immunotherapy has been increasingly applied to breast cancer due to its capacity to address heterogeneity in tumor biology, allowing therapies to be tailored to molecular subtypes.

The integration of biomarker-based diagnostics and companion testing has enabled precise identification of eligible patients, enhancing treatment outcomes. Clinical adoption has been further supported by growing awareness among oncologists and patients regarding the advantages of individualized therapy, particularly in advanced and metastatic cases.

The segment’s growth has been reinforced by expanding access to treatment in hospital and clinical settings, coupled with regulatory approvals for novel immunotherapeutic options As research continues to uncover new molecular targets, breast cancer is expected to remain the leading application driving the Personalized Immunotherapy market.
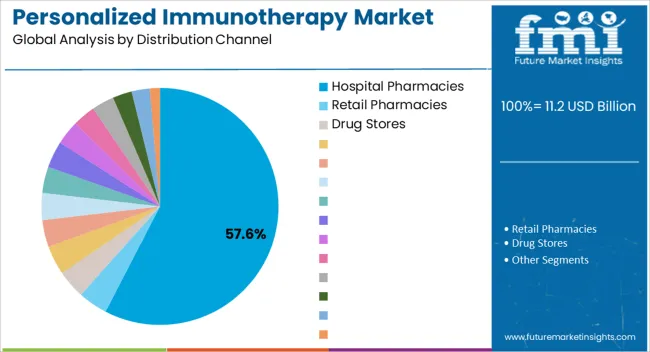
Insights into the Hospital Pharmacies Distribution Channel Segment

Personalized Immunotherapy Market Analysis By Distribution Channel

The Hospital Pharmacies distribution channel segment is anticipated to hold 57.60% of the Personalized Immunotherapy market revenue in 2025, establishing it as the leading distribution channel. This dominance is being attributed to the controlled and highly regulated nature of hospital pharmacy environments, which ensures proper storage, handling, and administration of complex immunotherapeutic agents. Hospital pharmacies provide centralized management of therapy dispensing, allowing for integration with patient treatment plans and clinical monitoring systems.

The growth of this segment has been supported by hospitals’ increasing investment in oncology and specialty care services, along with expanded infrastructure to accommodate advanced therapies. Additionally, hospital pharmacies offer trained personnel capable of managing biologic therapies and administering them under strict clinical protocols, which is critical for patient safety.

The segment has benefited from partnerships between therapy developers and healthcare institutions that streamline supply chains and enhance accessibility As personalized immunotherapy adoption expands, hospital pharmacies are expected to continue serving as the primary distribution channel, facilitating safe and effective delivery of these therapies.

Market Overview

Personalized Immunotherapy Market Overview

Personalized immunotherapy is a biologic treatment for different type of cancer. Personalized immunotherapy boost the natural body defence system time to overcome with the cancer. Personalized immunotherapy uses the substance which are made up of human body or prepared in the laboratory to improve or restore the immune system of body. Personalized immunotherapy target to restore the immune system of human body to combat the cancer cell.

Immune checkpoint blockade through anti-PD-1, PD-L1, and CTLA-4 inhibitors are the key substances which are used during the personalized immunotherapy. The most common used drugs for the personalized immunotherapy is Ipilimumab, Nivolumab, Pembrolizumab, Atezolizumab, Avelumab, and Durvalumab. Personalized immunotherapy is mostly used to treat the leukaemia, non-melanoma cancer, and more recently to treat mid-stage lung cancer. Only7 fraction of people are expected to show dramatic side effect after the personalized immunotherapy for treatment of cancer.
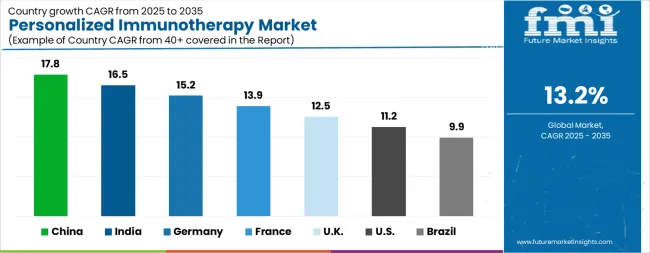
Analysis of Personalized Immunotherapy Market By Key Countries

Personalized Immunotherapy Market Cagr Analysis By Country
Country CAGR
China 17.8%
India 16.5%
Germany 15.2%
France 13.9%
UK 12.5%
USA 11.2%
Brazil 9.9%

Country-wise Analysis

The Personalized Immunotherapy Market is expected to register a CAGR of 13.2% during the forecast period, exhibiting varied country level momentum. China leads with the highest CAGR of 17.8%, followed by India at 16.5%. Developed markets such as Germany, France, and the UK continue to expand steadily, while the USA is likely to grow at consistent rates. Brazil posts the lowest CAGR at 9.9%, yet still underscores a broadly positive trajectory for the global Personalized Immunotherapy Market. In 2024, Germany held a dominant revenue in the Western Europe market and is expected to grow with a CAGR of 15.2%. The USAPersonalized Immunotherapy Market is estimated to be valued at USD 4.2 billion in 2025 and is anticipated to reach a valuation of USD 12.1 billion by 2035. Sales are projected to rise at a CAGR of 11.2% over the forecast period between 2025 and 2035. While Japan and South Korea markets are estimated to be valued at USD 502.8 million and USD 373.4 million respectively in 2025.
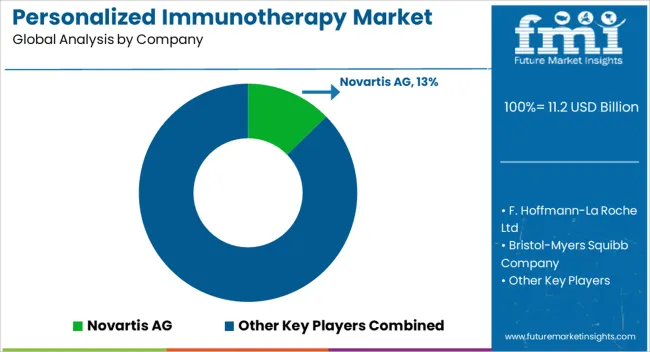
Key Players in the Personalized Immunotherapy Market

Personalized Immunotherapy Market Analysis By Company

  • Novartis AG
  • F. Hoffmann-La Roche Ltd
  • Bristol-Myers Squibb Company
  • Merck & Co., Inc.
  • Pfizer Inc.
  • Gilead Sciences, Inc.
  • Amgen Inc.
  • Johnson & Johnson
  • AstraZeneca plc
  • GlaxoSmithKline plc
  • Sanofi S.A.
  • Eli Lilly and Company
  • Bluebird Bio, Inc.
  • Adaptimmune Therapeutics plc
  • Kite Pharma (a Gilead Company)
  • Cellectis S.A.
  • Autolus Therapeutics plc

Scope of the Report

Item Value
Quantitative Units USD 11.2 Billion
Therapy Type Monoclonal Antibodies, Non-Specific Immunotherapies, Cytokines, T-Cell Therapy, and Cancer Vaccines
Application Breast Cancer, Prostate Cancer, Brain Cancer, Leukemia, and Others
Distribution Channel Hospital Pharmacies, Retail Pharmacies, and Drug Stores
Regions Covered North America, Europe, Asia-Pacific, Latin America, Middle East & Africa
Country Covered United States, Canada, Germany, France, United Kingdom, China, Japan, India, Brazil, South Africa
Key Companies Profiled Novartis AG, F. Hoffmann-La Roche Ltd, Bristol-Myers Squibb Company, Merck & Co., Inc., Pfizer Inc., Gilead Sciences, Inc., Amgen Inc., Johnson & Johnson, AstraZeneca plc, GlaxoSmithKline plc, Sanofi S.A., Eli Lilly and Company, Bluebird Bio, Inc., Adaptimmune Therapeutics plc, Kite Pharma (a Gilead Company), Cellectis S.A., and Autolus Therapeutics plc

Personalized Immunotherapy Market by Segments

Therapy Type:

  • Monoclonal Antibodies
  • Non-Specific Immunotherapies
  • Cytokines
  • T-Cell Therapy
  • Cancer Vaccines

Application:

  • Breast Cancer
  • Prostate Cancer
  • Brain Cancer
  • Leukemia
  • Others

Distribution Channel:

  • Hospital Pharmacies
  • Retail Pharmacies
  • Drug Stores

Region:

  • North America
    • USA
    • Canada
    • Mexico
  • Latin America
    • Brazil
    • Chile
    • Rest of Latin America
  • Western Europe
    • Germany
    • UK
    • Italy
    • Spain
    • France
    • Nordic
    • BENELUX
    • Rest of Western Europe
  • Eastern Europe
    • Russia
    • Poland
    • Hungary
    • Balkan & Baltic
    • Rest of Eastern Europe
  • East Asia
    • China
    • Japan
    • South Korea
  • South Asia and Pacific
    • India
    • ASEAN
    • Australia & New Zealand
    • Rest of South Asia and Pacific
  • Middle East & Africa
    • Kingdom of Saudi Arabia
    • Other GCC Countries
    • Turkiye
    • South Africa
    • Other African Union
    • Rest of Middle East & Africa

Table of Content

  1. Executive Summary
    • Global Market Outlook
    • Demand-side Trends
    • Supply-side Trends
    • Technology Roadmap Analysis
    • Analysis and Recommendations
  2. Market Overview
    • Market Coverage / Taxonomy
    • Market Definition / Scope / Limitations
  3. Market Background
    • Market Dynamics
      • Drivers
      • Restraints
      • Opportunity
      • Trends
    • Scenario Forecast
      • Demand in Optimistic Scenario
      • Demand in Likely Scenario
      • Demand in Conservative Scenario
    • Opportunity Map Analysis
    • Product Life Cycle Analysis
    • Supply Chain Analysis
    • Investment Feasibility Matrix
    • Value Chain Analysis
    • PESTLE and Porter’s Analysis
    • Regulatory Landscape
    • Regional Parent Market Outlook
    • Production and Consumption Statistics
    • Import and Export Statistics
  4. Global Market Analysis 2020 to 2024 and Forecast, 2025 to 2035
    • Historical Market Size Value (USD Million) Analysis, 2020 to 2024
    • Current and Future Market Size Value (USD Million) Projections, 2025 to 2035
      • Y-o-Y Growth Trend Analysis
      • Absolute $ Opportunity Analysis
  5. Global Market Pricing Analysis 2020 to 2024 and Forecast 2025 to 2035
  6. Global Market Analysis 2020 to 2024 and Forecast 2025 to 2035, By Therapy Type
    • Introduction / Key Findings
    • Historical Market Size Value (USD Million) Analysis By Therapy Type , 2020 to 2024
    • Current and Future Market Size Value (USD Million) Analysis and Forecast By Therapy Type , 2025 to 2035
      • Monoclonal Antibodies
      • Non-Specific Immunotherapies
      • Cytokines
      • T-Cell Therapy
      • Cancer Vaccines
    • Y-o-Y Growth Trend Analysis By Therapy Type , 2020 to 2024
    • Absolute $ Opportunity Analysis By Therapy Type , 2025 to 2035
  7. Global Market Analysis 2020 to 2024 and Forecast 2025 to 2035, By Application
    • Introduction / Key Findings
    • Historical Market Size Value (USD Million) Analysis By Application, 2020 to 2024
    • Current and Future Market Size Value (USD Million) Analysis and Forecast By Application, 2025 to 2035
      • Breast Cancer
      • Prostate Cancer
      • Brain Cancer
      • Leukemia
      • Others
    • Y-o-Y Growth Trend Analysis By Application, 2020 to 2024
    • Absolute $ Opportunity Analysis By Application, 2025 to 2035
  8. Global Market Analysis 2020 to 2024 and Forecast 2025 to 2035, By Distribution Channel
    • Introduction / Key Findings
    • Historical Market Size Value (USD Million) Analysis By Distribution Channel, 2020 to 2024
    • Current and Future Market Size Value (USD Million) Analysis and Forecast By Distribution Channel, 2025 to 2035
      • Hospital Pharmacies
      • Retail Pharmacies
      • Drug Stores
    • Y-o-Y Growth Trend Analysis By Distribution Channel, 2020 to 2024
    • Absolute $ Opportunity Analysis By Distribution Channel, 2025 to 2035
  9. Global Market Analysis 2020 to 2024 and Forecast 2025 to 2035, By Region
    • Introduction
    • Historical Market Size Value (USD Million) Analysis By Region, 2020 to 2024
    • Current Market Size Value (USD Million) Analysis and Forecast By Region, 2025 to 2035
      • North America
      • Latin America
      • Western Europe
      • Eastern Europe
      • East Asia
      • South Asia and Pacific
      • Middle East & Africa
    • Market Attractiveness Analysis By Region
  10. North America Market Analysis 2020 to 2024 and Forecast 2025 to 2035, By Country
    • Historical Market Size Value (USD Million) Trend Analysis By Market Taxonomy, 2020 to 2024
    • Market Size Value (USD Million) Forecast By Market Taxonomy, 2025 to 2035
      • By Country
        • USA
        • Canada
        • Mexico
      • By Therapy Type
      • By Application
      • By Distribution Channel
    • Market Attractiveness Analysis
      • By Country
      • By Therapy Type
      • By Application
      • By Distribution Channel
    • Key Takeaways
  11. Latin America Market Analysis 2020 to 2024 and Forecast 2025 to 2035, By Country
    • Historical Market Size Value (USD Million) Trend Analysis By Market Taxonomy, 2020 to 2024
    • Market Size Value (USD Million) Forecast By Market Taxonomy, 2025 to 2035
      • By Country
        • Brazil
        • Chile
        • Rest of Latin America
      • By Therapy Type
      • By Application
      • By Distribution Channel
    • Market Attractiveness Analysis
      • By Country
      • By Therapy Type
      • By Application
      • By Distribution Channel
    • Key Takeaways
  12. Western Europe Market Analysis 2020 to 2024 and Forecast 2025 to 2035, By Country
    • Historical Market Size Value (USD Million) Trend Analysis By Market Taxonomy, 2020 to 2024
    • Market Size Value (USD Million) Forecast By Market Taxonomy, 2025 to 2035
      • By Country
        • Germany
        • UK
        • Italy
        • Spain
        • France
        • Nordic
        • BENELUX
        • Rest of Western Europe
      • By Therapy Type
      • By Application
      • By Distribution Channel
    • Market Attractiveness Analysis
      • By Country
      • By Therapy Type
      • By Application
      • By Distribution Channel
    • Key Takeaways
  13. Eastern Europe Market Analysis 2020 to 2024 and Forecast 2025 to 2035, By Country
    • Historical Market Size Value (USD Million) Trend Analysis By Market Taxonomy, 2020 to 2024
    • Market Size Value (USD Million) Forecast By Market Taxonomy, 2025 to 2035
      • By Country
        • Russia
        • Poland
        • Hungary
        • Balkan & Baltic
        • Rest of Eastern Europe
      • By Therapy Type
      • By Application
      • By Distribution Channel
    • Market Attractiveness Analysis
      • By Country
      • By Therapy Type
      • By Application
      • By Distribution Channel
    • Key Takeaways
  14. East Asia Market Analysis 2020 to 2024 and Forecast 2025 to 2035, By Country
    • Historical Market Size Value (USD Million) Trend Analysis By Market Taxonomy, 2020 to 2024
    • Market Size Value (USD Million) Forecast By Market Taxonomy, 2025 to 2035
      • By Country
        • China
        • Japan
        • South Korea
      • By Therapy Type
      • By Application
      • By Distribution Channel
    • Market Attractiveness Analysis
      • By Country
      • By Therapy Type
      • By Application
      • By Distribution Channel
    • Key Takeaways
  15. South Asia and Pacific Market Analysis 2020 to 2024 and Forecast 2025 to 2035, By Country
    • Historical Market Size Value (USD Million) Trend Analysis By Market Taxonomy, 2020 to 2024
    • Market Size Value (USD Million) Forecast By Market Taxonomy, 2025 to 2035
      • By Country
        • India
        • ASEAN
        • Australia & New Zealand
        • Rest of South Asia and Pacific
      • By Therapy Type
      • By Application
      • By Distribution Channel
    • Market Attractiveness Analysis
      • By Country
      • By Therapy Type
      • By Application
      • By Distribution Channel
    • Key Takeaways
  16. Middle East & Africa Market Analysis 2020 to 2024 and Forecast 2025 to 2035, By Country
    • Historical Market Size Value (USD Million) Trend Analysis By Market Taxonomy, 2020 to 2024
    • Market Size Value (USD Million) Forecast By Market Taxonomy, 2025 to 2035
      • By Country
        • Kingdom of Saudi Arabia
        • Other GCC Countries
        • Turkiye
        • South Africa
        • Other African Union
        • Rest of Middle East & Africa
      • By Therapy Type
      • By Application
      • By Distribution Channel
    • Market Attractiveness Analysis
      • By Country
      • By Therapy Type
      • By Application
      • By Distribution Channel
    • Key Takeaways
  17. Key Countries Market Analysis
    • USA
      • Pricing Analysis
      • Market Share Analysis, 2024
        • By Therapy Type
        • By Application
        • By Distribution Channel
    • Canada
      • Pricing Analysis
      • Market Share Analysis, 2024
        • By Therapy Type
        • By Application
        • By Distribution Channel
    • Mexico
      • Pricing Analysis
      • Market Share Analysis, 2024
        • By Therapy Type
        • By Application
        • By Distribution Channel
    • Brazil
      • Pricing Analysis
      • Market Share Analysis, 2024
        • By Therapy Type
        • By Application
        • By Distribution Channel
    • Chile
      • Pricing Analysis
      • Market Share Analysis, 2024
        • By Therapy Type
        • By Application
        • By Distribution Channel
    • Germany
      • Pricing Analysis
      • Market Share Analysis, 2024
        • By Therapy Type
        • By Application
        • By Distribution Channel
    • UK
      • Pricing Analysis
      • Market Share Analysis, 2024
        • By Therapy Type
        • By Application
        • By Distribution Channel
    • Italy
      • Pricing Analysis
      • Market Share Analysis, 2024
        • By Therapy Type
        • By Application
        • By Distribution Channel
    • Spain
      • Pricing Analysis
      • Market Share Analysis, 2024
        • By Therapy Type
        • By Application
        • By Distribution Channel
    • France
      • Pricing Analysis
      • Market Share Analysis, 2024
        • By Therapy Type
        • By Application
        • By Distribution Channel
    • India
      • Pricing Analysis
      • Market Share Analysis, 2024
        • By Therapy Type
        • By Application
        • By Distribution Channel
    • ASEAN
      • Pricing Analysis
      • Market Share Analysis, 2024
        • By Therapy Type
        • By Application
        • By Distribution Channel
    • Australia & New Zealand
      • Pricing Analysis
      • Market Share Analysis, 2024
        • By Therapy Type
        • By Application
        • By Distribution Channel
    • China
      • Pricing Analysis
      • Market Share Analysis, 2024
        • By Therapy Type
        • By Application
        • By Distribution Channel
    • Japan
      • Pricing Analysis
      • Market Share Analysis, 2024
        • By Therapy Type
        • By Application
        • By Distribution Channel
    • South Korea
      • Pricing Analysis
      • Market Share Analysis, 2024
        • By Therapy Type
        • By Application
        • By Distribution Channel
    • Russia
      • Pricing Analysis
      • Market Share Analysis, 2024
        • By Therapy Type
        • By Application
        • By Distribution Channel
    • Poland
      • Pricing Analysis
      • Market Share Analysis, 2024
        • By Therapy Type
        • By Application
        • By Distribution Channel
    • Hungary
      • Pricing Analysis
      • Market Share Analysis, 2024
        • By Therapy Type
        • By Application
        • By Distribution Channel
    • Kingdom of Saudi Arabia
      • Pricing Analysis
      • Market Share Analysis, 2024
        • By Therapy Type
        • By Application
        • By Distribution Channel
    • Turkiye
      • Pricing Analysis
      • Market Share Analysis, 2024
        • By Therapy Type
        • By Application
        • By Distribution Channel
    • South Africa
      • Pricing Analysis
      • Market Share Analysis, 2024
        • By Therapy Type
        • By Application
        • By Distribution Channel
  18. Market Structure Analysis
    • Competition Dashboard
    • Competition Benchmarking
    • Market Share Analysis of Top Players
      • By Regional
      • By Therapy Type
      • By Application
      • By Distribution Channel
  19. Competition Analysis
    • Competition Deep Dive
      • Novartis AG
        • Overview
        • Product Portfolio
        • Profitability by Market Segments (Product/Age /Sales Channel/Region)
        • Sales Footprint
        • Strategy Overview
          • Marketing Strategy
          • Product Strategy
          • Channel Strategy
      • F. Hoffmann-La Roche Ltd
      • Bristol-Myers Squibb Company
      • Merck & Co., Inc.
      • Pfizer Inc.
      • Gilead Sciences, Inc.
      • Amgen Inc.
      • Johnson & Johnson
      • AstraZeneca plc
      • GlaxoSmithKline plc
      • Sanofi S.A.
      • Eli Lilly and Company
      • Bluebird Bio, Inc.
      • Adaptimmune Therapeutics plc
      • Kite Pharma (a Gilead Company)
      • Cellectis S.A.
      • Autolus Therapeutics plc
  20. Assumptions & Acronyms Used
  21. Research Methodology

List of Tables

  • Table 1: Global Market Value (USD Million) Forecast by Region, 2020-2035
  • Table 2: Global Market Value (USD Million) Forecast by Therapy Type , 2020-2035
  • Table 3: Global Market Value (USD Million) Forecast by Application, 2020-2035
  • Table 4: Global Market Value (USD Million) Forecast by Distribution Channel, 2020-2035
  • Table 5: North America Market Value (USD Million) Forecast by Country, 2020-2035
  • Table 6: North America Market Value (USD Million) Forecast by Therapy Type , 2020-2035
  • Table 7: North America Market Value (USD Million) Forecast by Application, 2020-2035
  • Table 8: North America Market Value (USD Million) Forecast by Distribution Channel, 2020-2035
  • Table 9: Latin America Market Value (USD Million) Forecast by Country, 2020-2035
  • Table 10: Latin America Market Value (USD Million) Forecast by Therapy Type , 2020-2035
  • Table 11: Latin America Market Value (USD Million) Forecast by Application, 2020-2035
  • Table 12: Latin America Market Value (USD Million) Forecast by Distribution Channel, 2020-2035
  • Table 13: Western Europe Market Value (USD Million) Forecast by Country, 2020-2035
  • Table 14: Western Europe Market Value (USD Million) Forecast by Therapy Type , 2020-2035
  • Table 15: Western Europe Market Value (USD Million) Forecast by Application, 2020-2035
  • Table 16: Western Europe Market Value (USD Million) Forecast by Distribution Channel, 2020-2035
  • Table 17: Eastern Europe Market Value (USD Million) Forecast by Country, 2020-2035
  • Table 18: Eastern Europe Market Value (USD Million) Forecast by Therapy Type , 2020-2035
  • Table 19: Eastern Europe Market Value (USD Million) Forecast by Application, 2020-2035
  • Table 20: Eastern Europe Market Value (USD Million) Forecast by Distribution Channel, 2020-2035
  • Table 21: East Asia Market Value (USD Million) Forecast by Country, 2020-2035
  • Table 22: East Asia Market Value (USD Million) Forecast by Therapy Type , 2020-2035
  • Table 23: East Asia Market Value (USD Million) Forecast by Application, 2020-2035
  • Table 24: East Asia Market Value (USD Million) Forecast by Distribution Channel, 2020-2035
  • Table 25: South Asia and Pacific Market Value (USD Million) Forecast by Country, 2020-2035
  • Table 26: South Asia and Pacific Market Value (USD Million) Forecast by Therapy Type , 2020-2035
  • Table 27: South Asia and Pacific Market Value (USD Million) Forecast by Application, 2020-2035
  • Table 28: South Asia and Pacific Market Value (USD Million) Forecast by Distribution Channel, 2020-2035
  • Table 29: Middle East & Africa Market Value (USD Million) Forecast by Country, 2020-2035
  • Table 30: Middle East & Africa Market Value (USD Million) Forecast by Therapy Type , 2020-2035
  • Table 31: Middle East & Africa Market Value (USD Million) Forecast by Application, 2020-2035
  • Table 32: Middle East & Africa Market Value (USD Million) Forecast by Distribution Channel, 2020-2035

List of Figures

  • Figure 1: Global Market Pricing Analysis
  • Figure 2: Global Market Value (USD Million) Forecast 2020-2035
  • Figure 3: Global Market Value Share and BPS Analysis by Therapy Type , 2025 and 2035
  • Figure 4: Global Market Y-o-Y Growth Comparison by Therapy Type , 2025-2035
  • Figure 5: Global Market Attractiveness Analysis by Therapy Type
  • Figure 6: Global Market Value Share and BPS Analysis by Application, 2025 and 2035
  • Figure 7: Global Market Y-o-Y Growth Comparison by Application, 2025-2035
  • Figure 8: Global Market Attractiveness Analysis by Application
  • Figure 9: Global Market Value Share and BPS Analysis by Distribution Channel, 2025 and 2035
  • Figure 10: Global Market Y-o-Y Growth Comparison by Distribution Channel, 2025-2035
  • Figure 11: Global Market Attractiveness Analysis by Distribution Channel
  • Figure 12: Global Market Value (USD Million) Share and BPS Analysis by Region, 2025 and 2035
  • Figure 13: Global Market Y-o-Y Growth Comparison by Region, 2025-2035
  • Figure 14: Global Market Attractiveness Analysis by Region
  • Figure 15: North America Market Incremental Dollar Opportunity, 2025-2035
  • Figure 16: Latin America Market Incremental Dollar Opportunity, 2025-2035
  • Figure 17: Western Europe Market Incremental Dollar Opportunity, 2025-2035
  • Figure 18: Eastern Europe Market Incremental Dollar Opportunity, 2025-2035
  • Figure 19: East Asia Market Incremental Dollar Opportunity, 2025-2035
  • Figure 20: South Asia and Pacific Market Incremental Dollar Opportunity, 2025-2035
  • Figure 21: Middle East & Africa Market Incremental Dollar Opportunity, 2025-2035
  • Figure 22: North America Market Value Share and BPS Analysis by Country, 2025 and 2035
  • Figure 23: North America Market Value Share and BPS Analysis by Therapy Type , 2025 and 2035
  • Figure 24: North America Market Y-o-Y Growth Comparison by Therapy Type , 2025-2035
  • Figure 25: North America Market Attractiveness Analysis by Therapy Type
  • Figure 26: North America Market Value Share and BPS Analysis by Application, 2025 and 2035
  • Figure 27: North America Market Y-o-Y Growth Comparison by Application, 2025-2035
  • Figure 28: North America Market Attractiveness Analysis by Application
  • Figure 29: North America Market Value Share and BPS Analysis by Distribution Channel, 2025 and 2035
  • Figure 30: North America Market Y-o-Y Growth Comparison by Distribution Channel, 2025-2035
  • Figure 31: North America Market Attractiveness Analysis by Distribution Channel
  • Figure 32: Latin America Market Value Share and BPS Analysis by Country, 2025 and 2035
  • Figure 33: Latin America Market Value Share and BPS Analysis by Therapy Type , 2025 and 2035
  • Figure 34: Latin America Market Y-o-Y Growth Comparison by Therapy Type , 2025-2035
  • Figure 35: Latin America Market Attractiveness Analysis by Therapy Type
  • Figure 36: Latin America Market Value Share and BPS Analysis by Application, 2025 and 2035
  • Figure 37: Latin America Market Y-o-Y Growth Comparison by Application, 2025-2035
  • Figure 38: Latin America Market Attractiveness Analysis by Application
  • Figure 39: Latin America Market Value Share and BPS Analysis by Distribution Channel, 2025 and 2035
  • Figure 40: Latin America Market Y-o-Y Growth Comparison by Distribution Channel, 2025-2035
  • Figure 41: Latin America Market Attractiveness Analysis by Distribution Channel
  • Figure 42: Western Europe Market Value Share and BPS Analysis by Country, 2025 and 2035
  • Figure 43: Western Europe Market Value Share and BPS Analysis by Therapy Type , 2025 and 2035
  • Figure 44: Western Europe Market Y-o-Y Growth Comparison by Therapy Type , 2025-2035
  • Figure 45: Western Europe Market Attractiveness Analysis by Therapy Type
  • Figure 46: Western Europe Market Value Share and BPS Analysis by Application, 2025 and 2035
  • Figure 47: Western Europe Market Y-o-Y Growth Comparison by Application, 2025-2035
  • Figure 48: Western Europe Market Attractiveness Analysis by Application
  • Figure 49: Western Europe Market Value Share and BPS Analysis by Distribution Channel, 2025 and 2035
  • Figure 50: Western Europe Market Y-o-Y Growth Comparison by Distribution Channel, 2025-2035
  • Figure 51: Western Europe Market Attractiveness Analysis by Distribution Channel
  • Figure 52: Eastern Europe Market Value Share and BPS Analysis by Country, 2025 and 2035
  • Figure 53: Eastern Europe Market Value Share and BPS Analysis by Therapy Type , 2025 and 2035
  • Figure 54: Eastern Europe Market Y-o-Y Growth Comparison by Therapy Type , 2025-2035
  • Figure 55: Eastern Europe Market Attractiveness Analysis by Therapy Type
  • Figure 56: Eastern Europe Market Value Share and BPS Analysis by Application, 2025 and 2035
  • Figure 57: Eastern Europe Market Y-o-Y Growth Comparison by Application, 2025-2035
  • Figure 58: Eastern Europe Market Attractiveness Analysis by Application
  • Figure 59: Eastern Europe Market Value Share and BPS Analysis by Distribution Channel, 2025 and 2035
  • Figure 60: Eastern Europe Market Y-o-Y Growth Comparison by Distribution Channel, 2025-2035
  • Figure 61: Eastern Europe Market Attractiveness Analysis by Distribution Channel
  • Figure 62: East Asia Market Value Share and BPS Analysis by Country, 2025 and 2035
  • Figure 63: East Asia Market Value Share and BPS Analysis by Therapy Type , 2025 and 2035
  • Figure 64: East Asia Market Y-o-Y Growth Comparison by Therapy Type , 2025-2035
  • Figure 65: East Asia Market Attractiveness Analysis by Therapy Type
  • Figure 66: East Asia Market Value Share and BPS Analysis by Application, 2025 and 2035
  • Figure 67: East Asia Market Y-o-Y Growth Comparison by Application, 2025-2035
  • Figure 68: East Asia Market Attractiveness Analysis by Application
  • Figure 69: East Asia Market Value Share and BPS Analysis by Distribution Channel, 2025 and 2035
  • Figure 70: East Asia Market Y-o-Y Growth Comparison by Distribution Channel, 2025-2035
  • Figure 71: East Asia Market Attractiveness Analysis by Distribution Channel
  • Figure 72: South Asia and Pacific Market Value Share and BPS Analysis by Country, 2025 and 2035
  • Figure 73: South Asia and Pacific Market Value Share and BPS Analysis by Therapy Type , 2025 and 2035
  • Figure 74: South Asia and Pacific Market Y-o-Y Growth Comparison by Therapy Type , 2025-2035
  • Figure 75: South Asia and Pacific Market Attractiveness Analysis by Therapy Type
  • Figure 76: South Asia and Pacific Market Value Share and BPS Analysis by Application, 2025 and 2035
  • Figure 77: South Asia and Pacific Market Y-o-Y Growth Comparison by Application, 2025-2035
  • Figure 78: South Asia and Pacific Market Attractiveness Analysis by Application
  • Figure 79: South Asia and Pacific Market Value Share and BPS Analysis by Distribution Channel, 2025 and 2035
  • Figure 80: South Asia and Pacific Market Y-o-Y Growth Comparison by Distribution Channel, 2025-2035
  • Figure 81: South Asia and Pacific Market Attractiveness Analysis by Distribution Channel
  • Figure 82: Middle East & Africa Market Value Share and BPS Analysis by Country, 2025 and 2035
  • Figure 83: Middle East & Africa Market Value Share and BPS Analysis by Therapy Type , 2025 and 2035
  • Figure 84: Middle East & Africa Market Y-o-Y Growth Comparison by Therapy Type , 2025-2035
  • Figure 85: Middle East & Africa Market Attractiveness Analysis by Therapy Type
  • Figure 86: Middle East & Africa Market Value Share and BPS Analysis by Application, 2025 and 2035
  • Figure 87: Middle East & Africa Market Y-o-Y Growth Comparison by Application, 2025-2035
  • Figure 88: Middle East & Africa Market Attractiveness Analysis by Application
  • Figure 89: Middle East & Africa Market Value Share and BPS Analysis by Distribution Channel, 2025 and 2035
  • Figure 90: Middle East & Africa Market Y-o-Y Growth Comparison by Distribution Channel, 2025-2035
  • Figure 91: Middle East & Africa Market Attractiveness Analysis by Distribution Channel
  • Figure 92: Global Market - Tier Structure Analysis
  • Figure 93: Global Market - Company Share Analysis

Frequently Asked Questions

How big is the personalized immunotherapy market in 2025?

The global personalized immunotherapy market is estimated to be valued at USD 11.2 billion in 2025.

What will be the size of personalized immunotherapy market in 2035?

The market size for the personalized immunotherapy market is projected to reach USD 38.6 billion by 2035.

How much will be the personalized immunotherapy market growth between 2025 and 2035?

The personalized immunotherapy market is expected to grow at a 13.2% CAGR between 2025 and 2035.

What are the key product types in the personalized immunotherapy market?

The key product types in personalized immunotherapy market are monoclonal antibodies, non-specific immunotherapies, cytokines, t-cell therapy and cancer vaccines.

Which application segment to contribute significant share in the personalized immunotherapy market in 2025?

In terms of application, breast cancer segment to command 41.5% share in the personalized immunotherapy market in 2025.

Explore Similar Insights

Future Market Insights

Personalized Immunotherapy Market

Chat With MaRIA

Chat With

MaRIA

Hi There, I am MaRIA, Your Market Research Intelligence Assistant. How may I help you?