3D-Printed Personalized Masks Market Size and Share Forecast Outlook 2025 to 2035

The 3D-Printed Personalized Masks Market is expected to record a valuation of USD 1,050.3 million in 2025 and USD 4,200.5 million in 2035, with an increase of USD 3,150.2 million, which equals a growth of 193% over the decade. The overall expansion represents a CAGR of 14.9% and a 2X increase in market size.
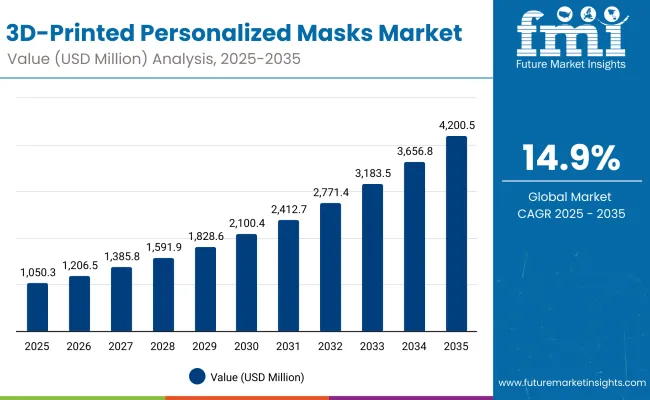
3d Printed Personalized Masks Market Value Analysis

Quick Stats for 3D-Printed Personalized Masks Market

  • 3D-Printed Personalized Masks Market Value (2025): USD 1,050.3 million
  • 3D-Printed Personalized Masks Market Forecast Value (2035): USD 4,200.5 million
  • 3D-Printed Personalized Masks Market Forecast CAGR: 14.9%
  • Leading Segment in 3D-Printed Personalized Masks Market in 2025: At-home kits (52.5%)
  • Key Growth Regions in the 3D-Printed Personalized Masks Market: Asia-Pacific, North America, Europe
  • Top Key Players in 3D-Printed Personalized Masks Market: L’Oréal Perso, Neutrogena MaskiD, Shiseido, Amorepacific, Procter & Gamble, Raphas, CELLINK, Stratasys, BASF Care Creations, Skintifique

3D-Printed Personalized Masks Market Key Takeaways

Metric Value
3D-Printed Personalized Masks Market Estimated Value in (2025E) USD 1,050.3 million
3D-Printed Personalized Masks Market Forecast Value in (2035F) USD 4,200.5 million
Forecast CAGR (2025 to 2035) 14.9%

During the first five-year period from 2025 to 2030, the market increases from USD 1,050.3 million to USD 2,100.4 million, adding USD 1,050.1 million, which accounts for 33.3% of the total decade growth. This phase records steady adoption in at-home personalized skincare kits and sheet mask customization, driven by the need for hydration and anti-aging solutions. At-home kits dominate this period as they cater to over 52.5% of consumer demand, while hydration-based functions account for 46.6% of total usage.

The second half from 2030 to 2035 contributes USD 2,100.1 million, equal to 66.7% of total growth, as the market jumps from USD 2,100.4 million to USD 4,200.5 million. This acceleration is powered by widespread deployment of AI-driven personalization engines, dermatology clinic integration, and 3D bioprinting advancements. Custom-fit gels, patches, and capsules expand their share, while sheet masks maintain a near-equal balance of 49.9% in 2025 and 51.2% in China alone. Clinic-based adoption and in-store kiosks are expected to strengthen in this phase, complementing the at-home kit segment and diversifying revenue streams.

From 2020 to 2024, the 3D-Printed Personalized Masks Market grew from a nascent niche to a structured ecosystem valued in the hundreds of millions of USD, driven largely by hardware-centric adoption of 3D printing technologies. During this early period, the competitive landscape was dominated by equipment manufacturers and material suppliers, who controlled nearly 70-75% of revenue.

Leaders such as Stratasys, CELLINK, and Raphas focused on precision printing hardware and bio-material formulations for healthcare and cosmetics applications. Competitive differentiation relied on printing accuracy, speed, and material safety, while software remained bundled as an auxiliary offering rather than a primary revenue stream. Service-based personalization models had minimal traction, contributing less than 10% of the total market value.

Demand for 3D-Printed Personalized Masks will expand to USD 1,050.3 million in 2025, and the revenue mix will start to shift as consumer-facing solutions and software-enabled services grow toward 30-35% share. Traditional hardware leaders face rising competition from digital-first beauty and healthcare players offering AI-driven personalization, skin-data visualization, and subscription-based mask replenishment services.

Major printing vendors are pivoting to hybrid models, integrating analytics, dermatology partnerships, and remote workflow capabilities to retain relevance. Emerging entrants specializing in cloud interoperability, AR/VR-driven consumer trials, and biotech-enabled mask formulations are gaining share. The competitive advantage is moving away from hardware innovation alone to ecosystem strength, recurring revenue, and consumer loyalty platforms.

Why the 3D-Printed Personalized Masks Market is growing?

Growth is fueled by the convergence of dermatological diagnostics with 3D mask production. Skin-analysis devices and smartphone-linked apps now map hydration levels, pore size, and pigmentation, enabling highly customized formulations. This diagnostic-driven approach transforms masks from generic skincare into precision treatments, making personalization the central value proposition and driving higher adoption across both at-home and clinical environments.

The incorporation of bio-inks and skin-compatible polymers into 3D printing has enabled masks that adapt to facial contours while carrying active ingredients more effectively. These materials allow longer wear times, better absorption, and even controlled release of actives like peptides or ceramides. As bioprinting technology matures, cosmetic brands are leveraging these innovations to differentiate premium offerings, pushing consumer demand for advanced personalized mask solutions.

Segmental Analysis

The 3D-Printed Personalized Masks Market is segmented by component, print technology, product type, function, consumer offering, end-use industry, and region. Components include hardware such as 3D printers, accessories, and software platforms that enable mask customization. Print technologies cover extrusion-based, inkjet bioprinting, and laser-assisted methods, each supporting different levels of precision and material compatibility.

Product types span sheet masks, patches, custom-fit gels, and capsules, while functions include hydration, anti-aging, brightening, and spot treatment. Consumer offerings extend across at-home kits, in-store kiosks, and dermatology clinics, reflecting diverse access points for personalization.

End-use industries include healthcare, consumer goods, sports and fitness, entertainment, and fashion. Regionally, the market scope spans North America, Latin America, Europe, Asia-Pacific, and the Middle East & Africa, with key countries such as the USA, China, Japan, India, Germany, France, and the UK shaping adoption trends.
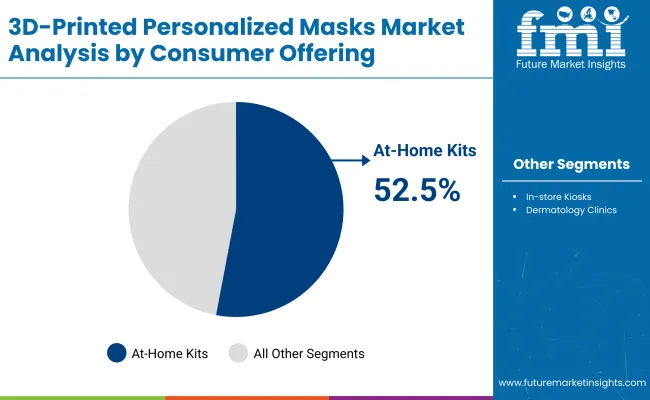
Insights into the Component Segment with At-Home Kits Leading in Market Share

3d Printed Personalized Masks Market By Consumer Offering

Consumer Offering Value Share % 2025
At-home kits 52.5%
Others 47.5%

The at-home kits segment is projected to contribute the largest share of the 3D-Printed Personalized Masks Market revenue in 2025, maintaining its lead as the dominant consumer offering category. This is driven by strong consumer demand for convenience, personalization, and immediate accessibility in skincare routines. At-home kits allow users to design and print masks tailored to their skin needs using portable devices or app-driven platforms, reducing reliance on clinics or retail kiosks.

The segment’s growth is further supported by cosmetic brands integrating AI-powered skin diagnostics into home-use devices, enabling data-driven customization. As material science and 3D bioprinting advance, at-home kits are expected to remain the backbone of the market, with wider adoption in premium skincare and wellness routines.
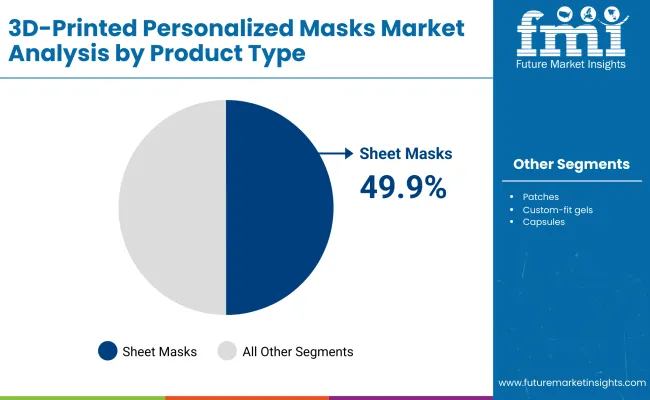
Insights into the Product Type Segment with Sheet Masks Leading in Market Share

3d Printed Personalized Masks Market By Product Type

Product Type Value Share % 2025
Sheet masks 49.9%
Others 50.1%

The sheet masks segment is forecasted to hold the leading share of the 3D-Printed Personalized Masks Market in 2025, driven by its familiarity and ease of consumer adoption. Personalized sheet masks align with existing skincare routines while offering a higher level of customization through 3D-printing technology, making them a preferred option among first-time users. Their lightweight, adaptable format allows precise layering of active ingredients, improving efficacy compared to traditional sheet masks. The segment’s growth is further supported by integration into both at-home kits and clinical offerings, where personalized designs enhance treatment outcomes. As consumer demand for convenient, customizable, and functional skincare grows, sheet masks are expected to retain their position as the most popular product type in the market.
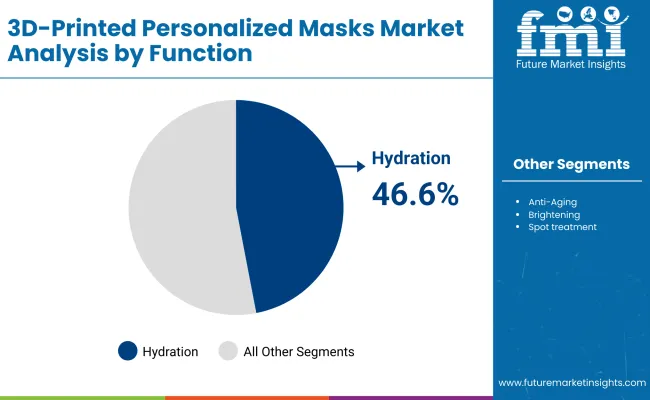
Insights into the Function Segment with Hydration Leading in Market Share

3d Printed Personalized Masks Market By Function

Function Value Share % 2025
Hydration 46.6%
Others 53.4%

The hydration segment is projected to account for the largest share of the 3D-Printed Personalized Masks Market revenue in 2025, establishing it as the leading function type. This segment benefits from widespread consumer demand for moisture-replenishing skincare, as hydration is considered the foundation of healthy skin across all demographics. Personalized hydration masks created through 3D printing allow precise placement of active ingredients, ensuring targeted delivery where skin needs it most.

The ease of adoption and universal relevance of hydration-focused products have made it a dominant driver of at-home kits and clinical solutions. As innovations in bio-inks and absorbent materials continue to enhance effectiveness, hydration is expected to maintain its leadership position in the market.

What are the Drivers, Restraints, and Key Trends of the 3D-Printed Personalized Masks Market?

AI-Powered Skin Diagnostics

The market is gaining momentum through the integration of AI-driven skin diagnostic tools that analyze hydration levels, pore structure, and pigmentation before generating mask blueprints. This synergy between data analytics and 3D printing enables ultra-personalized skincare solutions, improving both consumer satisfaction and treatment outcomes. The ability to link smartphone apps with home printers and kiosks ensures accessibility across segments, positioning AI diagnostics as a transformative driver of adoption in the personalized mask space.

Biocompatible Materials and Bio-Inks

Innovations in bio-inks and skin-safe polymers are accelerating demand for 3D-printed masks, as these materials allow controlled release of actives and superior adherence to facial contours. Biocompatibility not only ensures safety but also enables enhanced ingredient delivery, reducing wastage and maximizing efficiency.

This breakthrough addresses consumer concerns around sensitivity and irritation, while opening opportunities for premium and functional skincare. The ability to combine advanced ingredients with adaptive material properties is a key factor pushing adoption across both at-home and clinical environments.

High Initial Cost of Devices and Customization

A major barrier to widespread adoption remains the high upfront cost of 3D printers and associated mask customization devices. While cosmetic brands are experimenting with kiosks and clinics, consumer penetration is still limited by price sensitivity in many regions. The investment in hardware, coupled with recurring costs for consumables and cartridges, restricts adoption to premium consumers and urban markets. Unless brands develop affordable models or subscription-based solutions, cost will continue to be a restraint on market expansion.

Dermatology-Clinic Integration with Personalized Treatments

A key trend shaping the market is the growing role of dermatology clinics integrating 3D-printed masks into advanced treatment plans. Clinics are using bioprinting technologies to create post-procedure recovery masks and active ingredient-loaded gels tailored to patient needs.

This enhances the professional skincare experience and positions 3D-printed masks as both therapeutic and cosmetic tools. As partnerships between cosmetic brands and dermatologists expand, the clinic segment is expected to become a critical growth driver, setting the stage for mainstream adoption of 3D personalization.
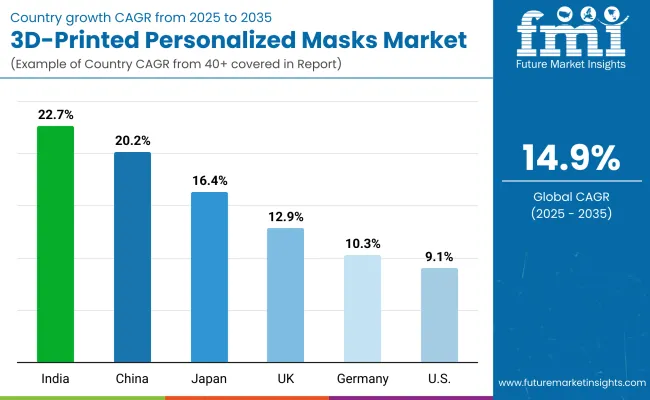
Analysis of 3D-Printed Personalized Masks Market By Key Countries

3d Printed Personalized Masks Market Country Wise Analysis

Country Estimated CAGR (2025 to 2035)
China 20.2%
USA 9.1%
India 22.7%
UK 12.9%
Germany 10.3%
Japan 16.4%

The global 3D-Printed Personalized Masks Market shows clear regional differences in adoption, shaped by consumer digital readiness, innovation ecosystems, and beauty-tech investments. Asia-Pacific emerges as the fastest-growing region, anchored by India at 22.7% CAGR and China at 20.2% CAGR. India’s rise is driven by rapid adoption of personalized skincare solutions among urban millennials and expanding availability of low-cost 3D-printed mask kits.

China leads with strong government support for biotech-enabled consumer goods, fueling investment in personalized beauty platforms. Japan (16.4% CAGR) also accelerates, with major cosmetic brands integrating 3D-printed masks into holistic wellness offerings. Europe maintains a steady growth profile, led by the UK (12.9%) and Germany (10.3%), where high consumer acceptance of premium skincare and innovation-driven beauty markets sustains demand.

North America shows more measured expansion, with the USA at 9.1% CAGR, reflecting a mature consumer base that emphasizes clinical-grade personalization and subscription models rather than purely hardware-based solutions.
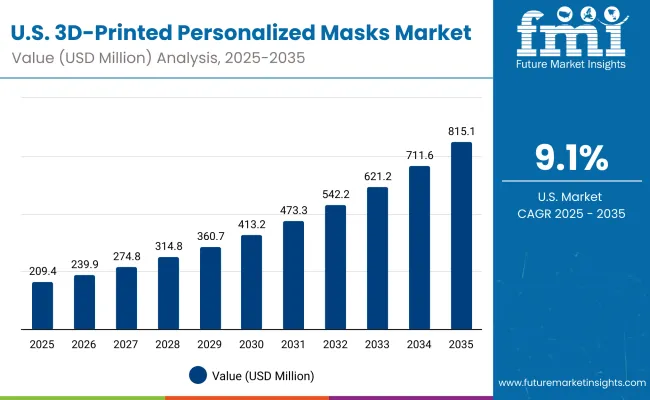
Sales Outlook for 3D-Printed Personalized Masks in the United States

Usa 3d Printed Personalized Masks Market

Year USA 3D-Printed Personalized Masks Market (USD Million)
2025 209.47
2026 239.96
2027 274.88
2028 314.89
2029 360.72
2030 413.23
2031 473.37
2032 542.27
2033 621.20
2034 711.61
2035 815.19

The 3D-Printed Personalized Masks Market in the United States is projected to grow from USD 209.47 million in 2025 to USD 815.19 million by 2035, adding over USD 605 million in value during the decade. This expansion reflects a steady year-on-year rise, with the market surpassing USD 360 million by 2029 and crossing the USD 700 million mark by 2034.

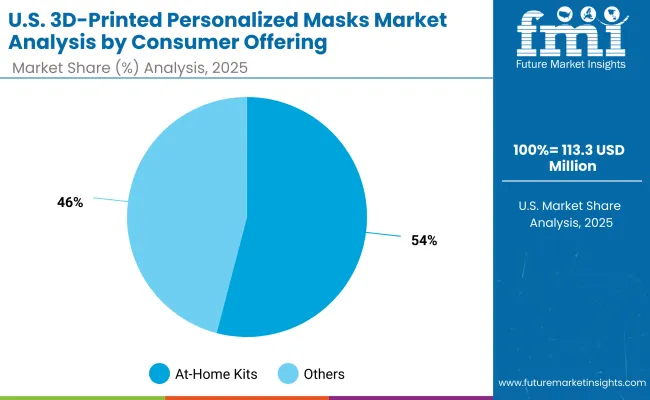
Growth is led by the widespread adoption of at-home kits, which accounted for 54.1% of the USA market in 2025 (USD 113.3 million), demonstrating strong consumer demand for convenience and digital personalization. The “others” category, which includes dermatology clinics and in-store kiosks, contributed USD 96.1 million in the same year, highlighting the role of professional channels in supporting credibility and higher-margin services.

  • Reverse engineering in aerospace is paralleled in the beauty-tech context by high customization for consumer safety masks and protective skincare.
  • Dental and dermatology clinics are integrating 3D-printed mask workflows for rapid, patient-specific applications.
  • Industrial and consumer design teams increasingly favor bundled hardware-software solutions, ensuring seamless 3D modeling and personalized skincare delivery.

Growth and Expansion Outlook for 3D-Printed Personalized Masks Market in the United Kingdom

The 3D-Printed Personalized Masks Market in the United Kingdom is projected to expand at a steady pace, with an estimated CAGR of 12.9% between 2025 and 2035. Growth is supported by rising consumer awareness of personalized beauty, coupled with the country’s early adoption of premium skincare technologies. At-home kits are expected to dominate, reflecting the preference for AI-driven diagnostics and app-integrated mask printers among digitally savvy consumers.

Retailers in London, Manchester, and Birmingham are piloting in-store kiosks, while dermatology clinics are incorporating personalized hydration and anti-aging treatments into premium service lines. A strong collaboration ecosystem involving cosmetic giants, biotech startups, and academic labs is accelerating material innovation, particularly in bio-inks and sustainable substrates, aligning with the UK’s broader sustainability agenda. This blend of consumer pull, retail innovation, and institutional R&D is positioning the UK as a leader in Europe’s personalized skincare transformation.

  • Urban retailers are piloting kiosks for instant mask printing in-store.
  • Clinics are using personalized hydration and anti-aging masks in skin therapy.
  • Startups and universities are collaborating on bio-ink innovation and sustainable materials.

Growth and Expansion Outlook for 3D-Printed Personalized Masks Market in India

India is set to witness one of the fastest expansions in the 3D-Printed Personalized Masks Market, with a projected CAGR of 22.7% between 2025 and 2035. Growth is being driven by a young consumer base, particularly urban millennials and Gen Z, who are highly receptive to affordable personalization in skincare. Falling costs of desktop 3D printers and the rise of localized cartridge production have enabled adoption to spread beyond metros into tier-2 and tier-3 cities.

Domestic cosmetic brands are actively introducing subscription-based models for hydration and brightening masks, ensuring recurring consumer engagement. In parallel, dermatology clinics in major urban hubs are testing 3D-printed post-treatment recovery masks, enhancing the appeal of precision-driven skincare. Additionally, the education sector is creating long-term momentum, with beauty and cosmetology institutes integrating training on mask-printing systems into curricula, preparing professionals for the country’s personalization wave.

  • Tier-2 city adoption is rising due to affordable home-use kits and localized consumables.
  • Domestic brands are offering subscriptions for hydration and brightening masks.
  • Dermatology clinics are testing 3D-printed recovery masks in advanced treatment regimens.

Sales Outlook for 3D-Printed Personalized Masks in China

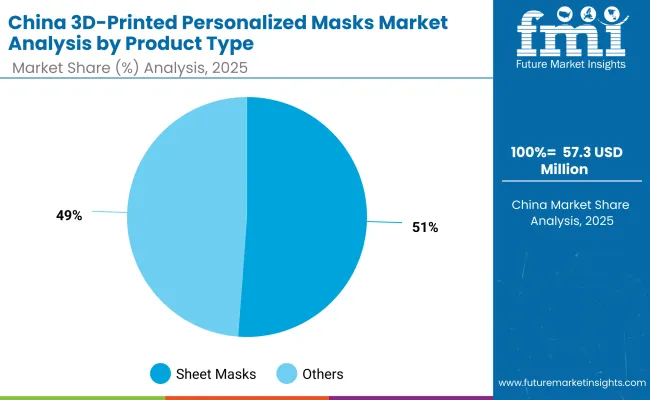
The 3D-Printed Personalized Masks Market in China is forecast to expand at the fastest pace among major economies, with an estimated CAGR of 20.2% from 2025 to 2035. Growth is being fueled by the country’s strong domestic beauty-tech ecosystem and consumer receptiveness to digital-first skincare. Local brands are rolling out affordable 3D-printed sheet mask devices, positioning personalized solutions within reach of middle-income households in cities like Shanghai, Beijing, and Guangzhou. In 2025, sheet masks accounted for 51.2% of China’s market (USD 57.3 million), reflecting their dominance as the preferred entry point for personalization.

Municipal health initiatives and large retail beauty chains are partnering on AI-driven skin diagnostics linked to mask printing, expanding adoption across both clinical and consumer channels. At the same time, e-commerce giants are embedding personalized mask subscriptions and social-commerce campaigns into their platforms, driving repeat purchases. Supported by government emphasis on biotech-enabled consumer goods and competitive pricing strategies by local firms, China is positioned as a global leader in the personalized skincare revolution.
  • Affordable localized devices are driving middle-class consumer penetration.
  • AI diagnostics + mask printers are expanding through retail and municipal programs.
  • E-commerce integration and subscription sales are accelerating recurring demand.

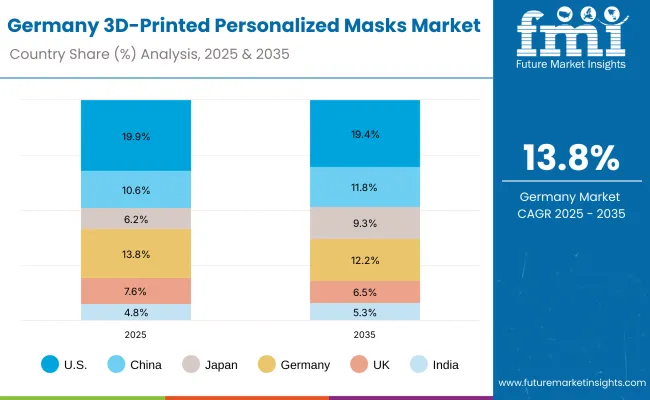
In-depth Analysis of 3D-Printed Personalized Masks in Germany

Germany 3d Printed Personalized Masks Market

Country 2025 Share (%)
USA 19.9%
China 10.6%
Japan 6.2%
Germany 13.8%
UK 7.6%
India 4.8%
Country 2035 Share (%)
USA 19.4%
China 11.8%
Japan 9.3%
Germany 12.2%
UK 6.5%
India 5.3%

The 3D-Printed Personalized Masks Market in Germany is projected to grow steadily, with its global share shifting from 13.8% in 2025 to 12.2% in 2035 as faster-growing Asian markets capture more weight. Growth in Germany remains anchored by the country’s premium skincare culture and strong emphasis on clinical-grade innovation. German consumers are early adopters of personalized sheet masks and custom-fit gels, especially in dermatology clinics where outcomes are linked to high scientific standards.

Cosmetic companies are partnering with pharmaceutical and biotech firms to launch bio-ink-based hydrating and anti-aging masks that comply with stringent EU cosmetic safety regulations. Retail pharmacies and beauty chains are piloting on-demand kiosks that combine digital skin diagnostics with instant mask creation, catering to consumers seeking convenience with accuracy. Sustainability plays a central role in the German market, with manufacturers investing in biodegradable substrates and recyclable mask capsules to align with eco-conscious consumer values.
  • Clinics and labs are leading adoption of personalized hydrating and recovery masks.
  • Retail pharmacies and beauty chains are piloting kiosks for on-demand mask creation.
  • Biotech partnerships are enabling compliant, sustainable, and advanced mask formulations.

Growth Outlook for 3D-Printed Personalized Masks Market in USA

Usa 3d Printed Personalized Masks Market By Consumer Offering

USA by Consumer Offering Value Share % 2025
At-home kits 54.1%
Others 45.9%

The 3D-Printed Personalized Masks Market in the United States is projected to sustain steady growth through 2035, driven by strong consumer adoption of at-home kits, which account for 54.1% of the market in 2025. This dominance underscores the USA preference for convenience-led, subscription-driven skincare solutions, where app-integrated printers allow customized mask creation at home. Clinical channels are also expanding, with dermatology practices integrating custom-fit hydration and recovery masks into advanced skin treatments, strengthening trust in medical-grade personalization.

Retail innovation is on the rise, as beauty chains in cities like New York and Los Angeles pilot smart kiosks and AR-linked mask printers, bridging digital convenience with in-store experiences. Together, the blend of consumer subscription models, clinical-grade offerings, and retail digitization positions the USA as one of the most balanced and innovation-ready markets globally.
  • At-home kits dominate as the preferred channel for convenience and personalization.
  • Dermatology practices are integrating custom-fit masks into advanced skin treatments.
  • Retailers are piloting kiosks and AR tools to bridge digital and in-store personalization.

Opportunity Analysis of China 3D-Printed Personalized Masks Market

China 3d Printed Personalized Masks Market By Product Type

China by Product Type Value Share % 2025
Sheet masks 51.2%
Others 48.8%

The 3D-Printed Personalized Masks Market in China is projected to deliver significant growth opportunities, with sheet masks leading at 51.2% of the market in 2025. Their dominance reflects consumer comfort with familiar skincare formats that are now enhanced by personalization. Affordable localized devices are enabling mass-market adoption, while e-commerce platforms integrate subscription models for recurring sheet mask sales.

Beyond consumer applications, China’s biotech startups and cosmetic giants are advancing bio-ink formulations and sustainable substrates, opening opportunities for premium segments. Clinical channels are also expanding, where personalized sheet masks are being trialed in dermatology and recovery care. The convergence of affordability, government support for biotech-enabled consumer products, and the strength of China’s digital retail ecosystem positions sheet masks as the most lucrative opportunity segment in the country.
  • Sheet masks lead adoption, supported by consumer familiarity and personalization.
  • E-commerce platforms drive recurring sales through subscription services.
  • Biotech innovation and sustainable materials open higher-value opportunities.

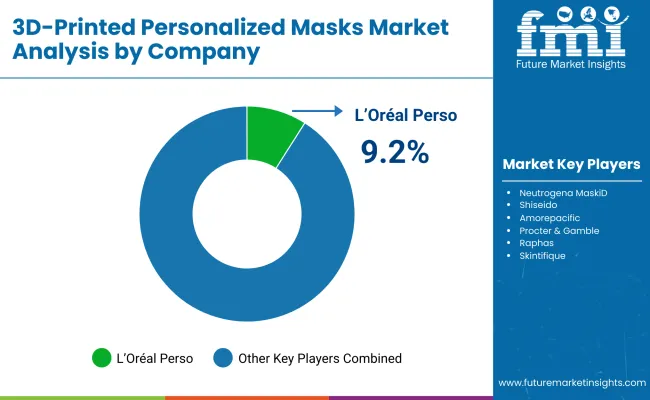
Competitive Landscape of 3D-Printed Personalized Masks Market

3d Printed Personalized Masks Market By Company

Company Global Value Share 2025
L’Oréal Perso 9.2%
Others 90.8%

The 3D-Printed Personalized Masks Market is moderately fragmented, with global beauty-tech leaders, regional cosmetic giants, and biotech-driven specialists competing across consumer and clinical applications. L’Oréal Perso leads the market with 9.2% share in 2025, driven by its AI-powered skin diagnostics and app-linked personalization platforms. Competitors such as Neutrogena MaskiD, Shiseido, Amorepacific, and Procter & Gamble are expanding their presence through subscription-driven at-home kits and partnerships with dermatology clinics.

Regional innovators, including Raphas, CELLINK, and BASF Care Creations, focus on bioprinting, bio-inks, and advanced material formulations to strengthen functionality and safety. These companies are aligning with sustainability goals by introducing biodegradable mask substrates and recyclable capsules. Niche-focused players such as Skintifique target clinical-grade and sensitive-skin solutions, emphasizing compliance with medical and regulatory standards.

Competitive differentiation is shifting from hardware capabilities to ecosystem-based offerings that integrate AI-driven personalization, AR/VR-enabled skin visualization, e-commerce subscriptions, and hybrid clinic-consumer solutions. This transition is fostering new alliances between cosmetic brands, biotech startups, and retail channels, where consumer engagement, recurring revenue, and ecosystem scalability are becoming the primary success factors.

Key Developments in 3D-Printed Personalized Masks Market

  • On March 11, 2025, L’Oréal Perso partnered with CELLINK to launch a bio-ink-enabled 3D mask printing platform designed for hydration and anti-aging applications. The collaboration combines L’Oréal’s personalization ecosystem with CELLINK’s bioprinting expertise to advance safe, skin-compatible materials for consumer and clinical use.
  • On July 23, 2025, Amorepacific introduced smart kiosks in Seoul and Tokyo that integrate AI-powered skin diagnostics with instant 3D-printed sheet mask creation. The pilot rollout in premium retail locations demonstrated strong consumer demand for on-demand personalization and is expected to expand to Europe and North America by 2026.

Scope of the Report

Item Value
Quantitative Units USD 1,050.3 Million
Print Technology Inkjet bioprinting , Extrusion-based, Laser-assisted
Function Hydration, Anti-aging, Brightening, Spot treatment
Product Type Sheet masks, Patches, Custom-fit gels, Capsules
Consumer Offering At-home kits, In-store kiosks, Dermatology clinics
Regions Covered North America, Europe, Asia-Pacific, Latin America, Middle East & Africa
Country Covered United States, Canada, Germany, France, United Kingdom, China, Japan, India, Brazil, South Africa
Key Companies Profiled L’Oréal Perso , Neutrogena MaskiD , Shiseido, Amorepacific , Procter & Gamble, Raphas , CELLINK, Stratasys , BASF Care Creations, Skintifique
Additional Attributes Dollar sales by product type and consumer offering, adoption trends in personalized skincare routines and clinical recovery treatments, rising demand for at-home kits and AI-integrated mask printers, segment-specific growth in hydration, anti-aging, and brightening functions, material and bio-ink innovation for sheet masks, patches, and custom-fit gels, subscription-based sales models in e-commerce and retail channels, regional growth driven by beauty-tech ecosystems and sustainability initiatives, and advancements in inkjet bioprinting , extrusion-based, and laser-assisted printing technologies.

Key Segments

By Print Technology:

  • Inkjet bioprinting
  • Extrusion-based
  • Laser-assisted

By Function:

  • Hydration
  • Anti-aging
  • Brightening
  • Spot treatment

By Product Type:

  • Sheet masks
  • Patches
  • Custom-fit gels
  • Capsules

By Consumer Offering:

  • At-home kits
  • In-store kiosks
  • Dermatology clinics

By Region:

  • North America
  • Latin America
  • Europe
  • East Asia
  • South Asia & Pacific
  • Middle East and Africa

Table of Content

  1. Executive Summary
    • Global Market Outlook
    • Demand-side Trends
    • Supply-side Trends
    • Technology Roadmap Analysis
    • Analysis and Recommendations
  2. Market Overview
    • Market Coverage / Taxonomy
    • Market Definition / Scope / Limitations
  3. Market Background
    • Market Dynamics
      • Drivers
      • Restraints
      • Opportunity
      • Trends
    • Scenario Forecast
      • Demand in Optimistic Scenario
      • Demand in Likely Scenario
      • Demand in Conservative Scenario
    • Opportunity Map Analysis
    • Product Life Cycle Analysis
    • Supply Chain Analysis
      • Supply Side Participants and their Roles
        • Producers
        • Mid-Level Participants (Traders/ Agents/ Brokers)
        • Wholesalers and Distributors
      • Value Added and Value Created at Node in the Supply Chain
      • List of Raw Material Suppliers
      • List of Existing and Potential Buyer’s
    • Investment Feasibility Matrix
    • Value Chain Analysis
      • Profit Margin Analysis
      • Wholesalers and Distributors
      • Retailers
    • PESTLE and Porter’s Analysis
    • Regulatory Landscape
      • By Key Regions
      • By Key Countries
    • Regional Parent Market Outlook
    • Production and Consumption Statistics
    • Import and Export Statistics
  4. Global Market Analysis 2020 to 2024 and Forecast, 2025 to 2035
    • Historical Market Size Value (USD Million) & Volume (Units) Analysis, 2020 to 2024
    • Current and Future Market Size Value (USD Million) & Volume (Units) Projections, 2025 to 2035
      • Y-o-Y Growth Trend Analysis
      • Absolute $ Opportunity Analysis
  5. Global Market Analysis 2020 to 2024 and Forecast 2025 to 2035, By Print Technology
    • Introduction / Key Findings
    • Historical Market Size Value (USD Million) & Volume (Units) Analysis By Print Technology, 2020 to 2024
    • Current and Future Market Size Value (USD Million) & Volume (Units) Analysis and Forecast By Print Technology, 2025 to 2035
      • Inkjet bioprinting
      • Extrusion-based
      • Laser-assisted
    • Y-o-Y Growth Trend Analysis By Print Technology, 2020 to 2024
    • Absolute $ Opportunity Analysis By Print Technology, 2025 to 2035
  6. Global Market Analysis 2020 to 2024 and Forecast 2025 to 2035, By Function
    • Introduction / Key Findings
    • Historical Market Size Value (USD Million) & Volume (Units) Analysis By Function, 2020 to 2024
    • Current and Future Market Size Value (USD Million) & Volume (Units) Analysis and Forecast By Function, 2025 to 2035
      • Hydration
      • Anti-aging
      • Brightening
      • Spot treatment
    • Y-o-Y Growth Trend Analysis By Function, 2020 to 2024
    • Absolute $ Opportunity Analysis By Function, 2025 to 2035
  7. Global Market Analysis 2020 to 2024 and Forecast 2025 to 2035, By Product Type
    • Introduction / Key Findings
    • Historical Market Size Value (USD Million) & Volume (Units) Analysis By Product Type, 2020 to 2024
    • Current and Future Market Size Value (USD Million) & Volume (Units) Analysis and Forecast By Product Type, 2025 to 2035
      • Sheet masks
      • Patches
      • Custom-fit gels
      • Capsules
    • Y-o-Y Growth Trend Analysis By Product Type, 2020 to 2024
    • Absolute $ Opportunity Analysis By Product Type, 2025 to 2035
  8. Global Market Analysis 2020 to 2024 and Forecast 2025 to 2035, By Consumer Offering
    • Introduction / Key Findings
    • Historical Market Size Value (USD Million) & Volume (Units) Analysis By Consumer Offering, 2020 to 2024
    • Current and Future Market Size Value (USD Million) & Volume (Units) Analysis and Forecast By Consumer Offering, 2025 to 2035
      • At-home kits
      • In-store kiosks
      • Dermatology clinics
    • Y-o-Y Growth Trend Analysis By Consumer Offering, 2020 to 2024
    • Absolute $ Opportunity Analysis By Consumer Offering, 2025 to 2035
  9. Global Market Analysis 2020 to 2024 and Forecast 2025 to 2035, By Region
    • Introduction
    • Historical Market Size Value (USD Million) & Volume (Units) Analysis By Region, 2020 to 2024
    • Current Market Size Value (USD Million) & Volume (Units) Analysis and Forecast By Region, 2025 to 2035
      • North America
      • Latin America
      • Europe
      • East Asia
      • South Asia & Pacific
      • Middle East and Africa
    • Market Attractiveness Analysis By Region
  10. North America Market Analysis 2020 to 2024 and Forecast 2025 to 2035, By Country
    • Historical Market Size Value (USD Million) & Volume (Units) Trend Analysis By Market Taxonomy, 2020 to 2024
    • Market Size Value (USD Million) & Volume (Units) Forecast By Market Taxonomy, 2025 to 2035
      • By Country
        • USA
        • Canada
      • By Print Technology
      • By Function
      • By Product Type
      • By Consumer Offering
    • Market Attractiveness Analysis
      • By Country
      • By Print Technology
      • By Function
      • By Product Type
      • By Consumer Offering
    • Key Takeaways
  11. Latin America Market Analysis 2020 to 2024 and Forecast 2025 to 2035, By Country
    • Historical Market Size Value (USD Million) & Volume (Units) Trend Analysis By Market Taxonomy, 2020 to 2024
    • Market Size Value (USD Million) & Volume (Units) Forecast By Market Taxonomy, 2025 to 2035
      • By Country
        • Brazil
        • Mexico
        • Colombia
        • Rest of Latin America
      • By Print Technology
      • By Function
      • By Product Type
      • By Consumer Offering
    • Market Attractiveness Analysis
      • By Country
      • By Print Technology
      • By Function
      • By Product Type
      • By Consumer Offering
    • Key Takeaways
  12. Europe Market Analysis 2020 to 2024 and Forecast 2025 to 2035, By Country
    • Historical Market Size Value (USD Million) & Volume (Units) Trend Analysis By Market Taxonomy, 2020 to 2024
    • Market Size Value (USD Million) & Volume (Units) Forecast By Market Taxonomy, 2025 to 2035
      • By Country
        • Germany
        • UK
        • France
        • Italy
        • Spain
        • Belgium
        • Netherlands
        • Nordic
        • Switzerland
        • Russia
        • Poland
        • Rest of Europe
      • By Print Technology
      • By Function
      • By Product Type
      • By Consumer Offering
    • Market Attractiveness Analysis
      • By Country
      • By Print Technology
      • By Function
      • By Product Type
      • By Consumer Offering
    • Key Takeaways
  13. East Asia Market Analysis 2020 to 2024 and Forecast 2025 to 2035, By Country
    • Historical Market Size Value (USD Million) & Volume (Units) Trend Analysis By Market Taxonomy, 2020 to 2024
    • Market Size Value (USD Million) & Volume (Units) Forecast By Market Taxonomy, 2025 to 2035
      • By Country
        • China
        • Japan
        • South Korea
      • By Print Technology
      • By Function
      • By Product Type
      • By Consumer Offering
    • Market Attractiveness Analysis
      • By Country
      • By Print Technology
      • By Function
      • By Product Type
      • By Consumer Offering
    • Key Takeaways
  14. South Asia & Pacific Market Analysis 2020 to 2024 and Forecast 2025 to 2035, By Country
    • Historical Market Size Value (USD Million) & Volume (Units) Trend Analysis By Market Taxonomy, 2020 to 2024
    • Market Size Value (USD Million) & Volume (Units) Forecast By Market Taxonomy, 2025 to 2035
      • By Country
        • India
        • Thailand
        • Malaysia
        • Indonesia
        • Singapore
        • Vietnam
        • Australia
        • New Zealand
        • Rest of South Asia
      • By Print Technology
      • By Function
      • By Product Type
      • By Consumer Offering
    • Market Attractiveness Analysis
      • By Country
      • By Print Technology
      • By Function
      • By Product Type
      • By Consumer Offering
    • Key Takeaways
  15. Middle East and Africa Market Analysis 2020 to 2024 and Forecast 2025 to 2035, By Country
    • Historical Market Size Value (USD Million) & Volume (Units) Trend Analysis By Market Taxonomy, 2020 to 2024
    • Market Size Value (USD Million) & Volume (Units) Forecast By Market Taxonomy, 2025 to 2035
      • By Country
        • Turkey
        • UAE
        • Saudi Arabia
        • Israel
        • Other GCC Countries
        • North Africa
        • South Africa
      • By Print Technology
      • By Function
      • By Product Type
      • By Consumer Offering
    • Market Attractiveness Analysis
      • By Country
      • By Print Technology
      • By Function
      • By Product Type
      • By Consumer Offering
    • Key Takeaways
  16. Key Countries Market Analysis
    • USA
      • Pricing Analysis
      • Market Share Analysis, 2024
        • By Print Technology
        • By Function
        • By Product Type
        • By Consumer Offering
    • Canada
      • Pricing Analysis
      • Market Share Analysis, 2024
        • By Print Technology
        • By Function
        • By Product Type
        • By Consumer Offering
    • Brazil
      • Pricing Analysis
      • Market Share Analysis, 2024
        • By Print Technology
        • By Function
        • By Product Type
        • By Consumer Offering
    • Mexico
      • Pricing Analysis
      • Market Share Analysis, 2024
        • By Print Technology
        • By Function
        • By Product Type
        • By Consumer Offering
    • Colombia
      • Pricing Analysis
      • Market Share Analysis, 2024
        • By Print Technology
        • By Function
        • By Product Type
        • By Consumer Offering
    • Germany
      • Pricing Analysis
      • Market Share Analysis, 2024
        • By Print Technology
        • By Function
        • By Product Type
        • By Consumer Offering
    • UK
      • Pricing Analysis
      • Market Share Analysis, 2024
        • By Print Technology
        • By Function
        • By Product Type
        • By Consumer Offering
    • France
      • Pricing Analysis
      • Market Share Analysis, 2024
        • By Print Technology
        • By Function
        • By Product Type
        • By Consumer Offering
    • Italy
      • Pricing Analysis
      • Market Share Analysis, 2024
        • By Print Technology
        • By Function
        • By Product Type
        • By Consumer Offering
    • Spain
      • Pricing Analysis
      • Market Share Analysis, 2024
        • By Print Technology
        • By Function
        • By Product Type
        • By Consumer Offering
    • Belgium
      • Pricing Analysis
      • Market Share Analysis, 2024
        • By Print Technology
        • By Function
        • By Product Type
        • By Consumer Offering
    • Netherlands
      • Pricing Analysis
      • Market Share Analysis, 2024
        • By Print Technology
        • By Function
        • By Product Type
        • By Consumer Offering
    • Nordic
      • Pricing Analysis
      • Market Share Analysis, 2024
        • By Print Technology
        • By Function
        • By Product Type
        • By Consumer Offering
    • Switzerland
      • Pricing Analysis
      • Market Share Analysis, 2024
        • By Print Technology
        • By Function
        • By Product Type
        • By Consumer Offering
    • Russia
      • Pricing Analysis
      • Market Share Analysis, 2024
        • By Print Technology
        • By Function
        • By Product Type
        • By Consumer Offering
    • Poland
      • Pricing Analysis
      • Market Share Analysis, 2024
        • By Print Technology
        • By Function
        • By Product Type
        • By Consumer Offering
    • China
      • Pricing Analysis
      • Market Share Analysis, 2024
        • By Print Technology
        • By Function
        • By Product Type
        • By Consumer Offering
    • Japan
      • Pricing Analysis
      • Market Share Analysis, 2024
        • By Print Technology
        • By Function
        • By Product Type
        • By Consumer Offering
    • South Korea
      • Pricing Analysis
      • Market Share Analysis, 2024
        • By Print Technology
        • By Function
        • By Product Type
        • By Consumer Offering
    • India
      • Pricing Analysis
      • Market Share Analysis, 2024
        • By Print Technology
        • By Function
        • By Product Type
        • By Consumer Offering
    • Thailand
      • Pricing Analysis
      • Market Share Analysis, 2024
        • By Print Technology
        • By Function
        • By Product Type
        • By Consumer Offering
    • Indonesia
      • Pricing Analysis
      • Market Share Analysis, 2024
        • By Print Technology
        • By Function
        • By Product Type
        • By Consumer Offering
    • Australia
      • Pricing Analysis
      • Market Share Analysis, 2024
        • By Print Technology
        • By Function
        • By Product Type
        • By Consumer Offering
    • New Zealand
      • Pricing Analysis
      • Market Share Analysis, 2024
        • By Print Technology
        • By Function
        • By Product Type
        • By Consumer Offering
    • Turkey
      • Pricing Analysis
      • Market Share Analysis, 2024
        • By Print Technology
        • By Function
        • By Product Type
        • By Consumer Offering
    • UAE
      • Pricing Analysis
      • Market Share Analysis, 2024
        • By Print Technology
        • By Function
        • By Product Type
        • By Consumer Offering
    • Saudi Arabia
      • Pricing Analysis
      • Market Share Analysis, 2024
        • By Print Technology
        • By Function
        • By Product Type
        • By Consumer Offering
    • Israel
      • Pricing Analysis
      • Market Share Analysis, 2024
        • By Print Technology
        • By Function
        • By Product Type
        • By Consumer Offering
    • North Africa
      • Pricing Analysis
      • Market Share Analysis, 2024
        • By Print Technology
        • By Function
        • By Product Type
        • By Consumer Offering
    • South Africa
      • Pricing Analysis
      • Market Share Analysis, 2024
        • By Print Technology
        • By Function
        • By Product Type
        • By Consumer Offering
  17. Market Structure Analysis
    • Competition Dashboard
    • Competition Benchmarking
    • Market Share Analysis of Top Players
      • By Regional
      • By Print Technology
      • By Function
      • By Product Type
      • By Consumer Offering
  18. Competition Analysis
    • Competition Deep Dive
      • L’Oréal Perso
        • Overview
        • Product Portfolio
        • Profitability by Market Segments (Product/Age /Sales Channel/Region)
        • Sales Footprint
        • Strategy Overview
          • Marketing Strategy
          • Product Strategy
          • Channel Strategy
      • Neutrogena MaskiD
        • Overview
        • Product Portfolio
        • Profitability by Market Segments (Product/Age /Sales Channel/Region)
        • Sales Footprint
        • Strategy Overview
          • Marketing Strategy
          • Product Strategy
          • Channel Strategy
      • Shiseido
        • Overview
        • Product Portfolio
        • Profitability by Market Segments (Product/Age /Sales Channel/Region)
        • Sales Footprint
        • Strategy Overview
          • Marketing Strategy
          • Product Strategy
          • Channel Strategy
      • Amorepacific
        • Overview
        • Product Portfolio
        • Profitability by Market Segments (Product/Age /Sales Channel/Region)
        • Sales Footprint
        • Strategy Overview
          • Marketing Strategy
          • Product Strategy
          • Channel Strategy
      • Procter & Gamble
        • Overview
        • Product Portfolio
        • Profitability by Market Segments (Product/Age /Sales Channel/Region)
        • Sales Footprint
        • Strategy Overview
          • Marketing Strategy
          • Product Strategy
          • Channel Strategy
      • Raphas
        • Overview
        • Product Portfolio
        • Profitability by Market Segments (Product/Age /Sales Channel/Region)
        • Sales Footprint
        • Strategy Overview
          • Marketing Strategy
          • Product Strategy
          • Channel Strategy
      • CELLINK
        • Overview
        • Product Portfolio
        • Profitability by Market Segments (Product/Age /Sales Channel/Region)
        • Sales Footprint
        • Strategy Overview
          • Marketing Strategy
          • Product Strategy
          • Channel Strategy
      • Stratasys
        • Overview
        • Product Portfolio
        • Profitability by Market Segments (Product/Age /Sales Channel/Region)
        • Sales Footprint
        • Strategy Overview
          • Marketing Strategy
          • Product Strategy
          • Channel Strategy
      • BASF Care Creations
        • Overview
        • Product Portfolio
        • Profitability by Market Segments (Product/Age /Sales Channel/Region)
        • Sales Footprint
        • Strategy Overview
          • Marketing Strategy
          • Product Strategy
          • Channel Strategy
      • Skintifique
        • Overview
        • Product Portfolio
        • Profitability by Market Segments (Product/Age /Sales Channel/Region)
        • Sales Footprint
        • Strategy Overview
          • Marketing Strategy
          • Product Strategy
          • Channel Strategy
      • Others
        • Overview
        • Product Portfolio
        • Profitability by Market Segments (Product/Age /Sales Channel/Region)
        • Sales Footprint
        • Strategy Overview
          • Marketing Strategy
          • Product Strategy
          • Channel Strategy
  19. Assumptions & Acronyms Used
  20. Research Methodology

List of Tables

  • Table 1: Global Market Value (USD Million) Forecast by Region, 2020-2035
  • Table 2: Global Market Volume (Units) Forecast by Region, 2020-2035
  • Table 3: Global Market Value (USD Million) Forecast by Print Technology, 2020-2035
  • Table 4: Global Market Volume (Units) Forecast by Print Technology, 2020-2035
  • Table 5: Global Market Value (USD Million) Forecast by Function, 2020-2035
  • Table 6: Global Market Volume (Units) Forecast by Function, 2020-2035
  • Table 7: Global Market Value (USD Million) Forecast by Product Type, 2020-2035
  • Table 8: Global Market Volume (Units) Forecast by Product Type, 2020-2035
  • Table 9: Global Market Value (USD Million) Forecast by Consumer Offering, 2020-2035
  • Table 10: Global Market Volume (Units) Forecast by Consumer Offering, 2020-2035
  • Table 11: North America Market Value (USD Million) Forecast by Country, 2020-2035
  • Table 12: North America Market Volume (Units) Forecast by Country, 2020-2035
  • Table 13: North America Market Value (USD Million) Forecast by Print Technology, 2020-2035
  • Table 14: North America Market Volume (Units) Forecast by Print Technology, 2020-2035
  • Table 15: North America Market Value (USD Million) Forecast by Function, 2020-2035
  • Table 16: North America Market Volume (Units) Forecast by Function, 2020-2035
  • Table 17: North America Market Value (USD Million) Forecast by Product Type, 2020-2035
  • Table 18: North America Market Volume (Units) Forecast by Product Type, 2020-2035
  • Table 19: North America Market Value (USD Million) Forecast by Consumer Offering, 2020-2035
  • Table 20: North America Market Volume (Units) Forecast by Consumer Offering, 2020-2035
  • Table 21: Latin America Market Value (USD Million) Forecast by Country, 2020-2035
  • Table 22: Latin America Market Volume (Units) Forecast by Country, 2020-2035
  • Table 23: Latin America Market Value (USD Million) Forecast by Print Technology, 2020-2035
  • Table 24: Latin America Market Volume (Units) Forecast by Print Technology, 2020-2035
  • Table 25: Latin America Market Value (USD Million) Forecast by Function, 2020-2035
  • Table 26: Latin America Market Volume (Units) Forecast by Function, 2020-2035
  • Table 27: Latin America Market Value (USD Million) Forecast by Product Type, 2020-2035
  • Table 28: Latin America Market Volume (Units) Forecast by Product Type, 2020-2035
  • Table 29: Latin America Market Value (USD Million) Forecast by Consumer Offering, 2020-2035
  • Table 30: Latin America Market Volume (Units) Forecast by Consumer Offering, 2020-2035
  • Table 31: Europe Market Value (USD Million) Forecast by Country, 2020-2035
  • Table 32: Europe Market Volume (Units) Forecast by Country, 2020-2035
  • Table 33: Europe Market Value (USD Million) Forecast by Print Technology, 2020-2035
  • Table 34: Europe Market Volume (Units) Forecast by Print Technology, 2020-2035
  • Table 35: Europe Market Value (USD Million) Forecast by Function, 2020-2035
  • Table 36: Europe Market Volume (Units) Forecast by Function, 2020-2035
  • Table 37: Europe Market Value (USD Million) Forecast by Product Type, 2020-2035
  • Table 38: Europe Market Volume (Units) Forecast by Product Type, 2020-2035
  • Table 39: Europe Market Value (USD Million) Forecast by Consumer Offering, 2020-2035
  • Table 40: Europe Market Volume (Units) Forecast by Consumer Offering, 2020-2035
  • Table 41: East Asia Market Value (USD Million) Forecast by Country, 2020-2035
  • Table 42: East Asia Market Volume (Units) Forecast by Country, 2020-2035
  • Table 43: East Asia Market Value (USD Million) Forecast by Print Technology, 2020-2035
  • Table 44: East Asia Market Volume (Units) Forecast by Print Technology, 2020-2035
  • Table 45: East Asia Market Value (USD Million) Forecast by Function, 2020-2035
  • Table 46: East Asia Market Volume (Units) Forecast by Function, 2020-2035
  • Table 47: East Asia Market Value (USD Million) Forecast by Product Type, 2020-2035
  • Table 48: East Asia Market Volume (Units) Forecast by Product Type, 2020-2035
  • Table 49: East Asia Market Value (USD Million) Forecast by Consumer Offering, 2020-2035
  • Table 50: East Asia Market Volume (Units) Forecast by Consumer Offering, 2020-2035
  • Table 51: South Asia & Pacific Market Value (USD Million) Forecast by Country, 2020-2035
  • Table 52: South Asia & Pacific Market Volume (Units) Forecast by Country, 2020-2035
  • Table 53: South Asia & Pacific Market Value (USD Million) Forecast by Print Technology, 2020-2035
  • Table 54: South Asia & Pacific Market Volume (Units) Forecast by Print Technology, 2020-2035
  • Table 55: South Asia & Pacific Market Value (USD Million) Forecast by Function, 2020-2035
  • Table 56: South Asia & Pacific Market Volume (Units) Forecast by Function, 2020-2035
  • Table 57: South Asia & Pacific Market Value (USD Million) Forecast by Product Type, 2020-2035
  • Table 58: South Asia & Pacific Market Volume (Units) Forecast by Product Type, 2020-2035
  • Table 59: South Asia & Pacific Market Value (USD Million) Forecast by Consumer Offering, 2020-2035
  • Table 60: South Asia & Pacific Market Volume (Units) Forecast by Consumer Offering, 2020-2035
  • Table 61: Middle East and Africa Market Value (USD Million) Forecast by Country, 2020-2035
  • Table 62: Middle East and Africa Market Volume (Units) Forecast by Country, 2020-2035
  • Table 63: Middle East and Africa Market Value (USD Million) Forecast by Print Technology, 2020-2035
  • Table 64: Middle East and Africa Market Volume (Units) Forecast by Print Technology, 2020-2035
  • Table 65: Middle East and Africa Market Value (USD Million) Forecast by Function, 2020-2035
  • Table 66: Middle East and Africa Market Volume (Units) Forecast by Function, 2020-2035
  • Table 67: Middle East and Africa Market Value (USD Million) Forecast by Product Type, 2020-2035
  • Table 68: Middle East and Africa Market Volume (Units) Forecast by Product Type, 2020-2035
  • Table 69: Middle East and Africa Market Value (USD Million) Forecast by Consumer Offering, 2020-2035
  • Table 70: Middle East and Africa Market Volume (Units) Forecast by Consumer Offering, 2020-2035

List of Figures

  • Figure 1: Global Market Value (USD Million) by Print Technology, 2025-2035
  • Figure 2: Global Market Value (USD Million) by Function, 2025-2035
  • Figure 3: Global Market Value (USD Million) by Product Type, 2025-2035
  • Figure 4: Global Market Value (USD Million) by Consumer Offering, 2025-2035
  • Figure 5: Global Market Value (USD Million) by Region, 2025-2035
  • Figure 6: Global Market Value (USD Million) Analysis by Region, 2020-2035
  • Figure 7: Global Market Volume (Units) Analysis by Region, 2020-2035
  • Figure 8: Global Market Value Share (%) and BPS Analysis by Region, 2025-2035
  • Figure 9: Global Market Y-o-Y Growth (%) Projections by Region, 2025-2035
  • Figure 10: Global Market Value (USD Million) Analysis by Print Technology, 2020-2035
  • Figure 11: Global Market Volume (Units) Analysis by Print Technology, 2020-2035
  • Figure 12: Global Market Value Share (%) and BPS Analysis by Print Technology, 2025-2035
  • Figure 13: Global Market Y-o-Y Growth (%) Projections by Print Technology, 2025-2035
  • Figure 14: Global Market Value (USD Million) Analysis by Function, 2020-2035
  • Figure 15: Global Market Volume (Units) Analysis by Function, 2020-2035
  • Figure 16: Global Market Value Share (%) and BPS Analysis by Function, 2025-2035
  • Figure 17: Global Market Y-o-Y Growth (%) Projections by Function, 2025-2035
  • Figure 18: Global Market Value (USD Million) Analysis by Product Type, 2020-2035
  • Figure 19: Global Market Volume (Units) Analysis by Product Type, 2020-2035
  • Figure 20: Global Market Value Share (%) and BPS Analysis by Product Type, 2025-2035
  • Figure 21: Global Market Y-o-Y Growth (%) Projections by Product Type, 2025-2035
  • Figure 22: Global Market Value (USD Million) Analysis by Consumer Offering, 2020-2035
  • Figure 23: Global Market Volume (Units) Analysis by Consumer Offering, 2020-2035
  • Figure 24: Global Market Value Share (%) and BPS Analysis by Consumer Offering, 2025-2035
  • Figure 25: Global Market Y-o-Y Growth (%) Projections by Consumer Offering, 2025-2035
  • Figure 26: Global Market Attractiveness by Print Technology, 2025-2035
  • Figure 27: Global Market Attractiveness by Function, 2025-2035
  • Figure 28: Global Market Attractiveness by Product Type, 2025-2035
  • Figure 29: Global Market Attractiveness by Consumer Offering, 2025-2035
  • Figure 30: Global Market Attractiveness by Region, 2025-2035
  • Figure 31: North America Market Value (USD Million) by Print Technology, 2025-2035
  • Figure 32: North America Market Value (USD Million) by Function, 2025-2035
  • Figure 33: North America Market Value (USD Million) by Product Type, 2025-2035
  • Figure 34: North America Market Value (USD Million) by Consumer Offering, 2025-2035
  • Figure 35: North America Market Value (USD Million) by Country, 2025-2035
  • Figure 36: North America Market Value (USD Million) Analysis by Country, 2020-2035
  • Figure 37: North America Market Volume (Units) Analysis by Country, 2020-2035
  • Figure 38: North America Market Value Share (%) and BPS Analysis by Country, 2025-2035
  • Figure 39: North America Market Y-o-Y Growth (%) Projections by Country, 2025-2035
  • Figure 40: North America Market Value (USD Million) Analysis by Print Technology, 2020-2035
  • Figure 41: North America Market Volume (Units) Analysis by Print Technology, 2020-2035
  • Figure 42: North America Market Value Share (%) and BPS Analysis by Print Technology, 2025-2035
  • Figure 43: North America Market Y-o-Y Growth (%) Projections by Print Technology, 2025-2035
  • Figure 44: North America Market Value (USD Million) Analysis by Function, 2020-2035
  • Figure 45: North America Market Volume (Units) Analysis by Function, 2020-2035
  • Figure 46: North America Market Value Share (%) and BPS Analysis by Function, 2025-2035
  • Figure 47: North America Market Y-o-Y Growth (%) Projections by Function, 2025-2035
  • Figure 48: North America Market Value (USD Million) Analysis by Product Type, 2020-2035
  • Figure 49: North America Market Volume (Units) Analysis by Product Type, 2020-2035
  • Figure 50: North America Market Value Share (%) and BPS Analysis by Product Type, 2025-2035
  • Figure 51: North America Market Y-o-Y Growth (%) Projections by Product Type, 2025-2035
  • Figure 52: North America Market Value (USD Million) Analysis by Consumer Offering, 2020-2035
  • Figure 53: North America Market Volume (Units) Analysis by Consumer Offering, 2020-2035
  • Figure 54: North America Market Value Share (%) and BPS Analysis by Consumer Offering, 2025-2035
  • Figure 55: North America Market Y-o-Y Growth (%) Projections by Consumer Offering, 2025-2035
  • Figure 56: North America Market Attractiveness by Print Technology, 2025-2035
  • Figure 57: North America Market Attractiveness by Function, 2025-2035
  • Figure 58: North America Market Attractiveness by Product Type, 2025-2035
  • Figure 59: North America Market Attractiveness by Consumer Offering, 2025-2035
  • Figure 60: North America Market Attractiveness by Country, 2025-2035
  • Figure 61: Latin America Market Value (USD Million) by Print Technology, 2025-2035
  • Figure 62: Latin America Market Value (USD Million) by Function, 2025-2035
  • Figure 63: Latin America Market Value (USD Million) by Product Type, 2025-2035
  • Figure 64: Latin America Market Value (USD Million) by Consumer Offering, 2025-2035
  • Figure 65: Latin America Market Value (USD Million) by Country, 2025-2035
  • Figure 66: Latin America Market Value (USD Million) Analysis by Country, 2020-2035
  • Figure 67: Latin America Market Volume (Units) Analysis by Country, 2020-2035
  • Figure 68: Latin America Market Value Share (%) and BPS Analysis by Country, 2025-2035
  • Figure 69: Latin America Market Y-o-Y Growth (%) Projections by Country, 2025-2035
  • Figure 70: Latin America Market Value (USD Million) Analysis by Print Technology, 2020-2035
  • Figure 71: Latin America Market Volume (Units) Analysis by Print Technology, 2020-2035
  • Figure 72: Latin America Market Value Share (%) and BPS Analysis by Print Technology, 2025-2035
  • Figure 73: Latin America Market Y-o-Y Growth (%) Projections by Print Technology, 2025-2035
  • Figure 74: Latin America Market Value (USD Million) Analysis by Function, 2020-2035
  • Figure 75: Latin America Market Volume (Units) Analysis by Function, 2020-2035
  • Figure 76: Latin America Market Value Share (%) and BPS Analysis by Function, 2025-2035
  • Figure 77: Latin America Market Y-o-Y Growth (%) Projections by Function, 2025-2035
  • Figure 78: Latin America Market Value (USD Million) Analysis by Product Type, 2020-2035
  • Figure 79: Latin America Market Volume (Units) Analysis by Product Type, 2020-2035
  • Figure 80: Latin America Market Value Share (%) and BPS Analysis by Product Type, 2025-2035
  • Figure 81: Latin America Market Y-o-Y Growth (%) Projections by Product Type, 2025-2035
  • Figure 82: Latin America Market Value (USD Million) Analysis by Consumer Offering, 2020-2035
  • Figure 83: Latin America Market Volume (Units) Analysis by Consumer Offering, 2020-2035
  • Figure 84: Latin America Market Value Share (%) and BPS Analysis by Consumer Offering, 2025-2035
  • Figure 85: Latin America Market Y-o-Y Growth (%) Projections by Consumer Offering, 2025-2035
  • Figure 86: Latin America Market Attractiveness by Print Technology, 2025-2035
  • Figure 87: Latin America Market Attractiveness by Function, 2025-2035
  • Figure 88: Latin America Market Attractiveness by Product Type, 2025-2035
  • Figure 89: Latin America Market Attractiveness by Consumer Offering, 2025-2035
  • Figure 90: Latin America Market Attractiveness by Country, 2025-2035
  • Figure 91: Europe Market Value (USD Million) by Print Technology, 2025-2035
  • Figure 92: Europe Market Value (USD Million) by Function, 2025-2035
  • Figure 93: Europe Market Value (USD Million) by Product Type, 2025-2035
  • Figure 94: Europe Market Value (USD Million) by Consumer Offering, 2025-2035
  • Figure 95: Europe Market Value (USD Million) by Country, 2025-2035
  • Figure 96: Europe Market Value (USD Million) Analysis by Country, 2020-2035
  • Figure 97: Europe Market Volume (Units) Analysis by Country, 2020-2035
  • Figure 98: Europe Market Value Share (%) and BPS Analysis by Country, 2025-2035
  • Figure 99: Europe Market Y-o-Y Growth (%) Projections by Country, 2025-2035
  • Figure 100: Europe Market Value (USD Million) Analysis by Print Technology, 2020-2035
  • Figure 101: Europe Market Volume (Units) Analysis by Print Technology, 2020-2035
  • Figure 102: Europe Market Value Share (%) and BPS Analysis by Print Technology, 2025-2035
  • Figure 103: Europe Market Y-o-Y Growth (%) Projections by Print Technology, 2025-2035
  • Figure 104: Europe Market Value (USD Million) Analysis by Function, 2020-2035
  • Figure 105: Europe Market Volume (Units) Analysis by Function, 2020-2035
  • Figure 106: Europe Market Value Share (%) and BPS Analysis by Function, 2025-2035
  • Figure 107: Europe Market Y-o-Y Growth (%) Projections by Function, 2025-2035
  • Figure 108: Europe Market Value (USD Million) Analysis by Product Type, 2020-2035
  • Figure 109: Europe Market Volume (Units) Analysis by Product Type, 2020-2035
  • Figure 110: Europe Market Value Share (%) and BPS Analysis by Product Type, 2025-2035
  • Figure 111: Europe Market Y-o-Y Growth (%) Projections by Product Type, 2025-2035
  • Figure 112: Europe Market Value (USD Million) Analysis by Consumer Offering, 2020-2035
  • Figure 113: Europe Market Volume (Units) Analysis by Consumer Offering, 2020-2035
  • Figure 114: Europe Market Value Share (%) and BPS Analysis by Consumer Offering, 2025-2035
  • Figure 115: Europe Market Y-o-Y Growth (%) Projections by Consumer Offering, 2025-2035
  • Figure 116: Europe Market Attractiveness by Print Technology, 2025-2035
  • Figure 117: Europe Market Attractiveness by Function, 2025-2035
  • Figure 118: Europe Market Attractiveness by Product Type, 2025-2035
  • Figure 119: Europe Market Attractiveness by Consumer Offering, 2025-2035
  • Figure 120: Europe Market Attractiveness by Country, 2025-2035
  • Figure 121: East Asia Market Value (USD Million) by Print Technology, 2025-2035
  • Figure 122: East Asia Market Value (USD Million) by Function, 2025-2035
  • Figure 123: East Asia Market Value (USD Million) by Product Type, 2025-2035
  • Figure 124: East Asia Market Value (USD Million) by Consumer Offering, 2025-2035
  • Figure 125: East Asia Market Value (USD Million) by Country, 2025-2035
  • Figure 126: East Asia Market Value (USD Million) Analysis by Country, 2020-2035
  • Figure 127: East Asia Market Volume (Units) Analysis by Country, 2020-2035
  • Figure 128: East Asia Market Value Share (%) and BPS Analysis by Country, 2025-2035
  • Figure 129: East Asia Market Y-o-Y Growth (%) Projections by Country, 2025-2035
  • Figure 130: East Asia Market Value (USD Million) Analysis by Print Technology, 2020-2035
  • Figure 131: East Asia Market Volume (Units) Analysis by Print Technology, 2020-2035
  • Figure 132: East Asia Market Value Share (%) and BPS Analysis by Print Technology, 2025-2035
  • Figure 133: East Asia Market Y-o-Y Growth (%) Projections by Print Technology, 2025-2035
  • Figure 134: East Asia Market Value (USD Million) Analysis by Function, 2020-2035
  • Figure 135: East Asia Market Volume (Units) Analysis by Function, 2020-2035
  • Figure 136: East Asia Market Value Share (%) and BPS Analysis by Function, 2025-2035
  • Figure 137: East Asia Market Y-o-Y Growth (%) Projections by Function, 2025-2035
  • Figure 138: East Asia Market Value (USD Million) Analysis by Product Type, 2020-2035
  • Figure 139: East Asia Market Volume (Units) Analysis by Product Type, 2020-2035
  • Figure 140: East Asia Market Value Share (%) and BPS Analysis by Product Type, 2025-2035
  • Figure 141: East Asia Market Y-o-Y Growth (%) Projections by Product Type, 2025-2035
  • Figure 142: East Asia Market Value (USD Million) Analysis by Consumer Offering, 2020-2035
  • Figure 143: East Asia Market Volume (Units) Analysis by Consumer Offering, 2020-2035
  • Figure 144: East Asia Market Value Share (%) and BPS Analysis by Consumer Offering, 2025-2035
  • Figure 145: East Asia Market Y-o-Y Growth (%) Projections by Consumer Offering, 2025-2035
  • Figure 146: East Asia Market Attractiveness by Print Technology, 2025-2035
  • Figure 147: East Asia Market Attractiveness by Function, 2025-2035
  • Figure 148: East Asia Market Attractiveness by Product Type, 2025-2035
  • Figure 149: East Asia Market Attractiveness by Consumer Offering, 2025-2035
  • Figure 150: East Asia Market Attractiveness by Country, 2025-2035
  • Figure 151: South Asia & Pacific Market Value (USD Million) by Print Technology, 2025-2035
  • Figure 152: South Asia & Pacific Market Value (USD Million) by Function, 2025-2035
  • Figure 153: South Asia & Pacific Market Value (USD Million) by Product Type, 2025-2035
  • Figure 154: South Asia & Pacific Market Value (USD Million) by Consumer Offering, 2025-2035
  • Figure 155: South Asia & Pacific Market Value (USD Million) by Country, 2025-2035
  • Figure 156: South Asia & Pacific Market Value (USD Million) Analysis by Country, 2020-2035
  • Figure 157: South Asia & Pacific Market Volume (Units) Analysis by Country, 2020-2035
  • Figure 158: South Asia & Pacific Market Value Share (%) and BPS Analysis by Country, 2025-2035
  • Figure 159: South Asia & Pacific Market Y-o-Y Growth (%) Projections by Country, 2025-2035
  • Figure 160: South Asia & Pacific Market Value (USD Million) Analysis by Print Technology, 2020-2035
  • Figure 161: South Asia & Pacific Market Volume (Units) Analysis by Print Technology, 2020-2035
  • Figure 162: South Asia & Pacific Market Value Share (%) and BPS Analysis by Print Technology, 2025-2035
  • Figure 163: South Asia & Pacific Market Y-o-Y Growth (%) Projections by Print Technology, 2025-2035
  • Figure 164: South Asia & Pacific Market Value (USD Million) Analysis by Function, 2020-2035
  • Figure 165: South Asia & Pacific Market Volume (Units) Analysis by Function, 2020-2035
  • Figure 166: South Asia & Pacific Market Value Share (%) and BPS Analysis by Function, 2025-2035
  • Figure 167: South Asia & Pacific Market Y-o-Y Growth (%) Projections by Function, 2025-2035
  • Figure 168: South Asia & Pacific Market Value (USD Million) Analysis by Product Type, 2020-2035
  • Figure 169: South Asia & Pacific Market Volume (Units) Analysis by Product Type, 2020-2035
  • Figure 170: South Asia & Pacific Market Value Share (%) and BPS Analysis by Product Type, 2025-2035
  • Figure 171: South Asia & Pacific Market Y-o-Y Growth (%) Projections by Product Type, 2025-2035
  • Figure 172: South Asia & Pacific Market Value (USD Million) Analysis by Consumer Offering, 2020-2035
  • Figure 173: South Asia & Pacific Market Volume (Units) Analysis by Consumer Offering, 2020-2035
  • Figure 174: South Asia & Pacific Market Value Share (%) and BPS Analysis by Consumer Offering, 2025-2035
  • Figure 175: South Asia & Pacific Market Y-o-Y Growth (%) Projections by Consumer Offering, 2025-2035
  • Figure 176: South Asia & Pacific Market Attractiveness by Print Technology, 2025-2035
  • Figure 177: South Asia & Pacific Market Attractiveness by Function, 2025-2035
  • Figure 178: South Asia & Pacific Market Attractiveness by Product Type, 2025-2035
  • Figure 179: South Asia & Pacific Market Attractiveness by Consumer Offering, 2025-2035
  • Figure 180: South Asia & Pacific Market Attractiveness by Country, 2025-2035
  • Figure 181: Middle East and Africa Market Value (USD Million) by Print Technology, 2025-2035
  • Figure 182: Middle East and Africa Market Value (USD Million) by Function, 2025-2035
  • Figure 183: Middle East and Africa Market Value (USD Million) by Product Type, 2025-2035
  • Figure 184: Middle East and Africa Market Value (USD Million) by Consumer Offering, 2025-2035
  • Figure 185: Middle East and Africa Market Value (USD Million) by Country, 2025-2035
  • Figure 186: Middle East and Africa Market Value (USD Million) Analysis by Country, 2020-2035
  • Figure 187: Middle East and Africa Market Volume (Units) Analysis by Country, 2020-2035
  • Figure 188: Middle East and Africa Market Value Share (%) and BPS Analysis by Country, 2025-2035
  • Figure 189: Middle East and Africa Market Y-o-Y Growth (%) Projections by Country, 2025-2035
  • Figure 190: Middle East and Africa Market Value (USD Million) Analysis by Print Technology, 2020-2035
  • Figure 191: Middle East and Africa Market Volume (Units) Analysis by Print Technology, 2020-2035
  • Figure 192: Middle East and Africa Market Value Share (%) and BPS Analysis by Print Technology, 2025-2035
  • Figure 193: Middle East and Africa Market Y-o-Y Growth (%) Projections by Print Technology, 2025-2035
  • Figure 194: Middle East and Africa Market Value (USD Million) Analysis by Function, 2020-2035
  • Figure 195: Middle East and Africa Market Volume (Units) Analysis by Function, 2020-2035
  • Figure 196: Middle East and Africa Market Value Share (%) and BPS Analysis by Function, 2025-2035
  • Figure 197: Middle East and Africa Market Y-o-Y Growth (%) Projections by Function, 2025-2035
  • Figure 198: Middle East and Africa Market Value (USD Million) Analysis by Product Type, 2020-2035
  • Figure 199: Middle East and Africa Market Volume (Units) Analysis by Product Type, 2020-2035
  • Figure 200: Middle East and Africa Market Value Share (%) and BPS Analysis by Product Type, 2025-2035
  • Figure 201: Middle East and Africa Market Y-o-Y Growth (%) Projections by Product Type, 2025-2035
  • Figure 202: Middle East and Africa Market Value (USD Million) Analysis by Consumer Offering, 2020-2035
  • Figure 203: Middle East and Africa Market Volume (Units) Analysis by Consumer Offering, 2020-2035
  • Figure 204: Middle East and Africa Market Value Share (%) and BPS Analysis by Consumer Offering, 2025-2035
  • Figure 205: Middle East and Africa Market Y-o-Y Growth (%) Projections by Consumer Offering, 2025-2035
  • Figure 206: Middle East and Africa Market Attractiveness by Print Technology, 2025-2035
  • Figure 207: Middle East and Africa Market Attractiveness by Function, 2025-2035
  • Figure 208: Middle East and Africa Market Attractiveness by Product Type, 2025-2035
  • Figure 209: Middle East and Africa Market Attractiveness by Consumer Offering, 2025-2035
  • Figure 210: Middle East and Africa Market Attractiveness by Country, 2025-2035

Frequently Asked Questions

How big is the 3D-Printed Personalized Masks Market in 2025?

The global 3D-Printed Personalized Masks Market is estimated to be valued at USD 1,050.3 million in 2025.

What will be the size of 3D-Printed Personalized Masks Market in 2035?

The market size for the 3D-Printed Personalized Masks Market is projected to reach USD 4,200.5 million by 2035.

How much will be the 3D-Printed Personalized Masks Market growth between 2025 and 2035?

The 3D-Printed Personalized Masks Market is expected to grow at a 14.9% CAGR between 2025 and 2035.

What are the key product types in the 3D-Printed Personalized Masks Market?

The key product types in the 3D-Printed Personalized Masks Market are sheet masks, patches, custom-fit gels, and capsules.

Which product type segment is expected to contribute significant share in the 3D-Printed Personalized Masks Market in 2025?

In terms of product type, the sheet masks segment is projected to command the largest share in the 3D-Printed Personalized Masks Market in 2025, accounting for 49.9% of global sales.

Explore Similar Insights

Future Market Insights

3D-Printed Personalized Masks Market

Chat With

MaRIA

Hi There, I am MaRIA, Your Market Research Intelligence Assistant. How may I help you?