Personalized Nutrition Market Outlook and Forecast 2025 to 2035 

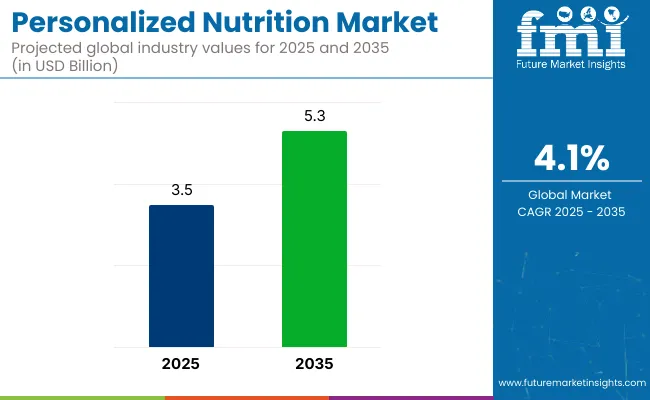
The global personalized nutrition market is valued at USD 3.5 billion in 2025 and is slated to reach USD 5.3 billion by 2035, reflecting a CAGR of 4.1%. Factors contributing to this growth include rising demand for customized supplements targeting chronic diseases, increased adoption of precision nutrition technologies, and growing awareness regarding preventive health.
Quick Stats for Personalized Nutrition Market

  • Market Value (2025): USD 3.5 billion
  • Forecast Value (2035): USD 5.3 billion
  • Forecast CAGR: 4.1%
  • Measurement Method Segment Leader in 2025: Active Measurement (62% Market Share)
  • Top Product Type Segment: Personalized Supplements (54.3% Market Share)
  • Key Growth Region: East Asia (Japan is the fastest-growing market with 5.6% CAGR)

Personalized Nutrition Market

Metric Value
Market Value (2025) USD 3.5 billion
Market Value (2035) USD 5.3 billion
CAGR (2025 to 2035) 4.1%

Additionally, market expansion is being driven by collaborations between manufacturers and wellness centers to directly reach health-conscious consumers.

In 2025, the USA is projected to grow at a CAGR of 3.1%, while Germany and Japan are expected to expand at 4.2% and 5.6%, respectively, driven by rising health awareness, precision nutrition adoption, and ageing populations. Active measurement is projected to dominate the measurement method segment with a 62% market share in 2025. Personalized supplements are expected to lead the product type category with a 54.3% market share in 2025, driven by rising consumer demand for tailored supplements addressing chronic health conditions and preventive wellness.

Government regulations are advancing personalized nutrition by supporting research and development initiatives globally. In the United States, the FDA is formulating guidelines to ensure the safety and efficacy of personalized supplements and nutraceuticals. Additionally, the European Union has implemented stringent labelling and health claim regulations to enhance consumer trust. These regulatory frameworks are aimed at ensuring quality, transparency, and scientific backing for customized nutrition solutions in respective markets.

The market holds a relatively small but growing percentage within its parent markets. In the global nutraceuticals market, personalized nutrition contributes under 1%, reflecting its emerging status. Within the dietary supplements market, valued at approximately USD 170 billion globally, personalized nutrition forms around 2% to 3%, driven by rising demand for tailored supplements.

In the broader food and beverage market, which exceeds USD 6 trillion globally, its share remains minimal. However, rapid growth is expected as health-conscious consumers increasingly seek customized solutions, pushing its significance within these larger parent markets.

Personalized Nutrition Market Analysis by Top Investment Segments

The market segments include product type, measurement method, sales channel, and region. The product type segment covers personalized supplements, personalized diet plans, personalized beverages, and disease-based supplements. The measurement method segment comprises active measurement and standard measurement.

The sales channel segment includes direct-to-consumer delivery services, wellness and fitness centers, hospitals and clinics, pharmacies, online, and retail stores. The regional segment includes North America, Latin America, Western Europe, Eastern Europe, South Asia and Pacific, East Asia, and Middle East, and Africa.

Personalized Supplements to Lead the Product Type Segment with 54.3% Market Share in 2025

The personalized supplements segment is expected to remain the most lucrative within the product type category, holding a dominant market share of 54.3% in 2025.
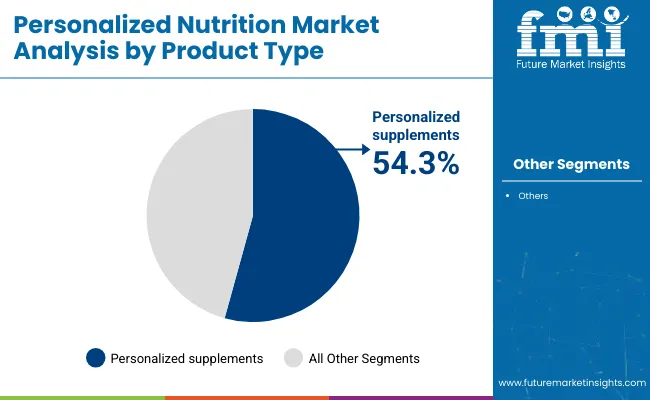
  • This growth is being driven by rising consumer demand for tailored supplements targeting chronic diseases such as diabetes, obesity, and cardiovascular conditions.
  • Personalized diet plans are witnessing steady adoption due to increasing consumer awareness about preventive healthcare and dietary interventions.

Personalized Nutrition Market Analysis By Product Type

Active Measurement to Lead the Measurement Method Segment with 62% Market Share in 2025

The active measurement segment is regarded as the most lucrative under the measurement method category, holding a market share of 62% in 2025.
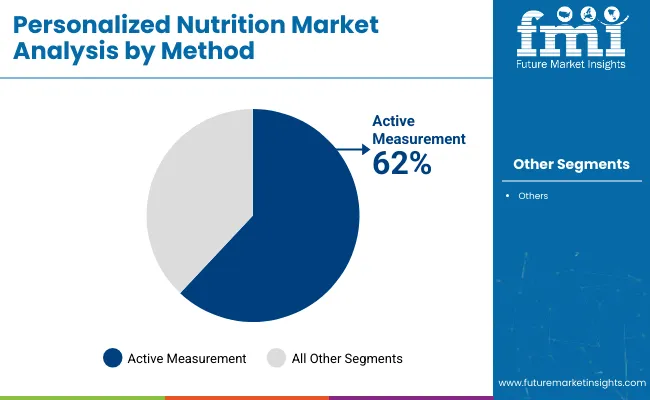
  • Its dominance is driven by increasing consumer preference for real-time, personalised data insights through DNA testing, blood biomarkers, and wearable health trackers, which enable precision-based nutrition recommendations.
  • The standard measurement segment, comprising general assessments based on dietary habits, lifestyle questionnaires, and basic health indicators, is growing steadily due to its affordability and ease of implementation in mass consumer markets.

Personalized Nutrition Market Analysis By Method

Wellness and Fitness Centers to Lead the Sales Channel Segment with 29.8% Market Share in 2025

The wellness and fitness centers segment is considered the most lucrative within the sales channel category, holding a market share of 29.8% in 2025.
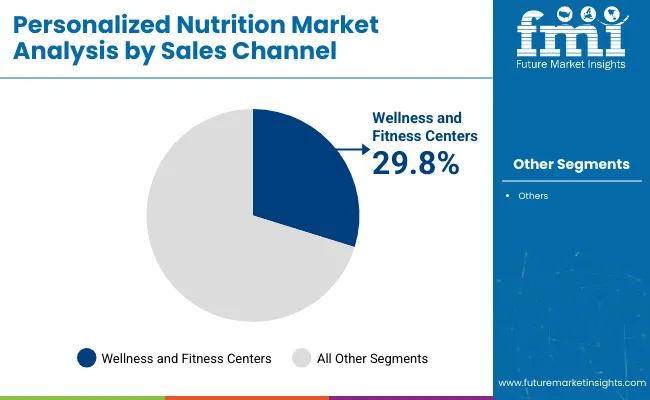
  • This dominance is driven by the strong trust consumers place in fitness and wellness professionals who recommend personalised nutrition products as part of holistic health programs.
  • Direct-to-consumer delivery services are gaining popularity due to the convenience of doorstep delivery of tailored supplements and meal plans.

Personalized Nutrition Market Analysis By Sales Channel

Top Personalized Nutrition Market Dynamics

The global market is growing steadily, driven by rising consumer demand for tailored health solutions, increasing prevalence of chronic diseases, and advancements in precision nutrition technologies, including DNA-based assessments and AI-integrated dietary recommendations.

Recent Trends in the Personalized Nutrition Market

  • AI and machine learning are being integrated for precision nutrition recommendations.
  • DNA and biomarker testing are increasingly used to personalise diet plans.
  • Collaborations with fitness centers and wellness platforms are expanding market reach.
  • Consumer preference is shifting towards preventive healthcare and tailored supplements.
  • Startups are introducing app-based personalised meal planning and tracking services.

Challenges in the Personalized Nutrition Market
  • The high cost of personalised nutrition products limits mass adoption.
  • Lack of standard regulatory frameworks for personalised supplements poses risks.
  • Data privacy concerns are rising due to the use of genetic and health data.
  • Limited awareness in emerging economies restricts market penetration.
  • Complex supply chains and ingredient sourcing affect operational scalability.

Analyzing Top Countries Supplying and Consuming Personalized Nutrition Products

Personalized Nutrition Market Country Wise Analysis

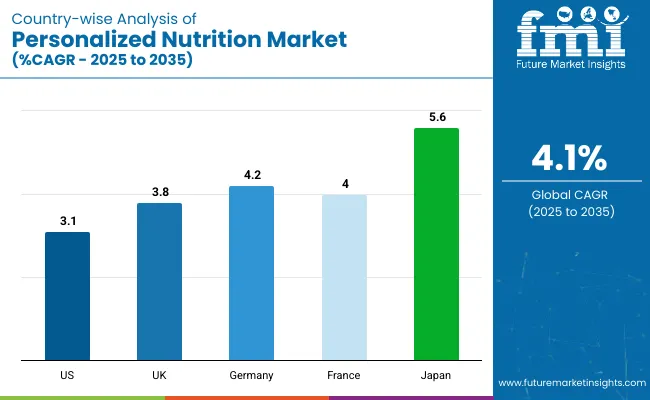
Japan is projected to lead the personalized nutrition market among these countries, growing at the highest CAGR of 5.6% from 2025 to 2035, driven by its ageing population and focus on healthy ageing solutions. Germany and France follow with steady growth rates of 4.2% and 4.0%, respectively, supported by health data integration, innovation, and strong regulatory frameworks.

The USA market is expanding at a moderate 3.1% CAGR, driven by demand among senior citizens and digital-savvy consumers. The UK shows stable growth, with its CAGR of 3.8% expected to align closely with France’s, supported by AI-based nutrition startups and rising consumer awareness.

The report covers an in-depth analysis of 40+ countries; five top-performing OECD countries are highlighted below.  

USA Personalized Nutrition Market Analysis

The USA personalized nutrition market is projected to grow at a CAGR of 3.1% from 2025 to 2035. Growth is being driven by rising demand for precision nutrition solutions among senior citizens and digital-savvy populations like millennials and Gen Z.

  • Growing demand for DNA-based personalised diet plans.
  • Increasing investment by companies in precision nutrition R&D.
  • Strong presence of key players like Nestlé and DSM.
  • Rising chronic disease prevalence is driving tailored supplement uptake.
  • Expansion of app-based personalised nutrition services.

Personalized Nutrition Products Demand Analysis in the UK

Sales of personalized nutrition products in the UK are expected to expand at a steady CAGR of 3.8% over the forecast period.

  • Rising preference for customised dietary supplements and plans.
  • Growing startups focusing on AI-based nutrition platforms.
  • Government initiatives supporting nutritional health programs.
  • Expansion of online personalised nutrition consultations.
  • Collaborations between food brands and health tech firms.

Personalized Nutrition Products Demand Analysis in Germany

Germany’s personalized nutrition products revenue is poised to grow at a CAGR of 4.2% during 2025 to 2035. The market is witnessing growth due to rising consumer use of health monitoring apps and the presence of innovative companies like MyMuesli offering DNA-based personalised cereals.

  • Increasing use of patient-generated health data for nutrition planning.
  • Strong focus on product innovation by leading brands.
  • Expansion of e-commerce platforms selling customised nutrition products.
  • Rising demand for disease-specific personalised dietary products.
  • Partnerships between food companies and biotech firms for tailored solutions.

France Personalized Nutrition Market Analysis

Sales of personalized nutrition in France are expected to expand at a CAGR of 4.0% steadily over the forecast period. The growth is driven by increasing awareness of health and wellness, a rising elderly population demanding disease-specific nutrition, and advancements in personalised supplement offerings.

  • Growing demand for functional and personalised beverages.
  • Rising popularity of nutrigenomics-based dietary solutions.
  • Expansion of online nutrition assessment and delivery services.
  • Strong regulatory focus on health claims and product safety.
  • Presence of major nutraceutical brands investing in R&D.

Japan Personalized Nutrition Market Analysis

Japan’s personalized nutrition revenue is projected to grow at a CAGR of 5.6% from 2025 to 2035. The market is driven by a rapidly ageing population, increasing focus on healthy ageing, and consumer preference for personalised supplements and beverages tailored to individual nutritional needs.

  • Rising adoption of DNA testing for dietary recommendations.
  • High consumer awareness of immunity and wellness products.
  • Leading companies like Nestlé are piloting personalised nutrition programs.
  • Preference for tailored high-protein foods and beverages.
  • Expansion of retail and online channels offering customised solutions.

Leading Personalized Nutrition Product Manufacturers and Suppliers

The market is moderately fragmented, with leading global players and emerging startups competing through innovation, partnerships, and targeted expansion strategies. Major companies like Nestlé S.A., BASF SE, and DSM dominate due to their extensive R&D capabilities and established nutraceutical portfolios.

Top companies in this market are competing by investing in AI-driven precision nutrition platforms, DNA and biomarker testing services, and strategic acquisitions to expand product offerings. Pricing strategies are tailored based on premium personalized supplement formulations and subscription-based diet planning models. Partnerships with fitness centers, biotech firms, and digital health platforms are being leveraged to enhance direct consumer access and build long-term brand loyalty.

Recent Personalized Nutrition Industry News

  • In December 2024, Wisp, a USA based firm, announced their partnership with Nourish in order to provide the patients in GLP-1s personalized nutrition counselling.
  • In April 2024, Vitamyna, one of the emerging lifestyle brands, launched its innovative personalized pack builder feature to address the increasing need for customized nutrition and wellness products.

Personalized Nutrition Market Report Scope

Report Attributes Details
Current Total Market Size (2025) USD 3.5 billion
Projected Market Size (2035) USD 5.3 billion
CAGR (2025 to 2035) 4.1%
Base Year for Estimation 2024
Historical Period 2020 to 2024
Projections Period 2025 to 2035
Market Analysis Parameters Revenue in USD billions/Volume (Metric Tons)
By Product Type Personalized Supplements, Personalized Diet Plans, Personalized Beverages, Disease Based
By Measurement Method Active Measurement, Standard Measurement
By Sales Channel Direct to Consumer Delivery Services, Wellness and Fitness Centers, Hospitals & Clinics, Pharmacies, Online, Retail Stores
Regions Covered North America, Latin America, Western Europe, Eastern Europe, East Asia, South Asia & Pacific, Middle East & Africa
Countries Covered United States, Canada, United Kingdom, Germany, France, China, Japan, South Korea, Brazil, Australia
Key Players Nestlé S.A., BASF SE, Care/of, DNAFit, mymuesli AG, General Mills, Inc., Nutrigenomix Inc., Telomere Diagnostics, Inc., Habit Food Personalized, LLC.
Additional Attributes Dollar sales by value, market share analysis by region, and country-wise analysis

Top Segments Studied in the Personalized Nutrition Market Research Report

By Product Type:

  • Personalized Supplements
  • Personalized Diet Plans
  • Personalized Beverages
  • Diseases Based

By Measurement Method:

  • Active Measurement
  • Standard Measurement

By Sales Channel:

  • Direct to Consumer Delivery Services
  • Wellness and fitness Centers
  • Hospitals & Clinics
  • Pharmacies
  • Online
  • Retail Stores

By Region:

  • North America
  • Europe
  • Asia Pacific
  • Middle East and Africa
  • Latin America

Table of Content

  1. Executive Summary
    • Global Market Outlook
    • Demand-side Trends
    • Supply-side Trends
    • Technology Roadmap Analysis
    • Analysis and Recommendations
  2. Market Overview
    • Market Coverage / Taxonomy
    • Market Definition / Scope / Limitations
  3. Market Background
    • Market Dynamics
      • Drivers
      • Restraints
      • Opportunity
      • Trends
    • Scenario Forecast
      • Demand in Optimistic Scenario
      • Demand in Likely Scenario
      • Demand in Conservative Scenario
    • Opportunity Map Analysis
    • Product Life Cycle Analysis
    • Supply Chain Analysis
      • Supply Side Participants and their Roles
        • Producers
        • Mid-Level Participants (Traders/ Agents/ Brokers)
        • Wholesalers and Distributors
      • Value Added and Value Created at Node in the Supply Chain
      • List of Raw Material Suppliers
      • List of Existing and Potential Buyer’s
    • Investment Feasibility Matrix
    • Value Chain Analysis
      • Profit Margin Analysis
      • Wholesalers and Distributors
      • Retailers
    • PESTLE and Porter’s Analysis
    • Regulatory Landscape
      • By Key Regions
      • By Key Countries
    • Regional Parent Market Outlook
    • Production and Consumption Statistics
    • Import and Export Statistics
  4. Global Market Analysis 2020 to 2024 and Forecast, 2025 to 2035
    • Historical Market Size Value (USD Billion) & Volume (Metric Tons) Analysis, 2020 to 2024
    • Current and Future Market Size Value (USD Billion) & Volume (Metric Tons) Projections, 2025 to 2035
      • Y-o-Y Growth Trend Analysis
      • Absolute $ Opportunity Analysis
  5. Global Market Pricing Analysis 2020 to 2024 and Forecast 2025 to 2035
  6. Global Market Analysis 2020 to 2024 and Forecast 2025 to 2035, By Product Type
    • Introduction / Key Findings
    • Historical Market Size Value (USD Billion) & Volume (Metric Tons) Analysis By Product Type, 2020 to 2024
    • Current and Future Market Size Value (USD Billion) & Volume (Metric Tons) Analysis and Forecast By Product Type, 2025 to 2035
      • Personalized Supplements
      • Personalized Diet Plans
      • Personalized Beverages
      • Disease Based
    • Y-o-Y Growth Trend Analysis By Product Type, 2020 to 2024
    • Absolute $ Opportunity Analysis By Product Type, 2025 to 2035
  7. Global Market Analysis 2020 to 2024 and Forecast 2025 to 2035, By Measurement Method
    • Introduction / Key Findings
    • Historical Market Size Value (USD Billion) & Volume (Metric Tons) Analysis By Measurement Method, 2020 to 2024
    • Current and Future Market Size Value (USD Billion) & Volume (Metric Tons) Analysis and Forecast By Measurement Method, 2025 to 2035
      • Active Measurement
      • Standard Measurement
    • Y-o-Y Growth Trend Analysis By Measurement Method, 2020 to 2024
    • Absolute $ Opportunity Analysis By Measurement Method, 2025 to 2035
  8. Global Market Analysis 2020 to 2024 and Forecast 2025 to 2035, By Sales Channel
    • Introduction / Key Findings
    • Historical Market Size Value (USD Billion) & Volume (Metric Tons) Analysis By Sales Channel, 2020 to 2024
    • Current and Future Market Size Value (USD Billion) & Volume (Metric Tons) Analysis and Forecast By Sales Channel, 2025 to 2035
      • Direct to Consumer Delivery Services
      • Wellness and Fitness Centers
      • Hospitals & Clinics
      • Pharmacies
      • Online
      • Retail Stores
    • Y-o-Y Growth Trend Analysis By Sales Channel, 2020 to 2024
    • Absolute $ Opportunity Analysis By Sales Channel, 2025 to 2035
  9. Global Market Analysis 2020 to 2024 and Forecast 2025 to 2035, By Region
    • Introduction
    • Historical Market Size Value (USD Billion) & Volume (Metric Tons) Analysis By Region, 2020 to 2024
    • Current Market Size Value (USD Billion) & Volume (Metric Tons) Analysis and Forecast By Region, 2025 to 2035
      • USA
      • Latin America
      • Western Europe
      • Eastern Europe
      • East Asia
      • South Asia & Pacific
      • Middle East and Africa
    • Market Attractiveness Analysis By Region
  10. USA Market Analysis 2020 to 2024 and Forecast 2025 to 2035, By Country
    • Historical Market Size Value (USD Billion) & Volume (Metric Tons) Trend Analysis By Market Taxonomy, 2020 to 2024
    • Market Size Value (USD Billion) & Volume (Metric Tons) Forecast By Market Taxonomy, 2025 to 2035
      • By Country
        • Canada
        • Brazil
        • Mexico
        • Argentina
      • By Product Type
      • By Measurement Method
      • By Sales Channel
    • Market Attractiveness Analysis
      • By Country
      • By Product Type
      • By Measurement Method
      • By Sales Channel
    • Key Takeaways
  11. Latin America Market Analysis 2020 to 2024 and Forecast 2025 to 2035, By Country
    • Historical Market Size Value (USD Billion) & Volume (Metric Tons) Trend Analysis By Market Taxonomy, 2020 to 2024
    • Market Size Value (USD Billion) & Volume (Metric Tons) Forecast By Market Taxonomy, 2025 to 2035
      • By Country
        • Brazil
        • Argentina
        • Rest of LATAM
      • By Product Type
      • By Measurement Method
      • By Sales Channel
    • Market Attractiveness Analysis
      • By Country
      • By Product Type
      • By Measurement Method
      • By Sales Channel
    • Key Takeaways
  12. Western Europe Market Analysis 2020 to 2024 and Forecast 2025 to 2035, By Country
    • Historical Market Size Value (USD Billion) & Volume (Metric Tons) Trend Analysis By Market Taxonomy, 2020 to 2024
    • Market Size Value (USD Billion) & Volume (Metric Tons) Forecast By Market Taxonomy, 2025 to 2035
      • By Country
        • Germany
        • Italy
        • France
        • UK
        • Spain
        • BENELUX
        • Nordic
        • Rest of W.Europe
      • By Product Type
      • By Measurement Method
      • By Sales Channel
    • Market Attractiveness Analysis
      • By Country
      • By Product Type
      • By Measurement Method
      • By Sales Channel
    • Key Takeaways
  13. Eastern Europe Market Analysis 2020 to 2024 and Forecast 2025 to 2035, By Country
    • Historical Market Size Value (USD Billion) & Volume (Metric Tons) Trend Analysis By Market Taxonomy, 2020 to 2024
    • Market Size Value (USD Billion) & Volume (Metric Tons) Forecast By Market Taxonomy, 2025 to 2035
      • By Country
        • Russia
        • Hungary
        • Poland
        • Balkan & Baltics
        • Rest of E. Europe
      • By Product Type
      • By Measurement Method
      • By Sales Channel
    • Market Attractiveness Analysis
      • By Country
      • By Product Type
      • By Measurement Method
      • By Sales Channel
    • Key Takeaways
  14. East Asia Market Analysis 2020 to 2024 and Forecast 2025 to 2035, By Country
    • Historical Market Size Value (USD Billion) & Volume (Metric Tons) Trend Analysis By Market Taxonomy, 2020 to 2024
    • Market Size Value (USD Billion) & Volume (Metric Tons) Forecast By Market Taxonomy, 2025 to 2035
      • By Country
        • China
        • Japan
        • South Korea
      • By Product Type
      • By Measurement Method
      • By Sales Channel
    • Market Attractiveness Analysis
      • By Country
      • By Product Type
      • By Measurement Method
      • By Sales Channel
    • Key Takeaways
  15. South Asia & Pacific Market Analysis 2020 to 2024 and Forecast 2025 to 2035, By Country
    • Historical Market Size Value (USD Billion) & Volume (Metric Tons) Trend Analysis By Market Taxonomy, 2020 to 2024
    • Market Size Value (USD Billion) & Volume (Metric Tons) Forecast By Market Taxonomy, 2025 to 2035
      • By Country
        • India
        • Australia & New Zealand
        • ASEAN
        • Rest of SAP
      • By Product Type
      • By Measurement Method
      • By Sales Channel
    • Market Attractiveness Analysis
      • By Country
      • By Product Type
      • By Measurement Method
      • By Sales Channel
    • Key Takeaways
  16. Middle East and Africa Market Analysis 2020 to 2024 and Forecast 2025 to 2035, By Country
    • Historical Market Size Value (USD Billion) & Volume (Metric Tons) Trend Analysis By Market Taxonomy, 2020 to 2024
    • Market Size Value (USD Billion) & Volume (Metric Tons) Forecast By Market Taxonomy, 2025 to 2035
      • By Country
        • GCC Countries
        • Northern Africa
        • South Africa
        • Turkiye
        • Rest of MEA
      • By Product Type
      • By Measurement Method
      • By Sales Channel
    • Market Attractiveness Analysis
      • By Country
      • By Product Type
      • By Measurement Method
      • By Sales Channel
    • Key Takeaways
  17. Key Countries Market Analysis
    • USA
      • Pricing Analysis
      • Market Share Analysis, 2024
        • By Product Type
        • By Measurement Method
        • By Sales Channel
    • Canada
      • Pricing Analysis
      • Market Share Analysis, 2024
        • By Product Type
        • By Measurement Method
        • By Sales Channel
    • Brazil
      • Pricing Analysis
      • Market Share Analysis, 2024
        • By Product Type
        • By Measurement Method
        • By Sales Channel
    • Mexico
      • Pricing Analysis
      • Market Share Analysis, 2024
        • By Product Type
        • By Measurement Method
        • By Sales Channel
    • Argentina
      • Pricing Analysis
      • Market Share Analysis, 2024
        • By Product Type
        • By Measurement Method
        • By Sales Channel
  18. Market Structure Analysis
    • Competition Dashboard
    • Competition Benchmarking
    • Market Share Analysis of Top Players
      • By Regional
      • By Product Type
      • By Measurement Method
      • By Sales Channel
  19. Competition Analysis
    • Competition Deep Dive
      • Nestlé S.A
        • Overview
        • Product Portfolio
        • Profitability by Market Segments (Product/Age /Sales Channel/Region)
        • Sales Footprint
        • Strategy Overview
          • Marketing Strategy
          • Product Strategy
          • Channel Strategy
      • BASF SE
        • Overview
        • Product Portfolio
        • Profitability by Market Segments (Product/Age /Sales Channel/Region)
        • Sales Footprint
        • Strategy Overview
          • Marketing Strategy
          • Product Strategy
          • Channel Strategy
      • Care/of
        • Overview
        • Product Portfolio
        • Profitability by Market Segments (Product/Age /Sales Channel/Region)
        • Sales Footprint
        • Strategy Overview
          • Marketing Strategy
          • Product Strategy
          • Channel Strategy
      • DNAFit
        • Overview
        • Product Portfolio
        • Profitability by Market Segments (Product/Age /Sales Channel/Region)
        • Sales Footprint
        • Strategy Overview
          • Marketing Strategy
          • Product Strategy
          • Channel Strategy
      • mymuesli AG
        • Overview
        • Product Portfolio
        • Profitability by Market Segments (Product/Age /Sales Channel/Region)
        • Sales Footprint
        • Strategy Overview
          • Marketing Strategy
          • Product Strategy
          • Channel Strategy
      • General Mills, Inc.
        • Overview
        • Product Portfolio
        • Profitability by Market Segments (Product/Age /Sales Channel/Region)
        • Sales Footprint
        • Strategy Overview
          • Marketing Strategy
          • Product Strategy
          • Channel Strategy
      • Nutrigenomix Inc.
        • Overview
        • Product Portfolio
        • Profitability by Market Segments (Product/Age /Sales Channel/Region)
        • Sales Footprint
        • Strategy Overview
          • Marketing Strategy
          • Product Strategy
          • Channel Strategy
      • Telomere Diagnostics, Inc
        • Overview
        • Product Portfolio
        • Profitability by Market Segments (Product/Age /Sales Channel/Region)
        • Sales Footprint
        • Strategy Overview
          • Marketing Strategy
          • Product Strategy
          • Channel Strategy
      • Habit Food Personalized, LLC
        • Overview
        • Product Portfolio
        • Profitability by Market Segments (Product/Age /Sales Channel/Region)
        • Sales Footprint
        • Strategy Overview
          • Marketing Strategy
          • Product Strategy
          • Channel Strategy
  20. Assumptions & Acronyms Used
  21. Research Methodology

List of Tables

  • Table 1: Global Market Value (USD Billion) Forecast by Region, 2020-2035
  • Table 2: Global Market Volume (Metric Tons) Forecast by Region, 2020-2035
  • Table 3: Global Market Value (USD Billion) Forecast by Product Type, 2020-2035
  • Table 4: Global Market Volume (Metric Tons) Forecast by Product Type, 2020-2035
  • Table 5: Global Market Value (USD Billion) Forecast by Measurement Method, 2020-2035
  • Table 6: Global Market Volume (Metric Tons) Forecast by Measurement Method, 2020-2035
  • Table 7: Global Market Value (USD Billion) Forecast by Sales Channel, 2020-2035
  • Table 8: Global Market Volume (Metric Tons) Forecast by Sales Channel, 2020-2035
  • Table 9: USA Market Value (USD Billion) Forecast by Country, 2020-2035
  • Table 10: USA Market Volume (Metric Tons) Forecast by Country, 2020-2035
  • Table 11: USA Market Value (USD Billion) Forecast by Product Type, 2020-2035
  • Table 12: USA Market Volume (Metric Tons) Forecast by Product Type, 2020-2035
  • Table 13: USA Market Value (USD Billion) Forecast by Measurement Method, 2020-2035
  • Table 14: USA Market Volume (Metric Tons) Forecast by Measurement Method, 2020-2035
  • Table 15: USA Market Value (USD Billion) Forecast by Sales Channel, 2020-2035
  • Table 16: USA Market Volume (Metric Tons) Forecast by Sales Channel, 2020-2035
  • Table 17: Latin America Market Value (USD Billion) Forecast by Country, 2020-2035
  • Table 18: Latin America Market Volume (Metric Tons) Forecast by Country, 2020-2035
  • Table 19: Latin America Market Value (USD Billion) Forecast by Product Type, 2020-2035
  • Table 20: Latin America Market Volume (Metric Tons) Forecast by Product Type, 2020-2035
  • Table 21: Latin America Market Value (USD Billion) Forecast by Measurement Method, 2020-2035
  • Table 22: Latin America Market Volume (Metric Tons) Forecast by Measurement Method, 2020-2035
  • Table 23: Latin America Market Value (USD Billion) Forecast by Sales Channel, 2020-2035
  • Table 24: Latin America Market Volume (Metric Tons) Forecast by Sales Channel, 2020-2035
  • Table 25: Western Europe Market Value (USD Billion) Forecast by Country, 2020-2035
  • Table 26: Western Europe Market Volume (Metric Tons) Forecast by Country, 2020-2035
  • Table 27: Western Europe Market Value (USD Billion) Forecast by Product Type, 2020-2035
  • Table 28: Western Europe Market Volume (Metric Tons) Forecast by Product Type, 2020-2035
  • Table 29: Western Europe Market Value (USD Billion) Forecast by Measurement Method, 2020-2035
  • Table 30: Western Europe Market Volume (Metric Tons) Forecast by Measurement Method, 2020-2035
  • Table 31: Western Europe Market Value (USD Billion) Forecast by Sales Channel, 2020-2035
  • Table 32: Western Europe Market Volume (Metric Tons) Forecast by Sales Channel, 2020-2035
  • Table 33: Eastern Europe Market Value (USD Billion) Forecast by Country, 2020-2035
  • Table 34: Eastern Europe Market Volume (Metric Tons) Forecast by Country, 2020-2035
  • Table 35: Eastern Europe Market Value (USD Billion) Forecast by Product Type, 2020-2035
  • Table 36: Eastern Europe Market Volume (Metric Tons) Forecast by Product Type, 2020-2035
  • Table 37: Eastern Europe Market Value (USD Billion) Forecast by Measurement Method, 2020-2035
  • Table 38: Eastern Europe Market Volume (Metric Tons) Forecast by Measurement Method, 2020-2035
  • Table 39: Eastern Europe Market Value (USD Billion) Forecast by Sales Channel, 2020-2035
  • Table 40: Eastern Europe Market Volume (Metric Tons) Forecast by Sales Channel, 2020-2035
  • Table 41: East Asia Market Value (USD Billion) Forecast by Country, 2020-2035
  • Table 42: East Asia Market Volume (Metric Tons) Forecast by Country, 2020-2035
  • Table 43: East Asia Market Value (USD Billion) Forecast by Product Type, 2020-2035
  • Table 44: East Asia Market Volume (Metric Tons) Forecast by Product Type, 2020-2035
  • Table 45: East Asia Market Value (USD Billion) Forecast by Measurement Method, 2020-2035
  • Table 46: East Asia Market Volume (Metric Tons) Forecast by Measurement Method, 2020-2035
  • Table 47: East Asia Market Value (USD Billion) Forecast by Sales Channel, 2020-2035
  • Table 48: East Asia Market Volume (Metric Tons) Forecast by Sales Channel, 2020-2035
  • Table 49: South Asia & Pacific Market Value (USD Billion) Forecast by Country, 2020-2035
  • Table 50: South Asia & Pacific Market Volume (Metric Tons) Forecast by Country, 2020-2035
  • Table 51: South Asia & Pacific Market Value (USD Billion) Forecast by Product Type, 2020-2035
  • Table 52: South Asia & Pacific Market Volume (Metric Tons) Forecast by Product Type, 2020-2035
  • Table 53: South Asia & Pacific Market Value (USD Billion) Forecast by Measurement Method, 2020-2035
  • Table 54: South Asia & Pacific Market Volume (Metric Tons) Forecast by Measurement Method, 2020-2035
  • Table 55: South Asia & Pacific Market Value (USD Billion) Forecast by Sales Channel, 2020-2035
  • Table 56: South Asia & Pacific Market Volume (Metric Tons) Forecast by Sales Channel, 2020-2035
  • Table 57: Middle East and Africa Market Value (USD Billion) Forecast by Country, 2020-2035
  • Table 58: Middle East and Africa Market Volume (Metric Tons) Forecast by Country, 2020-2035
  • Table 59: Middle East and Africa Market Value (USD Billion) Forecast by Product Type, 2020-2035
  • Table 60: Middle East and Africa Market Volume (Metric Tons) Forecast by Product Type, 2020-2035
  • Table 61: Middle East and Africa Market Value (USD Billion) Forecast by Measurement Method, 2020-2035
  • Table 62: Middle East and Africa Market Volume (Metric Tons) Forecast by Measurement Method, 2020-2035
  • Table 63: Middle East and Africa Market Value (USD Billion) Forecast by Sales Channel, 2020-2035
  • Table 64: Middle East and Africa Market Volume (Metric Tons) Forecast by Sales Channel, 2020-2035

List of Figures

  • Figure 1: Global Market Volume (Metric Tons) Forecast 2020-2035
  • Figure 2: Global Market Pricing Analysis
  • Figure 3: Global Market Value (USD Billion) Forecast 2020-2035
  • Figure 4: Global Market Value Share and BPS Analysis by Product Type, 2025 and 2035
  • Figure 5: Global Market Y-o-Y Growth Comparison by Product Type, 2025-2035
  • Figure 6: Global Market Attractiveness Analysis by Product Type
  • Figure 7: Global Market Value Share and BPS Analysis by Measurement Method, 2025 and 2035
  • Figure 8: Global Market Y-o-Y Growth Comparison by Measurement Method, 2025-2035
  • Figure 9: Global Market Attractiveness Analysis by Measurement Method
  • Figure 10: Global Market Value Share and BPS Analysis by Sales Channel, 2025 and 2035
  • Figure 11: Global Market Y-o-Y Growth Comparison by Sales Channel, 2025-2035
  • Figure 12: Global Market Attractiveness Analysis by Sales Channel
  • Figure 13: Global Market Value (USD Billion) Share and BPS Analysis by Region, 2025 and 2035
  • Figure 14: Global Market Y-o-Y Growth Comparison by Region, 2025-2035
  • Figure 15: Global Market Attractiveness Analysis by Region
  • Figure 16: USA Market Incremental $ Opportunity, 2025-2035
  • Figure 17: Latin America Market Incremental $ Opportunity, 2025-2035
  • Figure 18: Western Europe Market Incremental $ Opportunity, 2025-2035
  • Figure 19: Eastern Europe Market Incremental $ Opportunity, 2025-2035
  • Figure 20: East Asia Market Incremental $ Opportunity, 2025-2035
  • Figure 21: South Asia & Pacific Market Incremental $ Opportunity, 2025-2035
  • Figure 22: Middle East and Africa Market Incremental $ Opportunity, 2025-2035
  • Figure 23: USA Market Value Share and BPS Analysis by Country, 2025 and 2035
  • Figure 24: USA Market Value Share and BPS Analysis by Product Type, 2025 and 2035
  • Figure 25: USA Market Y-o-Y Growth Comparison by Product Type, 2025-2035
  • Figure 26: USA Market Attractiveness Analysis by Product Type
  • Figure 27: USA Market Value Share and BPS Analysis by Measurement Method, 2025 and 2035
  • Figure 28: USA Market Y-o-Y Growth Comparison by Measurement Method, 2025-2035
  • Figure 29: USA Market Attractiveness Analysis by Measurement Method
  • Figure 30: USA Market Value Share and BPS Analysis by Sales Channel, 2025 and 2035
  • Figure 31: USA Market Y-o-Y Growth Comparison by Sales Channel, 2025-2035
  • Figure 32: USA Market Attractiveness Analysis by Sales Channel
  • Figure 33: Latin America Market Value Share and BPS Analysis by Country, 2025 and 2035
  • Figure 34: Latin America Market Value Share and BPS Analysis by Product Type, 2025 and 2035
  • Figure 35: Latin America Market Y-o-Y Growth Comparison by Product Type, 2025-2035
  • Figure 36: Latin America Market Attractiveness Analysis by Product Type
  • Figure 37: Latin America Market Value Share and BPS Analysis by Measurement Method, 2025 and 2035
  • Figure 38: Latin America Market Y-o-Y Growth Comparison by Measurement Method, 2025-2035
  • Figure 39: Latin America Market Attractiveness Analysis by Measurement Method
  • Figure 40: Latin America Market Value Share and BPS Analysis by Sales Channel, 2025 and 2035
  • Figure 41: Latin America Market Y-o-Y Growth Comparison by Sales Channel, 2025-2035
  • Figure 42: Latin America Market Attractiveness Analysis by Sales Channel
  • Figure 43: Western Europe Market Value Share and BPS Analysis by Country, 2025 and 2035
  • Figure 44: Western Europe Market Value Share and BPS Analysis by Product Type, 2025 and 2035
  • Figure 45: Western Europe Market Y-o-Y Growth Comparison by Product Type, 2025-2035
  • Figure 46: Western Europe Market Attractiveness Analysis by Product Type
  • Figure 47: Western Europe Market Value Share and BPS Analysis by Measurement Method, 2025 and 2035
  • Figure 48: Western Europe Market Y-o-Y Growth Comparison by Measurement Method, 2025-2035
  • Figure 49: Western Europe Market Attractiveness Analysis by Measurement Method
  • Figure 50: Western Europe Market Value Share and BPS Analysis by Sales Channel, 2025 and 2035
  • Figure 51: Western Europe Market Y-o-Y Growth Comparison by Sales Channel, 2025-2035
  • Figure 52: Western Europe Market Attractiveness Analysis by Sales Channel
  • Figure 53: Eastern Europe Market Value Share and BPS Analysis by Country, 2025 and 2035
  • Figure 54: Eastern Europe Market Value Share and BPS Analysis by Product Type, 2025 and 2035
  • Figure 55: Eastern Europe Market Y-o-Y Growth Comparison by Product Type, 2025-2035
  • Figure 56: Eastern Europe Market Attractiveness Analysis by Product Type
  • Figure 57: Eastern Europe Market Value Share and BPS Analysis by Measurement Method, 2025 and 2035
  • Figure 58: Eastern Europe Market Y-o-Y Growth Comparison by Measurement Method, 2025-2035
  • Figure 59: Eastern Europe Market Attractiveness Analysis by Measurement Method
  • Figure 60: Eastern Europe Market Value Share and BPS Analysis by Sales Channel, 2025 and 2035
  • Figure 61: Eastern Europe Market Y-o-Y Growth Comparison by Sales Channel, 2025-2035
  • Figure 62: Eastern Europe Market Attractiveness Analysis by Sales Channel
  • Figure 63: East Asia Market Value Share and BPS Analysis by Country, 2025 and 2035
  • Figure 64: East Asia Market Value Share and BPS Analysis by Product Type, 2025 and 2035
  • Figure 65: East Asia Market Y-o-Y Growth Comparison by Product Type, 2025-2035
  • Figure 66: East Asia Market Attractiveness Analysis by Product Type
  • Figure 67: East Asia Market Value Share and BPS Analysis by Measurement Method, 2025 and 2035
  • Figure 68: East Asia Market Y-o-Y Growth Comparison by Measurement Method, 2025-2035
  • Figure 69: East Asia Market Attractiveness Analysis by Measurement Method
  • Figure 70: East Asia Market Value Share and BPS Analysis by Sales Channel, 2025 and 2035
  • Figure 71: East Asia Market Y-o-Y Growth Comparison by Sales Channel, 2025-2035
  • Figure 72: East Asia Market Attractiveness Analysis by Sales Channel
  • Figure 73: South Asia & Pacific Market Value Share and BPS Analysis by Country, 2025 and 2035
  • Figure 74: South Asia & Pacific Market Value Share and BPS Analysis by Product Type, 2025 and 2035
  • Figure 75: South Asia & Pacific Market Y-o-Y Growth Comparison by Product Type, 2025-2035
  • Figure 76: South Asia & Pacific Market Attractiveness Analysis by Product Type
  • Figure 77: South Asia & Pacific Market Value Share and BPS Analysis by Measurement Method, 2025 and 2035
  • Figure 78: South Asia & Pacific Market Y-o-Y Growth Comparison by Measurement Method, 2025-2035
  • Figure 79: South Asia & Pacific Market Attractiveness Analysis by Measurement Method
  • Figure 80: South Asia & Pacific Market Value Share and BPS Analysis by Sales Channel, 2025 and 2035
  • Figure 81: South Asia & Pacific Market Y-o-Y Growth Comparison by Sales Channel, 2025-2035
  • Figure 82: South Asia & Pacific Market Attractiveness Analysis by Sales Channel
  • Figure 83: Middle East and Africa Market Value Share and BPS Analysis by Country, 2025 and 2035
  • Figure 84: Middle East and Africa Market Value Share and BPS Analysis by Product Type, 2025 and 2035
  • Figure 85: Middle East and Africa Market Y-o-Y Growth Comparison by Product Type, 2025-2035
  • Figure 86: Middle East and Africa Market Attractiveness Analysis by Product Type
  • Figure 87: Middle East and Africa Market Value Share and BPS Analysis by Measurement Method, 2025 and 2035
  • Figure 88: Middle East and Africa Market Y-o-Y Growth Comparison by Measurement Method, 2025-2035
  • Figure 89: Middle East and Africa Market Attractiveness Analysis by Measurement Method
  • Figure 90: Middle East and Africa Market Value Share and BPS Analysis by Sales Channel, 2025 and 2035
  • Figure 91: Middle East and Africa Market Y-o-Y Growth Comparison by Sales Channel, 2025-2035
  • Figure 92: Middle East and Africa Market Attractiveness Analysis by Sales Channel
  • Figure 93: Global Market - Tier Structure Analysis
  • Figure 94: Global Market - Company Share Analysis

Frequently Asked Questions

What is the current market size of the personalized nutrition market?

The market size is USD 3.5 billion in 2025.

What is the forecasted market size of personalized nutrition by 2035?

The market is projected to reach USD 5.3 billion by 2035.

What is the CAGR of the personalized nutrition market from 2025 to 2035?

The market is poised to grow at a CAGR of 4.1% during 2025 to 2035.

Which product type leads the personalized nutrition market?

Personalized supplements lead with a 54.3% market share in 2025.

Which sales channel holds the largest market share in the personalized nutrition market?

Wellness and fitness centers hold the largest market share with 29.8% in 2025.

Explore Similar Insights

Future Market Insights

Personalized Nutrition Market