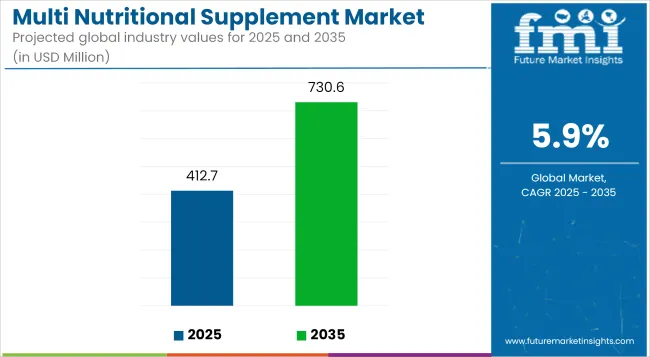
The multi nutritional supplement market is anticipated to witness significant growth over the coming years, with its market size projected to expand from USD 412.74 billion in 2025 to an impressive USD 730.63 billion by 2035. This growth reflects a CAGR of 5.9%, highlighting the increasing global demand for nutritional supplements as consumers become more health-conscious and proactive about their well-being.

| Metric | Value |
|---|---|
| Industry Size (2025E) | USD 412.74 billion |
| Industry Value (2035F) | USD 730.63 billion |
| CAGR (2025 to 2035) | 5.9% |
The market's robust expansion can be attributed to various factors, including rising awareness about nutrition, the growing prevalence of lifestyle-related diseases, and an increasing desire among individuals to maintain overall health and vitality.
One of the key drivers fueling this growth is the shift in consumer focus towards preventive health and fitness. More adults and younger populations alike are seeking ways to enhance their daily nutrition and improve their physical performance, which has led to a surge in the consumption of multi nutritional supplements.
These supplements offer a convenient way to bridge nutritional gaps caused by busy lifestyles, inadequate diets, and heightened physical activity. Moreover, the modern consumer is better informed and more conscious of the benefits that supplements can provide in terms of boosting immunity, improving energy levels, and aiding recovery after exercise. This has prompted manufacturers to innovate and offer a wider variety of products tailored to specific health needs, age groups, and lifestyles.
In addition, technological advancements and the rise of e-commerce platforms have made it easier for consumers to access a diverse range of supplements from around the world. Online fitness communities and social media influencers play a vital role in educating and motivating people to adopt healthier habits, further driving market demand.
Additionally, the increased integration of personalized nutrition through custom-blended formulas designed to address specific health concerns is attracting a broader consumer base. Overall, the multi nutritional supplement market is poised for substantial growth as preventive healthcare and fitness continue to gain prominence in the global health landscape.
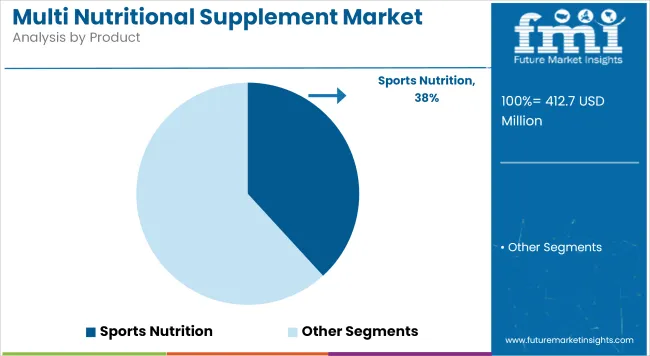
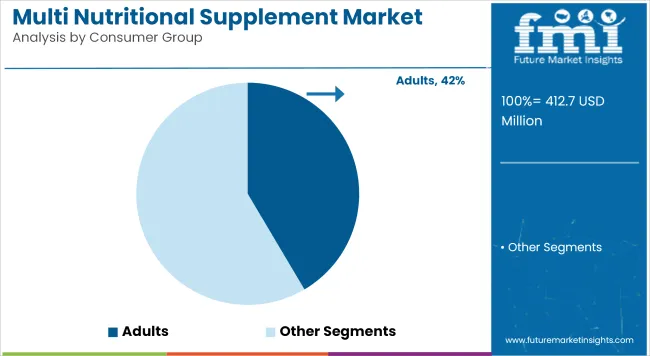
South Korea is expected to be the fastest-growing market for multi nutritional supplement, with a projected CAGR of 5.5%. Adults consumer group will dominate the type segment, holding 41.5% of the market share by 2025. Sports nutrition will lead the product segment with a 38.2% share. The USA and the UK are also expected to experience notable growth, with projected CAGRs of 5.1% and 5.2%, respectively.
| By Product | Market Share (2025) |
|---|---|
| Sports Nutrition | 38.2% |
With a 38.2% market share in 2025, sports nutrition is predicted to lead the Multi Nutritional Supplement Market. In all corners of the world, raised awareness and interest in fitness has made sport nutrition supplements such as protein powders, amino acids into the rage among athletes or bodybuilders who are at gym enthusiasts. Consumers are eager for these supplements that can help improve athletic performance, increase energy, and quicken recovery.
Workshops are starting to look like makeshift drug stores as sales people hawk not just vitamins but also everything from fish oil to multivitamins or custom-blended formulas aimed specifically at addressing a given problem Sports nutrition products are especially popular in regions where significant numbers are involved in physical activities and fitness is a part of the local culture, such as North America and Europe. Online fitness communities being increasingly widespread and sports nutrition items that are tailored to fit Propitiously-speaking age groups are also available.

| By Consumer Group | Market Share (2025) |
|---|---|
| Adults | 41.5% |
In terms of consumer groups, adults are forecast to have the largest share in market 41.5% by 2025.Meanwhile, the demand for multiple-nutritional supplements is particularly high among adult consumers who use these products to maintain their general health, prevent chronic diseases such as heart disease and cancer or AIDS and provide them nutritional gaps.
Supplements like multivitamins, minerals, omega-3 fatty acids, and probiotics are being used increasingly by adults seeking to boost their immunity, experience higher levels of energy mentally with clearer thinking trimming tendencies etc. Out in the field of nutrition today: Adults, especially city dwellers, are increasingly concerned about living healthy lives and eating healthy food.
The emphasis on preventive medicine increases purchasing. The availability of tailored supplements for specific health problems, such as joint stiffness, heart trouble and digestion disorders makes this age group a major engine driving continued market growth.

Regulatory Challenges and Compliance
The Multi Nutritional supplement market encounters tough regulatory obstacles. Different regulations in different countries-this is particularly so with labelling requirements, ingredients allowed, and health claims.
Consumer Skepticism and Trust Issues
Though the Multi Nutritional supplement market is growing, there is still a lingering consumer doubt about their effectiveness as well as safety. Trusting its product quality, the sources for ingredients and transparency of manufacturing processes are crucial matters that manufacturers do not dare neglect if they wish to keep consumers' trust intact.
Increasing Consumer Health Awareness
Health-conscious consumers are now striving for nutritional supplements which can help them maintain their overall fitness. Multi-vitamin pills demand has grown to the point where it is now shot by increasing consumer need for health and well-being.
Rise in Preventative Healthcare
With the changeover from curative medicine to preventive medicine by customers, people are turning increasingly to supplements which satisfy various needs for health such as the supply of energy, joint health or immune system strengthening. For the market this change offers a golden chance of growth-especially under conditions post-epidemic.
The United States multi nutritional supplement market is witnessing consistent growth due to growing consumer demand for tailored health and wellness solutions. The growing awareness of the advantages of multi-nutrient supplementation towards overall well-being and immune system support is a major driver.
| Country | CAGR (2025 to 2035) |
|---|---|
| United States | 5.1% |
In the UK, the multi nutritional supplement market is growing steadily. Remedies have come into the public eye since it became fashionable to favour prevention over cure; as a result of increasing numbers People who are in poor physical state anyway naturally need supplementary nutrition for their chronic health problems.
| Country | CAGR (2025 to 2035) |
|---|---|
| United Kingdom | 5.2% |
Market demand for Multi Nutritional supplements in the European Union is expanding. This growth is driven by increasing consumer awareness of natural, plant-based supplements. They are good for health in general though mental attitude immunity is also on people’s agendas now and push onto fitness has stimulated sales of all these forms
| Region | CAGR (2025 to 2035) |
|---|---|
| European Union | 5.4% |
Japan’s Multi Nutritional supplement market is showing moderate but consistent growth, fuelled by its health-conscious elderly population, a strong tradition of functional foods, and growing demand for convenient, comprehensive wellness products. Multi Nutritional supplements are being adopted in daily routines, especially in formats like gummies, powders, and on-the-go sachets.
| Country | CAGR (2025 to 2035) |
|---|---|
| Japan | 5.3% |
The current market for Multi Nutritional supplements in South Korea is expanding strongly: a result of consumers gradual focus on balanced and healthy living. The demand for dietary supplements that support immune health, skin health as well is broad in scope. Life-force is driving the market forward.
| Country | CAGR (2025 to 2035) |
|---|---|
| South Korea | 5.5% |
The Multi Nutritional Supplement Market features several key players driving innovation and growth in the industry. Leading companies include Nature's Bounty, Inc., Amway, Osteo Bi-Flex, Rexall Sundown Inc., GlaxoSmithKline Plc, Bayer AG, Herbalife International of America, Inc., Xtend Life, Sun Pharmaceuticals, and Nestlé Health Science. These organizations hold significant market share by offering a wide range of nutritional supplements tailored to diverse consumer needs, including sports nutrition, preventive health, and specialized formulations.
For example, Nature’s Bounty, Inc. is known for its extensive portfolio of vitamins and dietary supplements that focus on overall wellness and immune support. Amway provides nutritional products designed for fitness enthusiasts and health-conscious consumers worldwide. GlaxoSmithKline and Bayer AG leverage their pharmaceutical expertise to develop scientifically-backed supplements, ensuring safety and efficacy.
Herbalife International emphasizes personalized nutrition with its direct-selling model and global reach. Nestlé Health Science focuses on innovation in medical nutrition and preventive care, targeting specific health conditions and age groups. Together, these companies contribute to the market’s robust growth by addressing evolving consumer preferences and advancing supplement formulations.

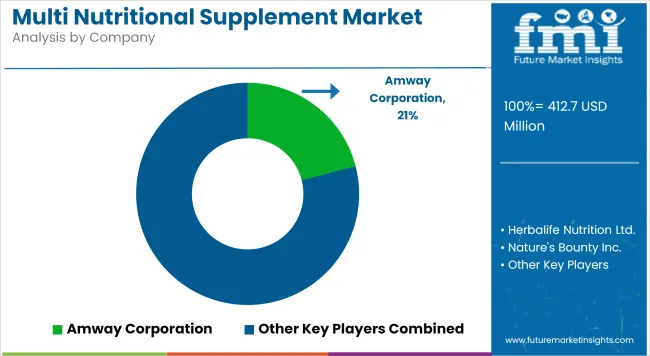
Amway Corporation (18-22%)
Amway is a professional brand in Multi Nutritional supplementation, its major production is with plant-based and organic type things. Its nutraceutical products are particularly notable for being natural and of a high quality standard.
Herbalife Nutrition Ltd. (15-19%)
Herbalife's range of weight management products and natural food supplements has helped it become a major player in the multi-vitamin field. If you are leading a healthy life at work, or confining yourself to home, these products from Herbalife are extremely well received by those people who are completely dedicated towards their health goals--especially in now so common direct selling markets around town.
Nature's Bounty Inc. (12-16%)
Nature’s Bounty is a well-known name in the nutritional supplement market, with a wealth of multivitamins available for health-conscious consumers. It is well positioned to compete given the company's strong track record on ingredient quality and formula design alone.
Abbott Laboratories (10-14%)
Abbott's Ensure products are used by people with specific nutritional requirements such as elderly people and certain health conditions. The products have been recommended by medics, thus strengthening still further its presence in the market.
GNC Holdings (8-12%)
GNC concentrates on the health market and its comprehensive range of multivitamins and health products have helped it to dominate this market. It is particularly popular among athletes and people wanting to improve their health and performance in any way.
Other Key Players (25-35% Combined)
The overall market size for Multi Nutritional Supplement market was USD 412.74 billion in 2025.
The Multi Nutritional Supplement market is expected to reach USD 730.63 billion in 2035.
Rising health awareness, increasing aging population, growing demand for preventive healthcare, and expanding use of functional foods and supplements across diverse consumer groups will drive the multi nutritional supplement market during the forecast period.
The top 5 countries which drives the development of Multi Nutritional Supplement market are USA, European Union, Japan, South Korea and UK.
Sports Nutrition demand supplier to command significant share over the assessment period.


Full Research Suite comprises of:
Market outlook & trends analysis
Interviews & case studies
Strategic recommendations
Vendor profiles & capabilities analysis
5-year forecasts
8 regions and 60+ country-level data splits
Market segment data splits
12 months of continuous data updates
DELIVERED AS:
PDF EXCEL ONLINE
Multichannel Order Management Market Forecast and Outlook 2025 to 2035
Multiexperience Development Platform Market Forecast and Outlook 2025 to 2035
Multi Depth Corrugated Box Market Size and Share Forecast Outlook 2025 to 2035
Multilayer Flexible Packaging Market Size and Share Forecast Outlook 2025 to 2035
Multi Attachment Loaders Market Size and Share Forecast Outlook 2025 to 2035
Multi Pocket Holders Market Size and Share Forecast Outlook 2025 to 2035
Multi-Screen Super Glass Market Size and Share Forecast Outlook 2025 to 2035
Multichannel Reagent Reservoir Market Size and Share Forecast Outlook 2025 to 2035
Multi-Functional Point Of Care Testing Market Size and Share Forecast Outlook 2025 to 2035
Multi-layer Film Recycling Market Size and Share Forecast Outlook 2025 to 2035
Multifunctional Household Robot Market Size and Share Forecast Outlook 2025 to 2035
Multistage Ring Section Pumps Market Size and Share Forecast Outlook 2025 to 2035
Multi-photon Microscopic System Market Size and Share Forecast Outlook 2025 to 2035
Multi-axis Truss Robot Market Size and Share Forecast Outlook 2025 to 2035
Multi-Axis PCB Drilling Machine Market Size and Share Forecast Outlook 2025 to 2035
Multi-Modal Biometric Cabin Sensors Market Analysis - Size, Share, and Forecast Outlook 2025 to 2035
Multivitamin-Infused Skincare Market Analysis - Size, Share, and Forecast Outlook 2025 to 2035
Multi Touch Sensing Market Size and Share Forecast Outlook 2025 to 2035
Multiplex PCR Assays Market Size and Share Forecast Outlook 2025 to 2035
Multi-fulcrum Suspension Crane Market Size and Share Forecast Outlook 2025 to 2035

Thank you!
You will receive an email from our Business Development Manager. Please be sure to check your SPAM/JUNK folder too.
Chat With
MaRIA