Multi-Deck Refrigerated Display Cases Market Outlook 2025 to 2035

The multi-deck refrigerated display cases market is projected to grow significantly from 2025 to 2035, thanks to the expanding retail sector, increased demand for energy-efficient refrigeration solutions, and the growing adoption of smart cooling technologies.

Supermarkets, hypermarkets, and convenience stores are updating their refrigeration to meet stricter energy regulations and sustainability objectives. Furthermore, the industry is being redefined as a result of advancements in smart sensors, IoT-enabled temperature monitoring, and ecologically friendly refrigerants.

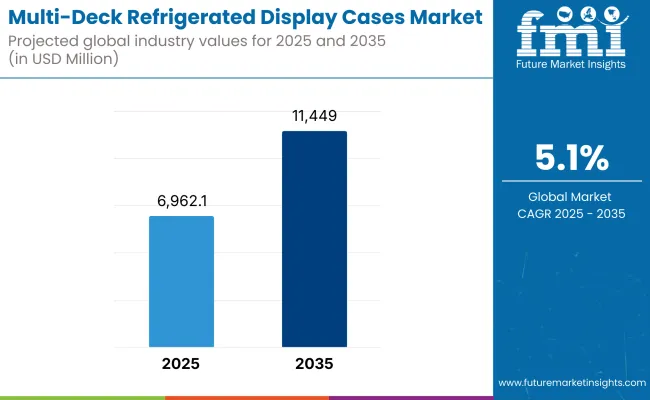
Multi Deck Refrigerated Display Cases Market Projected Global Industry Values For 2025 2035

The global value-aligned wallet as a service is expected to grow from USD 6,962.1 Million in 2025 to USD 11,449.0 Million by 2035, at a CAGR of 5.1 % during the forecast period. Growing demand for fresh and perishable food products coupled with strong demand for grab-and-go retail formats will continue to propel demand for multi-deck refrigerated display cases.
Regional Market Trends

North America

The North America region is one of the most important markets in terms of multi deck refrigerated display cases due to stringent regulations regarding food safety, increasing need for energy efficient refrigeration systems, and expanding supermarket chains in this region. The USA and Canada will soon adopt low-carbon refrigeration technologies such as hydrocarbon-based refrigerants and on-board smart cooling solutions by retailers in line with EPA and DOE energy efficiency regulations.

Europe

Europe is a key player in the market due to stringent EU regulations regarding refrigerants, an increase in the adoption of low-GWP (Global Warming Potential) cooling technologies, and initiatives geared at sustainable retail infrastructure.

Other countries, such as Germany, the UK, and France are also investing in AI-controlled temperature smart refrigeration system which not only helps preserve food but also reduces energy consumption by preventing food from going bad. Supermarket chains throughout the region are converting to CO₂-based refrigeration systems to comply with the EU’s F-Gas Regulation.

Asia-Pacific

Asia-Pacific will register the highest growth, driven by urbanization, rapid expansion of supermarkets and convenience stores, and increase in disposable income. Zero-energy refrigerators are popular in China, India, Japan and South Korea thanks to government incentives for energy-efficient appliances and rising food retail investments. Growing popularity of quick-service restaurants (QSRs) and e-commerce grocery stores also supported easy accessibility and demand for advance refrigerated display cases.

Challenges and Opportunities

Challenge:

High Initial Investment and Maintenance Costs

A high upfront investment in energy-efficient multi-deck refrigerated display cases makes it difficult for small retailers and operators of convenience stores to modernize their refrigeration systems. Advanced cooling technologies, digital temperature monitoring, and refrigerant compliance contribute to maintenance costs that drive operational expenses. To address this, manufacturers are pivoting towards modular and cost-effective refrigeration solutions for affordability.

Opportunity:

Growing Demand for Smart and Eco-Friendly Refrigeration Systems

The transition toward smart refrigeration types creates a great growth opportunity. With the aim of improving efficiency, more and more retailers are harnessing the power of IoT for temperature monitoring, predictive maintenance solutions, and AI-based cooling systems that can support operational cost reductions.

Strict environmental regulations, environmental goals, and new guidelines have also been in favour of natural refrigerants such as CO₂, ammonia, and propane. The evolving market will favour smart, sustainable and connected refrigeration solutions, companies investing in such solutions can maintain a competitive edge.

Shifts in the Multi-Deck Refrigerated Display Cases Market from 2020 to 2024 and Future Trends 2025 to 2035

The growth for multi-deck refrigerated display cases from 2020 to 2024 is primarily attributed to expanding retail sector, increasing demand of fresh food from consumers, energy efficiency regulations. A rise in open-front and glass-door refrigerated display cases in supermarkets, convenience stores, and hypermarkets also resulted in improved product visibility as well as energy savings.

The second one was governments all over the world introducing very stringent energy efficiency standards and low-GWP (Global Warming Potential) refrigerant regulations that accelerated the adoption of natural refrigerants like CO2 and hydrocarbons. Retailers sought smart refrigeration systems that paired with LED lighting, automated defrosting, and real-time temperature monitoring to maximize efficiency and lower operating costs.

However, high initial investment costs, space limitations, and variable prices of raw materials affected the market growth. But technological advances with modular and plug-in refrigerated cases have helped alleviate those concerns, making the equipment more palatable for small and mid-tier retailers.

From 2025 to 2035, the market for multi-deck refrigerated display cases will witness noteworthy changes due to AI-integrated automation, IoT-enabled connectivity, and sustainability-centric refrigeration systems.By integrating AI into energy optimization solutions, retailers will be able to monitor temperature, product stocking levels, customer interactions in real time, thereby helping them to improve the preservation of food products as well as save energy. Predictive maintenance algorithms will be employed to increase equipment lifespan and decrease downtime.

It will be driven by sustainability with completely recyclable display cases and solar-powered refrigeration as well as an ultra-low GWP refrigerants. The rising regulatory restrictions will see conventional refrigeration systems based on HFC models replaced by hydrocarbon and CO2-based systems.

Modular, self-contained refrigeration units with smart connectivity will be more widely adopted by retailers, allowing them to easily customize their store layouts and providing greater operational flexibility. The growth of e-commerce driven grocery formats will drive demand for automated, temperature-controlled fulfilment centres that interface with modern refrigerated display cases.

Market Shifts: A Comparative Analysis 2020 to 2024 vs. 2025 to 2035

Market Shift 2020 to 2024
Energy Efficiency Adoption of LED lighting, automated defrosting.
Refrigerant Transition Shift to natural refrigerants (CO2, hydrocarbons).
Retail Store Adaptation Increased use in supermarkets, hypermarkets, and small retailers.
Smart & Connected Systems Basic digital temperature monitoring.
Customization & Modularity Traditional fixed-installation units.
Market Growth Drivers Regulatory mandates, demand for fresh food.
Market Shift 2025 to 2035
Energy Efficiency AI-driven energy optimization, smart temperature controls.
Refrigerant Transition Full-scale adoption of ultra-low GWP and solar-powered refrigeration.
Retail Store Adaptation Expansion into automated grocery fulfillment centers and e-commerce-driven stores.
Smart & Connected Systems IoT-enabled predictive maintenance and remote-controlled cooling systems.
Customization & Modularity Modular, plug-in refrigerated display cases for flexible store layouts.
Market Growth Drivers AI-powered refrigeration, e-commerce grocery expansion, and sustainability initiatives.

Country wise Outlook

United States

The expanding grocery store chains, convenience stores and hyper-market are some factors accountable for the growth of USA multi-deck refrigerated display cases market. Market dynamics are influenced by the rising consumption of both fresh and frozen food items, as well as the growing emphasis on energy-efficient refrigeration systems.

Regulatory policies supporting eco-friendly refrigerants and high-performance cooling technologies also stimulate product adoption. To provide the utmost food safety to consumers and reduce energy consumption, retailers are replacing their traditional multi-deck units with advanced models that feature smart temperature control and IoT-based monitoring.

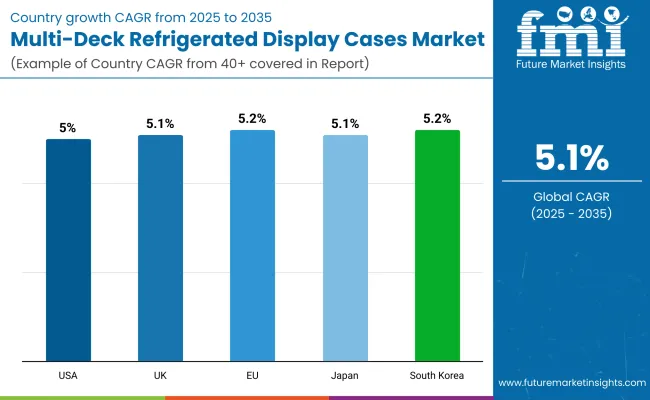
Country CAGR (2025 to 2035)
United States 5.0%

United Kingdom

The UK market can still be considered as steadily growing due to supportive factors such as increasing demand for grab-and-go food products as well as growing number of small-format grocery stores. Tight regulations on carbon emissions and the ban of hydrofluorocarbon (HFC) refrigerants are the key factors driving sustainable multi-deck refrigeration systems.

The adoption of energy-efficient and low-maintenance display cases are some of the key trends supporting retailers and food service providers to manage operational costs. Technological advancements like LED lighting, smart defrost systems, and digital displays are making these appliances more functional and appealing.

Country CAGR (2025 to 2035)
United Kingdom 5.1%

European Union

The stringent regulations for energy conservation and sustainability make Europe one of the major markets for multi-deck refrigerated display cases. Germany, France, and Italy are implementing strict energy policy, while they promote the use of display cases that improve insulation and customers use advanced cooling technology.

Consumer demand for organic and fresh produce are also driving retailers to newer high-visibility, open-front, and glass-door refrigerated display cases. The growth of discount supermarkets and hypermarkets in Eastern Europe is also driving market growth.

Country CAGR (2025 to 2035)
European Union (EU) 5.2%

Japan

Rising convenience store product, packaged meal, and frozen food sales are fuelling growth of multi-deck refrigerated display case market in Japan. A national priority on small footprint, high-efficiency, environment-friendly refrigeration systems is spurring display case innovation.

Therefore, Japanese retailers implement AI-based cooling solutions, automated maintenance alerts and remote energy monitoring to optimize refrigeration performance. This supports the Japanese desire to reduce emissions of greenhouse gases into the atmosphere, with the increasing usage of CO2-based and hydrocarbon refrigerants in commercial refrigeration.

Country CAGR (2025 to 2035)
Japan 5.1%

South Korea

In South Korea, there is a growing demand for multi-deck refrigerated display cases due to increasing penetration of modern retail formats including hypermarkets and specialty grocery stores. Government policies that encourage energy-efficient appliances and eliminate ozone-depleting substances are accelerating the transition for retailers.

This growth in demand for online grocery shopping also forces the demand for the cold chain logistics and refrigerated display units in the urbanized distribution centre. Increasing share of smart refrigeration solutions with IoT, AI, and real-time temperature monitoring

Country CAGR (2025 to 2035)
South Korea 5.2%

Segmentation Outlook - Multi-Deck Refrigerated Display Cases Market

Plug-In Multi-Deck Refrigerated Display Cases Enhance Operational Efficiency

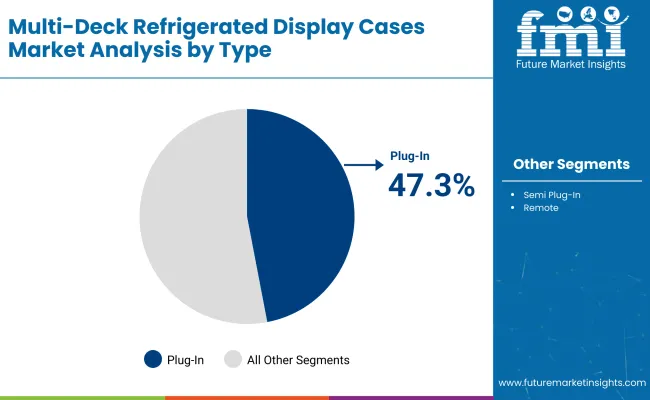
By Type Market Share (2025)
Plug-In Multi-Deck Refrigerated Display Case 47.3%

Based on type, the plug-in multi-deck refrigerated display case is projected to capture the largest market share segment through 2031 due to ease of installation, and flexibility & cost-effectiveness. Plug-in units are preferred by business types like supermarkets, convenience stores and specialty food outlets, as they do not require external refrigeration systems. These units are equipped with self-contained compressors, which means retailers can put these anywhere without any additional piping or altering of refrigeration infrastructure.

Retailers value the true plug and play nature of these refrigerated display cases providing increased layout flexibility to take advantage of customer traffic flow and seasonal merchandising needs. The portability of plug-in units also makes them ideal for small- and medium-sized enterprises (SMEs) that denounce installation. With advanced cooling technology to support reduced operating costs while enabling freshness, the newest energy-efficient models help retailers find a balance when it comes to reducing their overall operating costs.

Incorporating advanced features such as LED lighting, digital temperature controls, and energy-efficient compressors to enhance product visibility and reduce energy consumption. As international regulations to lower greenhouse gas emissions intensify, increasing the focus on sustainability to adopt green refrigerants in plug-in display cases. Plug-in multi-deck refrigerated display case market trends include the rising utilization of urban retail spaces and convenience shopping trends that help broaden the market scope.
4 to 6ft Multi-Deck Refrigerated Display Cases Offer Versatile Merchandising Solutions

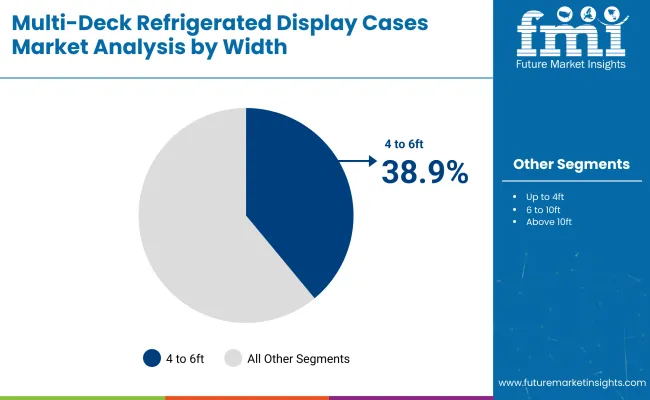
By Width Market Share (2025)
4 to 6ft Multi-Deck Refrigerated Display Case 38.9%

4 to 6ft multi deck refrigerated display case segment is likely to be preferred by retailers for the capacity that it provides while being close to space efficient. With sufficient shelving to showcase perishable products, such as dairy items, produce, drinks, and prepared foods, these models also have a small footprint that can fit in many retail settings.

These display cases are used by supermarkets, grocery stores, food service locations to showcase products in an attractive design to maximize impulse purchases. With its tiered shelving design, the display promotes best-in-class product visibility and accessibility while providing retailers with the opportunity to maximize space with a limited footprint. Adjustable shelving options allow retailers to modify the display setup, intending to adapt to various product sizes and packaging formats.

Energy-efficient refrigerators in this segment employ advanced insulation techniques, high-efficiency cooling mechanisms, and motion-sensing LED lights to significantly curb energy use. Smart temperature monitoring and remote control features get added to the operational effects in conjunction with refilling quantity in enhancement, where it ensures constant refrigeration and minimizes maintenance expenses.

4 to 6ft refrigerated display cases are popular for retailers as they can fit or adapt into any basic store layouts and product categories. The segment of multi-deck refrigerated display cases is driven by the growing demand for fresh and chilled food products and the expanding landscape of retail formats that focus on convenience.

Competitive Outlook

The Multi-Deck Refrigerated Display Cases Market is being propelled by growing demand for energy-efficient refrigeration solutions, supermarket and convenience store expansions, and technological advancements in cooling systems. To comply, companies prioritize product efficiency, sustainability and design innovations. Leading firms invest in next-generation refrigeration systems that enhance temperature control, energy efficiency, and supermarket display aesthetics.

Market Share Analysis by Company

Company Name Estimated Market Share (%)
Blue Star Limited 18-22%
Carrier Corporation 14-18%
Frigoglass SAIC 12-16%
Epta S.p.a. Refrigeration 10-14%
Other Companies (combined) 30-40%

Key Company Offerings and Activities 2024 to 2025

Company Name Key Offerings/Activities
Blue Star Limited In 2024, introduced high-efficiency multi-deck refrigerated display cases with enhanced energy-saving features.
Carrier Corporation In 2025, expanded its portfolio with advanced smart refrigeration systems for retail chains.
Frigoglass SAIC In 2024, launched eco-friendly display cases with optimized cooling performance.
Epta S.p.a. Refrigeration In 2025, developed innovative modular refrigerated display solutions to maximize store space utilization.

Key Company Insights

Blue Star Limited (18-22%)

Blue Star leads the market by offering energy-efficient multi-deck refrigerated display cases tailored for modern retail environments.

Carrier Corporation (14-18%)

Carrier focuses on smart refrigeration systems, integrating IoT and AI-based temperature control for optimized energy consumption.

Frigoglass SAIC (12-16%)

Frigoglass emphasizes sustainability, designing eco-friendly display cases that improve cooling efficiency and reduce environmental impact.

Epta S.p.a. Refrigeration (10-14%)

Epta develops modular refrigeration solutions, allowing retailers to customize their display configurations for improved space utilization.

Other Key Players (30-40% Combined)

Several refrigeration technology companies contribute to market advancements, including:

  • Dover Corporation-Expands commercial refrigeration service support through smart display case solutions.
  • Haier Group-Increases presence with energy-efficient multi-deck refrigeration systems for supermarkets.
  • Arneg S.p.A-central theme in our efforts is sustainable cooling technologies that utilize natural refrigerants.
  • Illinois Tool Works Inc.-Invests in Industrial High-Performance Refrigeration Solutions for Large Retail Formats.
  • Daikin Industries, Ltd.-Develops advanced cooling systems with greater temperature stability and energy savings.
  • Fagor Professional-Innovative carving refrigerated displays for small retail.

Key Segmentation

By Type:

  • Plug-In
  • Semi Plug-In
  • Remote

By Width:

  • Up to 4ft
  • 4 to 6ft
  • 6 to 10ft
  • Above 10ft

By End-Use:

  • Food Service Sector
    • Quick Service Restaurants
    • Bakeries
    • Hotels
    • Others
  • Retail Food and Beverage Sector
  • Fuel Station Stores
  • Hypermarkets
  • Supermarkets
  • Discount Stores

By Case Type:

  • Forced Air
  • Gravity Coil

By Region:

  • North America
  • Latin America
  • Europe
  • Asia Pacific
  • MEA

Table of Content

  1. Executive Summary
  2. Market Overview
  3. Market Background
  4. Global Market Analysis 2020 to 2024 and Forecast, 2025 to 2035
  5. Global Market Analysis 2020 to 2024 and Forecast 2025 to 2035, By Type
    • Plug-In
    • Semi Plug-In
    • Remote
  6. Global Market Analysis 2020 to 2024 and Forecast 2025 to 2035, By Width
    • Up to 4ft
    • 4 to 6ft
    • 6 to 10ft
    • Above 10ft
  7. Global Market Analysis 2020 to 2024 and Forecast 2025 to 2035, By End-Use
    • Food Service Sector
      • Quick Service Restaurants
      • Bakeries
      • Hotels
      • Others
    • Retail Food and Beverage Sector
    • Fuel Station Stores
    • Hypermarkets
    • Supermarkets
    • Discount Stores
  8. Global Market Analysis 2020 to 2024 and Forecast 2025 to 2035, By Case Type
    • Forced Air
    • Gravity Coil
  9. Global Market Analysis 2020 to 2024 and Forecast 2025 to 2035, By Region
    • North America
    • Latin America
    • Europe
    • Asia Pacific
    • MEA
  10. North America Market Analysis 2020 to 2024 and Forecast 2025 to 2035, By Country
  11. Latin America Market Analysis 2020 to 2024 and Forecast 2025 to 2035, By Country
  12. Europe Market Analysis 2020 to 2024 and Forecast 2025 to 2035, By Country
  13. Asia Pacific Market Analysis 2020 to 2024 and Forecast 2025 to 2035, By Country
  14. MEA Market Analysis 2020 to 2024 and Forecast 2025 to 2035, By Country
  15. Key Countries Market Analysis
  16. Market Structure Analysis
  17. Competition Analysis
    • Blue Star Limited
    • Carrier Corporation
    • Frigoglass SAIC
    • Epta S.p.a. Refrigeration
    • Dover Corporation
    • Haier Group
    • Arneg S.p.A
    • Illinois Tool Works Inc.
    • Daikin Industries, Ltd.
    • Fagor Professional
  18. Assumptions & Acronyms Used
  19. Research Methodology

List of Tables

Table 1: Global Market Value (US$ Million) Forecast by Region, 2018 to 2033

Table 2: Global Market Volume (Units) Forecast by Region, 2018 to 2033

Table 3: Global Market Value (US$ Million) Forecast by Type, 2018 to 2033

Table 4: Global Market Volume (Units) Forecast by Type, 2018 to 2033

Table 5: Global Market Value (US$ Million) Forecast by Width, 2018 to 2033

Table 6: Global Market Volume (Units) Forecast by Width, 2018 to 2033

Table 7: Global Market Value (US$ Million) Forecast by End-Use, 2018 to 2033

Table 8: Global Market Volume (Units) Forecast by End-Use, 2018 to 2033

Table 9: Global Market Value (US$ Million) Forecast by Case Type, 2018 to 2033

Table 10: Global Market Volume (Units) Forecast by Case Type, 2018 to 2033

Table 11: North America Market Value (US$ Million) Forecast by Country, 2018 to 2033

Table 12: North America Market Volume (Units) Forecast by Country, 2018 to 2033

Table 13: North America Market Value (US$ Million) Forecast by Type, 2018 to 2033

Table 14: North America Market Volume (Units) Forecast by Type, 2018 to 2033

Table 15: North America Market Value (US$ Million) Forecast by Width, 2018 to 2033

Table 16: North America Market Volume (Units) Forecast by Width, 2018 to 2033

Table 17: North America Market Value (US$ Million) Forecast by End-Use, 2018 to 2033

Table 18: North America Market Volume (Units) Forecast by End-Use, 2018 to 2033

Table 19: North America Market Value (US$ Million) Forecast by Case Type, 2018 to 2033

Table 20: North America Market Volume (Units) Forecast by Case Type, 2018 to 2033

Table 21: Latin America Market Value (US$ Million) Forecast by Country, 2018 to 2033

Table 22: Latin America Market Volume (Units) Forecast by Country, 2018 to 2033

Table 23: Latin America Market Value (US$ Million) Forecast by Type, 2018 to 2033

Table 24: Latin America Market Volume (Units) Forecast by Type, 2018 to 2033

Table 25: Latin America Market Value (US$ Million) Forecast by Width, 2018 to 2033

Table 26: Latin America Market Volume (Units) Forecast by Width, 2018 to 2033

Table 27: Latin America Market Value (US$ Million) Forecast by End-Use, 2018 to 2033

Table 28: Latin America Market Volume (Units) Forecast by End-Use, 2018 to 2033

Table 29: Latin America Market Value (US$ Million) Forecast by Case Type, 2018 to 2033

Table 30: Latin America Market Volume (Units) Forecast by Case Type, 2018 to 2033

Table 31: Europe Market Value (US$ Million) Forecast by Country, 2018 to 2033

Table 32: Europe Market Volume (Units) Forecast by Country, 2018 to 2033

Table 33: Europe Market Value (US$ Million) Forecast by Type, 2018 to 2033

Table 34: Europe Market Volume (Units) Forecast by Type, 2018 to 2033

Table 35: Europe Market Value (US$ Million) Forecast by Width, 2018 to 2033

Table 36: Europe Market Volume (Units) Forecast by Width, 2018 to 2033

Table 37: Europe Market Value (US$ Million) Forecast by End-Use, 2018 to 2033

Table 38: Europe Market Volume (Units) Forecast by End-Use, 2018 to 2033

Table 39: Europe Market Value (US$ Million) Forecast by Case Type, 2018 to 2033

Table 40: Europe Market Volume (Units) Forecast by Case Type, 2018 to 2033

Table 41: Asia Pacific Market Value (US$ Million) Forecast by Country, 2018 to 2033

Table 42: Asia Pacific Market Volume (Units) Forecast by Country, 2018 to 2033

Table 43: Asia Pacific Market Value (US$ Million) Forecast by Type, 2018 to 2033

Table 44: Asia Pacific Market Volume (Units) Forecast by Type, 2018 to 2033

Table 45: Asia Pacific Market Value (US$ Million) Forecast by Width, 2018 to 2033

Table 46: Asia Pacific Market Volume (Units) Forecast by Width, 2018 to 2033

Table 47: Asia Pacific Market Value (US$ Million) Forecast by End-Use, 2018 to 2033

Table 48: Asia Pacific Market Volume (Units) Forecast by End-Use, 2018 to 2033

Table 49: Asia Pacific Market Value (US$ Million) Forecast by Case Type, 2018 to 2033

Table 50: Asia Pacific Market Volume (Units) Forecast by Case Type, 2018 to 2033

Table 51: MEA Market Value (US$ Million) Forecast by Country, 2018 to 2033

Table 52: MEA Market Volume (Units) Forecast by Country, 2018 to 2033

Table 53: MEA Market Value (US$ Million) Forecast by Type, 2018 to 2033

Table 54: MEA Market Volume (Units) Forecast by Type, 2018 to 2033

Table 55: MEA Market Value (US$ Million) Forecast by Width, 2018 to 2033

Table 56: MEA Market Volume (Units) Forecast by Width, 2018 to 2033

Table 57: MEA Market Value (US$ Million) Forecast by End-Use, 2018 to 2033

Table 58: MEA Market Volume (Units) Forecast by End-Use, 2018 to 2033

Table 59: MEA Market Value (US$ Million) Forecast by Case Type, 2018 to 2033

Table 60: MEA Market Volume (Units) Forecast by Case Type, 2018 to 2033

List of Figures

Figure 1: Global Market Value (US$ Million) by Type, 2023 to 2033

Figure 2: Global Market Value (US$ Million) by Width, 2023 to 2033

Figure 3: Global Market Value (US$ Million) by End-Use, 2023 to 2033

Figure 4: Global Market Value (US$ Million) by Case Type, 2023 to 2033

Figure 5: Global Market Value (US$ Million) by Region, 2023 to 2033

Figure 6: Global Market Value (US$ Million) Analysis by Region, 2018 to 2033

Figure 7: Global Market Volume (Units) Analysis by Region, 2018 to 2033

Figure 8: Global Market Value Share (%) and BPS Analysis by Region, 2023 to 2033

Figure 9: Global Market Y-o-Y Growth (%) Projections by Region, 2023 to 2033

Figure 10: Global Market Value (US$ Million) Analysis by Type, 2018 to 2033

Figure 11: Global Market Volume (Units) Analysis by Type, 2018 to 2033

Figure 12: Global Market Value Share (%) and BPS Analysis by Type, 2023 to 2033

Figure 13: Global Market Y-o-Y Growth (%) Projections by Type, 2023 to 2033

Figure 14: Global Market Value (US$ Million) Analysis by Width, 2018 to 2033

Figure 15: Global Market Volume (Units) Analysis by Width, 2018 to 2033

Figure 16: Global Market Value Share (%) and BPS Analysis by Width, 2023 to 2033

Figure 17: Global Market Y-o-Y Growth (%) Projections by Width, 2023 to 2033

Figure 18: Global Market Value (US$ Million) Analysis by End-Use, 2018 to 2033

Figure 19: Global Market Volume (Units) Analysis by End-Use, 2018 to 2033

Figure 20: Global Market Value Share (%) and BPS Analysis by End-Use, 2023 to 2033

Figure 21: Global Market Y-o-Y Growth (%) Projections by End-Use, 2023 to 2033

Figure 22: Global Market Value (US$ Million) Analysis by Case Type, 2018 to 2033

Figure 23: Global Market Volume (Units) Analysis by Case Type, 2018 to 2033

Figure 24: Global Market Value Share (%) and BPS Analysis by Case Type, 2023 to 2033

Figure 25: Global Market Y-o-Y Growth (%) Projections by Case Type, 2023 to 2033

Figure 26: Global Market Attractiveness by Type, 2023 to 2033

Figure 27: Global Market Attractiveness by Width, 2023 to 2033

Figure 28: Global Market Attractiveness by End-Use, 2023 to 2033

Figure 29: Global Market Attractiveness by Case Type, 2023 to 2033

Figure 30: Global Market Attractiveness by Region, 2023 to 2033

Figure 31: North America Market Value (US$ Million) by Type, 2023 to 2033

Figure 32: North America Market Value (US$ Million) by Width, 2023 to 2033

Figure 33: North America Market Value (US$ Million) by End-Use, 2023 to 2033

Figure 34: North America Market Value (US$ Million) by Case Type, 2023 to 2033

Figure 35: North America Market Value (US$ Million) by Country, 2023 to 2033

Figure 36: North America Market Value (US$ Million) Analysis by Country, 2018 to 2033

Figure 37: North America Market Volume (Units) Analysis by Country, 2018 to 2033

Figure 38: North America Market Value Share (%) and BPS Analysis by Country, 2023 to 2033

Figure 39: North America Market Y-o-Y Growth (%) Projections by Country, 2023 to 2033

Figure 40: North America Market Value (US$ Million) Analysis by Type, 2018 to 2033

Figure 41: North America Market Volume (Units) Analysis by Type, 2018 to 2033

Figure 42: North America Market Value Share (%) and BPS Analysis by Type, 2023 to 2033

Figure 43: North America Market Y-o-Y Growth (%) Projections by Type, 2023 to 2033

Figure 44: North America Market Value (US$ Million) Analysis by Width, 2018 to 2033

Figure 45: North America Market Volume (Units) Analysis by Width, 2018 to 2033

Figure 46: North America Market Value Share (%) and BPS Analysis by Width, 2023 to 2033

Figure 47: North America Market Y-o-Y Growth (%) Projections by Width, 2023 to 2033

Figure 48: North America Market Value (US$ Million) Analysis by End-Use, 2018 to 2033

Figure 49: North America Market Volume (Units) Analysis by End-Use, 2018 to 2033

Figure 50: North America Market Value Share (%) and BPS Analysis by End-Use, 2023 to 2033

Figure 51: North America Market Y-o-Y Growth (%) Projections by End-Use, 2023 to 2033

Figure 52: North America Market Value (US$ Million) Analysis by Case Type, 2018 to 2033

Figure 53: North America Market Volume (Units) Analysis by Case Type, 2018 to 2033

Figure 54: North America Market Value Share (%) and BPS Analysis by Case Type, 2023 to 2033

Figure 55: North America Market Y-o-Y Growth (%) Projections by Case Type, 2023 to 2033

Figure 56: North America Market Attractiveness by Type, 2023 to 2033

Figure 57: North America Market Attractiveness by Width, 2023 to 2033

Figure 58: North America Market Attractiveness by End-Use, 2023 to 2033

Figure 59: North America Market Attractiveness by Case Type, 2023 to 2033

Figure 60: North America Market Attractiveness by Country, 2023 to 2033

Figure 61: Latin America Market Value (US$ Million) by Type, 2023 to 2033

Figure 62: Latin America Market Value (US$ Million) by Width, 2023 to 2033

Figure 63: Latin America Market Value (US$ Million) by End-Use, 2023 to 2033

Figure 64: Latin America Market Value (US$ Million) by Case Type, 2023 to 2033

Figure 65: Latin America Market Value (US$ Million) by Country, 2023 to 2033

Figure 66: Latin America Market Value (US$ Million) Analysis by Country, 2018 to 2033

Figure 67: Latin America Market Volume (Units) Analysis by Country, 2018 to 2033

Figure 68: Latin America Market Value Share (%) and BPS Analysis by Country, 2023 to 2033

Figure 69: Latin America Market Y-o-Y Growth (%) Projections by Country, 2023 to 2033

Figure 70: Latin America Market Value (US$ Million) Analysis by Type, 2018 to 2033

Figure 71: Latin America Market Volume (Units) Analysis by Type, 2018 to 2033

Figure 72: Latin America Market Value Share (%) and BPS Analysis by Type, 2023 to 2033

Figure 73: Latin America Market Y-o-Y Growth (%) Projections by Type, 2023 to 2033

Figure 74: Latin America Market Value (US$ Million) Analysis by Width, 2018 to 2033

Figure 75: Latin America Market Volume (Units) Analysis by Width, 2018 to 2033

Figure 76: Latin America Market Value Share (%) and BPS Analysis by Width, 2023 to 2033

Figure 77: Latin America Market Y-o-Y Growth (%) Projections by Width, 2023 to 2033

Figure 78: Latin America Market Value (US$ Million) Analysis by End-Use, 2018 to 2033

Figure 79: Latin America Market Volume (Units) Analysis by End-Use, 2018 to 2033

Figure 80: Latin America Market Value Share (%) and BPS Analysis by End-Use, 2023 to 2033

Figure 81: Latin America Market Y-o-Y Growth (%) Projections by End-Use, 2023 to 2033

Figure 82: Latin America Market Value (US$ Million) Analysis by Case Type, 2018 to 2033

Figure 83: Latin America Market Volume (Units) Analysis by Case Type, 2018 to 2033

Figure 84: Latin America Market Value Share (%) and BPS Analysis by Case Type, 2023 to 2033

Figure 85: Latin America Market Y-o-Y Growth (%) Projections by Case Type, 2023 to 2033

Figure 86: Latin America Market Attractiveness by Type, 2023 to 2033

Figure 87: Latin America Market Attractiveness by Width, 2023 to 2033

Figure 88: Latin America Market Attractiveness by End-Use, 2023 to 2033

Figure 89: Latin America Market Attractiveness by Case Type, 2023 to 2033

Figure 90: Latin America Market Attractiveness by Country, 2023 to 2033

Figure 91: Europe Market Value (US$ Million) by Type, 2023 to 2033

Figure 92: Europe Market Value (US$ Million) by Width, 2023 to 2033

Figure 93: Europe Market Value (US$ Million) by End-Use, 2023 to 2033

Figure 94: Europe Market Value (US$ Million) by Case Type, 2023 to 2033

Figure 95: Europe Market Value (US$ Million) by Country, 2023 to 2033

Figure 96: Europe Market Value (US$ Million) Analysis by Country, 2018 to 2033

Figure 97: Europe Market Volume (Units) Analysis by Country, 2018 to 2033

Figure 98: Europe Market Value Share (%) and BPS Analysis by Country, 2023 to 2033

Figure 99: Europe Market Y-o-Y Growth (%) Projections by Country, 2023 to 2033

Figure 100: Europe Market Value (US$ Million) Analysis by Type, 2018 to 2033

Figure 101: Europe Market Volume (Units) Analysis by Type, 2018 to 2033

Figure 102: Europe Market Value Share (%) and BPS Analysis by Type, 2023 to 2033

Figure 103: Europe Market Y-o-Y Growth (%) Projections by Type, 2023 to 2033

Figure 104: Europe Market Value (US$ Million) Analysis by Width, 2018 to 2033

Figure 105: Europe Market Volume (Units) Analysis by Width, 2018 to 2033

Figure 106: Europe Market Value Share (%) and BPS Analysis by Width, 2023 to 2033

Figure 107: Europe Market Y-o-Y Growth (%) Projections by Width, 2023 to 2033

Figure 108: Europe Market Value (US$ Million) Analysis by End-Use, 2018 to 2033

Figure 109: Europe Market Volume (Units) Analysis by End-Use, 2018 to 2033

Figure 110: Europe Market Value Share (%) and BPS Analysis by End-Use, 2023 to 2033

Figure 111: Europe Market Y-o-Y Growth (%) Projections by End-Use, 2023 to 2033

Figure 112: Europe Market Value (US$ Million) Analysis by Case Type, 2018 to 2033

Figure 113: Europe Market Volume (Units) Analysis by Case Type, 2018 to 2033

Figure 114: Europe Market Value Share (%) and BPS Analysis by Case Type, 2023 to 2033

Figure 115: Europe Market Y-o-Y Growth (%) Projections by Case Type, 2023 to 2033

Figure 116: Europe Market Attractiveness by Type, 2023 to 2033

Figure 117: Europe Market Attractiveness by Width, 2023 to 2033

Figure 118: Europe Market Attractiveness by End-Use, 2023 to 2033

Figure 119: Europe Market Attractiveness by Case Type, 2023 to 2033

Figure 120: Europe Market Attractiveness by Country, 2023 to 2033

Figure 121: Asia Pacific Market Value (US$ Million) by Type, 2023 to 2033

Figure 122: Asia Pacific Market Value (US$ Million) by Width, 2023 to 2033

Figure 123: Asia Pacific Market Value (US$ Million) by End-Use, 2023 to 2033

Figure 124: Asia Pacific Market Value (US$ Million) by Case Type, 2023 to 2033

Figure 125: Asia Pacific Market Value (US$ Million) by Country, 2023 to 2033

Figure 126: Asia Pacific Market Value (US$ Million) Analysis by Country, 2018 to 2033

Figure 127: Asia Pacific Market Volume (Units) Analysis by Country, 2018 to 2033

Figure 128: Asia Pacific Market Value Share (%) and BPS Analysis by Country, 2023 to 2033

Figure 129: Asia Pacific Market Y-o-Y Growth (%) Projections by Country, 2023 to 2033

Figure 130: Asia Pacific Market Value (US$ Million) Analysis by Type, 2018 to 2033

Figure 131: Asia Pacific Market Volume (Units) Analysis by Type, 2018 to 2033

Figure 132: Asia Pacific Market Value Share (%) and BPS Analysis by Type, 2023 to 2033

Figure 133: Asia Pacific Market Y-o-Y Growth (%) Projections by Type, 2023 to 2033

Figure 134: Asia Pacific Market Value (US$ Million) Analysis by Width, 2018 to 2033

Figure 135: Asia Pacific Market Volume (Units) Analysis by Width, 2018 to 2033

Figure 136: Asia Pacific Market Value Share (%) and BPS Analysis by Width, 2023 to 2033

Figure 137: Asia Pacific Market Y-o-Y Growth (%) Projections by Width, 2023 to 2033

Figure 138: Asia Pacific Market Value (US$ Million) Analysis by End-Use, 2018 to 2033

Figure 139: Asia Pacific Market Volume (Units) Analysis by End-Use, 2018 to 2033

Figure 140: Asia Pacific Market Value Share (%) and BPS Analysis by End-Use, 2023 to 2033

Figure 141: Asia Pacific Market Y-o-Y Growth (%) Projections by End-Use, 2023 to 2033

Figure 142: Asia Pacific Market Value (US$ Million) Analysis by Case Type, 2018 to 2033

Figure 143: Asia Pacific Market Volume (Units) Analysis by Case Type, 2018 to 2033

Figure 144: Asia Pacific Market Value Share (%) and BPS Analysis by Case Type, 2023 to 2033

Figure 145: Asia Pacific Market Y-o-Y Growth (%) Projections by Case Type, 2023 to 2033

Figure 146: Asia Pacific Market Attractiveness by Type, 2023 to 2033

Figure 147: Asia Pacific Market Attractiveness by Width, 2023 to 2033

Figure 148: Asia Pacific Market Attractiveness by End-Use, 2023 to 2033

Figure 149: Asia Pacific Market Attractiveness by Case Type, 2023 to 2033

Figure 150: Asia Pacific Market Attractiveness by Country, 2023 to 2033

Figure 151: MEA Market Value (US$ Million) by Type, 2023 to 2033

Figure 152: MEA Market Value (US$ Million) by Width, 2023 to 2033

Figure 153: MEA Market Value (US$ Million) by End-Use, 2023 to 2033

Figure 154: MEA Market Value (US$ Million) by Case Type, 2023 to 2033

Figure 155: MEA Market Value (US$ Million) by Country, 2023 to 2033

Figure 156: MEA Market Value (US$ Million) Analysis by Country, 2018 to 2033

Figure 157: MEA Market Volume (Units) Analysis by Country, 2018 to 2033

Figure 158: MEA Market Value Share (%) and BPS Analysis by Country, 2023 to 2033

Figure 159: MEA Market Y-o-Y Growth (%) Projections by Country, 2023 to 2033

Figure 160: MEA Market Value (US$ Million) Analysis by Type, 2018 to 2033

Figure 161: MEA Market Volume (Units) Analysis by Type, 2018 to 2033

Figure 162: MEA Market Value Share (%) and BPS Analysis by Type, 2023 to 2033

Figure 163: MEA Market Y-o-Y Growth (%) Projections by Type, 2023 to 2033

Figure 164: MEA Market Value (US$ Million) Analysis by Width, 2018 to 2033

Figure 165: MEA Market Volume (Units) Analysis by Width, 2018 to 2033

Figure 166: MEA Market Value Share (%) and BPS Analysis by Width, 2023 to 2033

Figure 167: MEA Market Y-o-Y Growth (%) Projections by Width, 2023 to 2033

Figure 168: MEA Market Value (US$ Million) Analysis by End-Use, 2018 to 2033

Figure 169: MEA Market Volume (Units) Analysis by End-Use, 2018 to 2033

Figure 170: MEA Market Value Share (%) and BPS Analysis by End-Use, 2023 to 2033

Figure 171: MEA Market Y-o-Y Growth (%) Projections by End-Use, 2023 to 2033

Figure 172: MEA Market Value (US$ Million) Analysis by Case Type, 2018 to 2033

Figure 173: MEA Market Volume (Units) Analysis by Case Type, 2018 to 2033

Figure 174: MEA Market Value Share (%) and BPS Analysis by Case Type, 2023 to 2033

Figure 175: MEA Market Y-o-Y Growth (%) Projections by Case Type, 2023 to 2033

Figure 176: MEA Market Attractiveness by Type, 2023 to 2033

Figure 177: MEA Market Attractiveness by Width, 2023 to 2033

Figure 178: MEA Market Attractiveness by End-Use, 2023 to 2033

Figure 179: MEA Market Attractiveness by Case Type, 2023 to 2033

Figure 180: MEA Market Attractiveness by Country, 2023 to 2033

Frequently Asked Questions

What was the overall size of the Multi-Deck Refrigerated Display Cases Market in 2025?

The overall market size for the Multi-Deck Refrigerated Display Cases Market was USD 6,962.1 Million in 2025.

How big is the Multi-Deck Refrigerated Display Cases Market expected to be in 2035?

The Multi-Deck Refrigerated Display Cases Market is expected to reach USD 11,449.0 Million in 2035.

What will drive the demand for the Multi-Deck Refrigerated Display Cases Market during the forecast period?

The demand is driven by increasing retail expansion, rising demand for fresh and frozen food products, growing adoption of energy-efficient refrigeration solutions, and stringent food safety regulations requiring advanced storage solutions in supermarkets and convenience stores.

List the top 5 countries contributing to the Multi-Deck Refrigerated Display Cases Market?

The top 5 countries driving market growth are the USA, UK, Europe, Japan and South Korea.

Which segment in type is expected to lead in the Multi-Deck Refrigerated Display Cases Market?

The Plug-In Multi-Deck Refrigerated Display Case segment is expected to command a significant share over the assessment period.

Explore Industrial Thermal & HVAC Solutions Insights

Future Market Insights

Multi-Deck Refrigerated Display Cases Market