- Global Locations -
Headquarters
Future Market Insights, Inc.
Christiana Corporate, 200 Continental Drive, Suite 401, Newark, Delaware - 19713, United States
T: +1-845-579-5705
Americas
Future Market Insights, Inc.
616 Corporate Way, Suite 2-9018,
Valley Cottage, NY 10989,
United States
T: +1-347-918-3531
MEA
Future Market Insights

1602-6 Jumeirah Bay X2 Tower, Plot No: JLT-PH2-X2A,

Jumeirah Lakes Towers, Dubai,

United Arab Emirates

Europe
Future Market Insights
3rd Floor, 207 Regent Street,
London W1B 3HH
United Kingdom
T: + 44 (0) 20 8123 9659
D: +44 (0) 20 3287 4268
Asia Pacific
Future Market Insights Global & Consulting Pvt. Ltd.
Office No. 401-A, 4th Floor,
VANTAGE 9, S.No. 36/1/1,
Baner, Pune 411045 India

Refrigerated Display Cases Market

Refrigerated Display Cases Market by Type, Design, End Use & Region | Forecast 2022 to 2032

Contrarily, Refrigerated Display Cases are selling like Hot Cakes. Catch a Glimpse of the Sales Volume in Key Regions-USA, UK, Germany, France, Japan, Korea, and more

Request Sample

Global Refrigerated Display Cases Market Outlook (2022 to 2032)

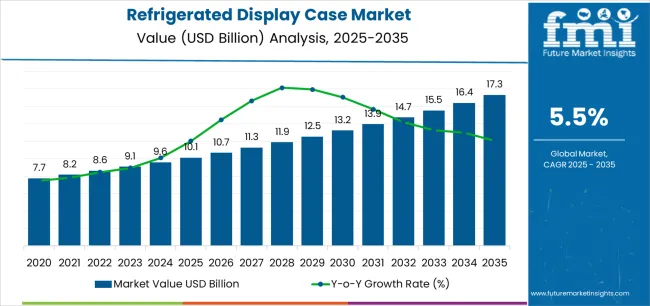
The refrigerated display cases market is predicted to grow at a moderate CAGR of 5.5% during the forecast period covering 2022 to 2032. The refrigerated display cases market share is estimated to reach a value of nearly US$ 14 Billion by 2032, expanding from a total worth of US$ 8.2 Billion in 2022.

The refrigerated display cases (RDC) market has been registering high growth over the last few years. This growth is projected to continue over the coming years due to increasing demand from the food retail sector. The increasing population and rapid urbanization in emerging economies are poised to create significant opportunities for higher sales of countertop refrigerated display cabinets in the next few years.

In its new study, ESOMAR-certified market research and consulting firm Future Market Insights (FMI) offers insights about key factors fuelling the demand for refrigerated display cases. The report tracks the global sales of Refrigerated Display Cases in 20+ high-growth markets, along with analyzing the impact COVID-19 has had on the manufacturing and retail industry of cake display cabinets in general.

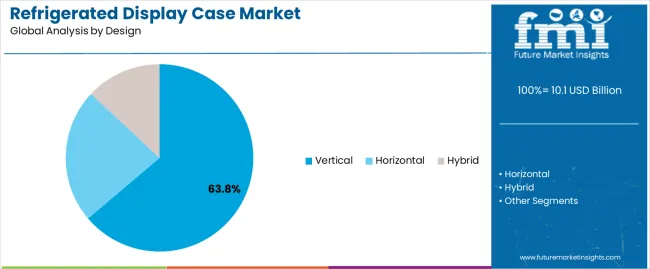
According to the report, the global refrigerated display cases market has seen a steady and continuous rise in demand in the retail food and beverage sector. This is a common trend observed in both developed and developing countries owing to high growth in the number of retail outlets. Moreover, based on design, the vertical/multi-deck RDC segment is likely to grow at a rapid pace, particularly in the food and beverage industry.

Rising and Changing Consumption Patterns to Boost the Market

Mostly commercial food services, which include hotels, restaurants, and caterers, are growing as a significant demand driver for countertop cake display cabinets for different types of food and beverages. There is also a growing realization of the importance of visual merchandising as a cheap way to boost retail sales and its role in encouraging impulse buying among customers.

A few of the other factors influencing demand in this end-use segment include soaring purchasers' discretionary income coupled with their rising expenditures on frozen and chilled baked products. For instance, cross-cultural influence and lifestyle changes that encourage the consumption of continental food products have given rise to a trend of sushi display in western countries.

Technological Advancements are making the Products Energy Efficient and Affordable

The economic significance of sophisticated RDC models that can keep food clean and hygienic in certain settings without microbiological or other forms of contamination is also increasing. Continuous technological advancements that encourage system updates and improvements are another factor fuelling the refrigerated display cases market expansion.

As a result of stricter food safety rules and quality requirements at retail shops by the government authorities have significantly increased the sales of used refrigerated display cases in many developing countries. Tapping into this lucrative opportunity is emerging as a major focus of the market that is trying to supply deli cases for sale at affordable prices to penetrate the market in these countries.

On the other hand, rising environmental concerns, low knowledge and restricted acceptance in less developed nations, and the bakery glass display case that doesn't require cooling are some of the issues limiting the market growth. So nowadays, leading market competitors are creating energy-efficient RDCs in a variety of forms and designs thanks to technical improvements in order to meet the rising needs of low-cost freezer display cases to woo the small players of the commercial food sector.

Attributes Details
Refrigerated Display Cases Market Share (2021) US$ 7.8 Billion
Refrigerated Display Cases Market Size Value (2022) US$ 8.2 Billion
Refrigerated Display Cases Market Size Value (2032) US$ 14 Billion
Refrigerated Display Cases Market Growth Rate (2022 to 2032) 5.5%

Don't pay for what you don't need

Customize your report by selecting specific countries or regions and save 30%!

Global Refrigerated Display Cases Market Historical Analysis (2015 to 2021) Vs. Forecast Outlook (2022 to 2032)

According to FMI’s analysis, refrigerated display case sales have grown at 1.5% CAGR between 2016 and 2020.

The refrigerated display cases market trends got affected by the COVID-19 pandemic crisis and witnessed a significant plunge in demand during the years 2020 and 2021. Owing to the market crisis caused by the pandemic, the production and supply chain activities had seen a minor setback, yet the demand improved with the economic recuperation post the period of curbs following the pandemic.

With a number of project and order cancellations in regions like Europe, East Asia, and South Asia Pacific, the supply and shortage in demand for sushi display and meat display cases resulted in a significant drop in overall Y-O-Y growth rate, yet FMI expects global refrigerated display cases Market to grow at 5.5% CAGR through 2032.

Will Emerging Applications in Quick Service Restaurants Influence Demand?

Urbanization has significantly increased dependence on the storage and transportation of food & beverages. Customers are looking for food services that can complement their fast-paced lifestyle, which has caused an increase in the number of quick-service restaurants. This has been a key factor in creating refrigerated display case market opportunities. Moreover, a substantial increase in the number of quick-service restaurants worldwide is a lucrative opportunity for the market.

Rising per capita income and shifting preferences of urban people are some of the leading factors resulting in the growing demand for refrigerated bakery display cases, followed by casual dining.

In Asian countries, particularly in China and South Korea, the quick service restaurant industry is thriving, which is also anticipated to spearhead the sales of the Hoshizaki sushi case in these countries and make it popular in other culturally influenced nations.

Nikhil Kaitwade
Nikhil Kaitwade
Principal Consultant
LinkedIn
Talk to Analyst

Find your sweet spots for generating winning opportunities in this market.

What are the Major Challenges Experienced by the Refrigerated Display Cases Market Players?

Other equipment manufacturers or OEMs, including refrigerated display case manufacturers, have been facing challenges in terms of compliance with refrigerant regulations implemented by various government organizations.

Manufacturing of low global warming potential (GWP) refrigerant has always been one of the prime concerns of deli display case manufacturers, which in turn is creating difficulties for end-use industries. Hence manufacturers are concentrating on more sustainable options for providing industry-specific applications to fulfill consumer requirements.

Why are Remote Refrigerated Display Cases in High Demand?

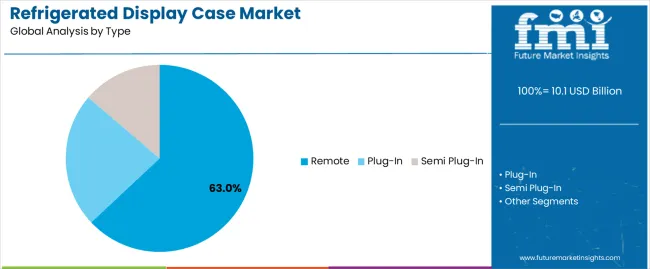
The expansion of the retail sector, including supermarkets, hypermarkets, and convenience stores, is projected to favour the refrigerated display cases market growth opportunities. As these sales channels require proper utilization of space and, at the same time, maintenance of the interior environment, this has pushed the demand for remote refrigerated display cases with remotely located condensers so that there is no heat dissipation in the store interior and the same time more storage space is available.

Remote-based refrigerated cases are enabled by the latest technologies and have very low system energy consumption and large user volume. The new advanced feature with the implementation of IoT solutions allows remote monitoring and controlling of the RDCs as well.

Get the data you need at a Fraction of the cost

Personalize your report by choosing insights you need
and save 40%!

Which End-Use Industry has a Predominant Share in the Global Market?

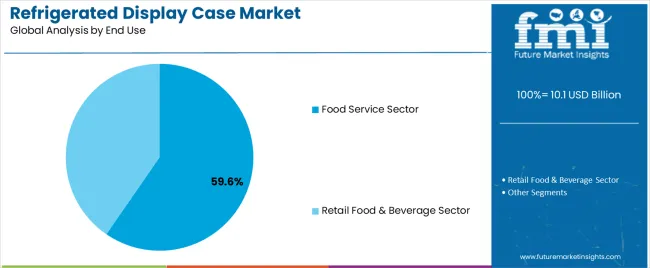
The retail food and beverage sector has had dominance over the global refrigerated display cases market among several end-user verticals for a very long time. In the past few years, the retail sector has witnessed substantial growth, which is fuelling the demand for refrigerated display cabinets further. This is due to the increasing demand from fuel station stores, supermarkets, hypermarkets, and discount stores in new and upcoming retail food and beverage activities across the globe.

In terms of design, the demand for vertical cases or countertop refrigerated displays is witnessed to be higher.

Comparative View of Adjacent Refrigerated Display Cases Market

Refrigerated Display Cases Market:

Attributes Refrigerated Display Cases Market
CAGR (2022 to 2032) 5.5%
Market Value (2022) US$ 8.2 Billion
Growth Factor Demand has been spurred by an increasing retail network and commercial sector for ready-to-eat and prepared foodstuffs.
Future Opportunities Improved products and stricter cleanliness and food safety norms at commercial eateries to drive the market further.
Market Trends The commercial food service industry's use of energy-efficient refrigerators has made ongoing Research and Development in RDC technology necessary.

Retail Cooler Market:

Attributes Retail Cooler Market
CAGR (2022 to 2032) 8.5%
Market Value (2022) US$ 1.5 Billion
Growth Factor An increase in the popularity of outdoor leisure pursuits among tourists, such as off-roading and hiking have increased sales.
Future Opportunities Advancements in manufacturing techniques for compact chillers that can maintain ice for a long time would increase the demand.
Market Trends In order to retain their market share, players in the sector are broadening the number of models and the capacity they offer.

Smart Refrigerators Market:

Attributes Smart Refrigerators Market
CAGR (2022 to 2032) 13.5%
Market Value (2022) US$ 500 Million
Growth Factor Several benefits include energy economy, enhanced cooling operations, and options for digital display of product expiration.
Future Opportunities The rapid improvements in wireless communication and IT infrastructure further the appeal of smart refrigerators.
Market Trends Start-ups are the frontrunners as youths are not shying away to try different models and brands available in the market.

How big is the Opportunity in Germany?

FMI refrigerated display cases market analysis report has projected Germany to remain one of the most remunerative markets throughout the course of the forecast period. One of the key factors supporting growth is the expansion of the food and beverage sector in the country with rapid economic growth.

Germany also is one of the leading consumer markets around the globe, which has resulted in higher adoption of refrigerant-related regulations and protocols, which infect is one of the key reasons for accelerating the total sales of bakery and cake display cabinets in the forecast period. Although there were issues related to the supply chain and raw material supply after the second half of 2020 picture started to change and provided a steady picture of the market.

What are the Market Prospects in India?

India is the largest market in the South Asia Pacific refrigerated display cases market. India is one of the fastest-growing countries, wherein urbanization is happening at a fast pace. Also, it is the second largest in terms of population worldwide. Owing to that reason, the food and beverage industry is growing, which in turn is fuelling the demand for refrigerated display cases with the expansion of the supermarkets and retail sector in India.

In addition, government organizations are implementing international regulations for the use of the type of refrigerant in deli coolers which may hamper sales figures. However, when seen from a future perspective, this decision would create positive growth prospects for the market.

Which Segment is Expected to Flourish in the USA and Why?

Remote-type deli case for sale is the fastest-growing segment in the USA refrigerated display cases market. The presence of a flourishing supermarket culture and the increasing number of HoReCa projects are expected to support this growth in the USA states over the forecast period.

According to the Food Industry Association (FIA), there were nearly 38,307 supermarkets in the USA in the year 2018, which is continuously growing. With the number forecast to rise further, the USA is anticipated to continue spearheading sales of refrigerated display cases in North America. Moreover, USA citizens have been exhibiting increasing demand for ready-to-eat meals. This, in turn, is anticipated to fuel the demand for refrigerated bakery display cases and turn out to be one of the key drivers of growth in the country.

How is Japan backing the growth in East Asia Refrigerated Display Cases Market?

Japan is expected to emerge as the leading market for refrigerated display cabinets in East Asia by the end of this forecast period in 2032. Besides the expansion of the food and retail sectors, the presence of some of the leading manufacturers is expected to bode well for the market.

The Food Export Org has identified Japan as the third largest market for packaged food, following the USA and China. With the country’s food service sector forecast to exhibit consistent growth, Japan is anticipated to remain a lucrative pocket for the sales of refrigerated and Hussmann display cases.

What is the Scope for Expansion in the GCC Countries?

On the back of the increasing population and the expansion of the food and beverage industry in the UAE and Saudi Arabia, refrigerated display case market players in this region have been registering substantial growth opportunities. This trend is expected to persist over the forecast period as the substantial increase in investment for the development of the retail sector in the countries, coupled with the increasing prominence of supermarkets, hypermarkets, and convenience stores, is paving the way for refrigerated display cases market key trends and opportunities.

Arabian Business recently published a piece of news that, as per the Dubai Chamber of Commerce and Industry, retail sales in the UAE is reached US$ 58 Billion by the end of 2021. With remarkable expansion on cards for the UAE retail sector, it will present a conducive environment for the expansion of the refrigerated showcase market in the coming years.

How Strong is the Competitive Landscape for the Refrigerated Display Cases Market?

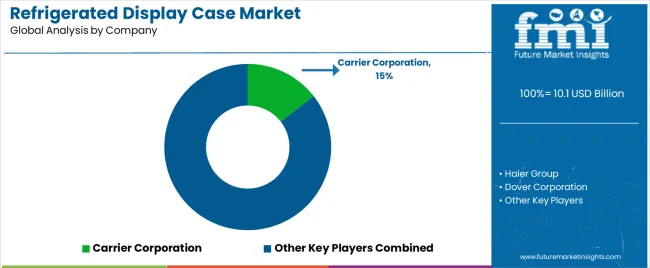
The global refrigerated display cases market is a highly competitive market owing to the presence of a large number of manufacturers. The leading players account for more than two third of the global market share. Some of the players, such as Hussmann cases, are focusing on carving a niche for a particular penetrated area.

Leading open refrigerated display case manufacturers are significantly investing in research and development activities to manufacture more advanced and energy-efficient products with an immense focus on innovation and product launches. Competitive price offerings, increase in end-user satisfaction on performance, and use of advanced technologies are some of the key trends encouraging deli cases for sale in contemporary years.

Increasing research and development activities through collaboration or partnerships with local manufacturers and distributors would also help refrigerated display case market key players to strengthen their footprint and establish supply chain networks in emerging countries coupled with long-term partnerships with regional distributors plays a pivotal role in the diversification of channel reach. These strategic tie-ups might not only help market players to expand their footprint but will create a conducive environment to conduct research initiatives.

Key Players Profiled in the Refrigerated Display Cases Market Report

  • Carrier Corporation
  • Danfoss A/S
  • Frigoglass SAIC
  • Epta S.p.a. Refrigeration
  • Dover Corporation
  • Haier Group
  • Arneg S.p.A
  • Illinois Tool Works
  • Daikin Industries, Ltd.
  • Fagor Industrial
  • CAREL INDUSTRIES S.p.A.

Report Scope

Attribute Details
Forecast Period 2021 to 2031
Historical Data Available for 2016 to 2020
Market Analysis USD Million for Value and Kilotons for Volume
Key Regions Covered North America, Latin America, Europe, East Asia, South Asia & Pacific, Middle East & Africa
Key Countries Covered USA, Canada, Germany, UK, France, Italy, Spain, Russia, China, Japan, South Korea, India, ASEAN, Oceania, Turkey, Northern Africa, South Africa
Key Segments Covered Type, End-Use, and Region.
Key Companies Profiled
  • Carrier Corporation
  • Danfoss A/S
  • Frigoglass SAIC
  • Epta S.p.a. Refrigeration
  • Dover Corporation
  • Haier Group
  • Arneg S.p.A
  • Illinois Tool Works
  • Daikin Industries, Ltd.
  • Fagor Industrial
  • CAREL INDUSTRIES S.p.A
Report Coverage Market Forecast, Brand Share Analysis, Competition Intelligence, Drivers, Restraints, Opportunities and Threats analysis, Market Dynamics and Challenges, Strategic Growth Initiatives
Customization & Pricing Available upon Request

Key Segments

By Type:

  • Plug-In Refrigerated Display Cases
  • Semi Plug-In Refrigerated Display Cases
  • Remote Refrigerated Display Cases

By Design:

  • Vertical Refrigerated Display Cases
  • Horizontal Refrigerated Display Cases
  • Hybrid Refrigerated Display Cases

By End Use:

  • Food Service Sector
    • Quick Service Restaurants
    • Bakeries
    • Hotels
    • Others
  • Retail Food & Beverage Sector
    • Fuel Station Stores
    • Hypermarkets
    • Supermarkets
    • Discount Stores

By Region:

  • North America
  • Latin America
  • Europe
  • East Asia
  • South Asia & Pacific
  • Oceania
  • Middle East and Africa

Frequently Asked Questions

The global refrigerated display cases market is to grow at 5.5% during the forecast period.

The global refrigerated display cases market likely to be valued at US$ 14 Billion by 2032.

The global refrigerated display cases market was valued at US$ 7.8 Billion in 2021.

USA accounts for the largest revenue share of the refrigerated display cases market.

Asia Pacific is predicted to witness the highest CAGR in the refrigerated display cases market.

Table of Content

1. Executive Summary | Refrigerated Display Cases Market

    1.1. Global Market Snapshot

    1.2. Demand Side Trends

    1.3. Supply Side Trends

    1.4. Analysis and Recommendations

2. Market Overview

    2.1. Market Coverage / Taxonomy

    2.2. Market Definition / Scope / Limitations

3. Key Market Trends

4. Key Success Factors

5. Global Market Demand Analysis 2016 to 2021 and Forecast, 2022 to 2032

    5.1. Historical Market Volume (Units) Analysis, 2016 to 2021

    5.2. Current and Future Market Volume (Units) Projections, 2022 to 2032

    5.3. Y-o-Y Growth Trend Analysis

6. Global Market - Pricing Analysis

7. Global Market Demand (in Value or Size in US$ Million) Analysis 2016 to 2020 and Forecast, 2022 to 2032

    7.1. Historical Market Value (US$ Million) Analysis, 2016 to 2021

    7.2. Current and Future Market Value (US$ Million) Projections, 2022 to 2032

        7.2.1. Y-o-Y Growth Trend Analysis

        7.2.2. Absolute $ Opportunity Analysis

8. Market Background

    8.1. Macro-Economic Factors

        8.1.1. Global Economic Outlook

        8.1.2. Global GDP Growth Outlook

        8.1.3. Global Population and Urbanization Overview

        8.1.4. Global Retail Sector Assessment

    8.2. Patent Analysis - Key Area of Innovations

    8.3. Refrigerated Display Cases Market: Value Chain Analysis

    8.4. History of Refrigerants

    8.5. Evolution of Refrigerants

    8.6. Legislation and regulations

    8.7. Revolutionizing with IoT

    8.8. Forecast Factors - Relevance & Impact

    8.9. COVID-19 Crisis - Impact Assessment

        8.9.1. Rebound Scenario - FMI Perspective

        8.9.2. Likely Rebound

    8.10. Market Dynamics

        8.10.1. Drivers

        8.10.2. Restraints

        8.10.3. Opportunity Analysis

9. Global Market Analysis 2016 to 2020 and Forecast 2022 to 2032, by Type

    9.1. Introduction / Key Findings

    9.2. Historical Market Size (US$ Million) and Volume Analysis By Type, 2016 to 2021

    9.3. Current and Future Market Size (US$ Million) and Volume Analysis and Forecast By Type, 2022 to 2032

        9.3.1. Plug-In

        9.3.2. Semi Plug-In

        9.3.3. Remote

    9.4. Market Attractiveness Analysis By Type

10. Global Market Analysis 2016 to 2020 and Forecast 2022 to 2032, by Design

    10.1. Introduction / Key Findings

    10.2. Historical Market Size (US$ Million) and Volume Analysis By Design, 2016 to 2021

    10.3. Current and Future Market Size (US$ Million) and Volume Analysis and Forecast By Design, 2022 to 2032

        10.3.1. Vertical

        10.3.2. Horizontal

        10.3.3. Hybrid

    10.4. Market Attractiveness Analysis By Design

11. Global Market Analysis 2016 to 2020 and Forecast 2022 to 2032, by Design

    11.1. Introduction / Key Findings

    11.2. Historical Market Size (US$ Million) and Volume Analysis By Design, 2016 to 2021

    11.3. Current and Future Market Size (US$ Million) and Volume Analysis and Forecast By End Use, 2022 to 2032

        11.3.1. Food Service Sector

            11.3.1.1. Quick Service Restaurants

            11.3.1.2. Bakeries

            11.3.1.3. Hotels

            11.3.1.4. Others

        11.3.2. Retail Food & Beverage Sector

            11.3.2.1. Fuel Station Stores

            11.3.2.2. Hypermarkets

            11.3.2.3. Supermarkets

            11.3.2.4. Discount Stores

    11.4. Market Attractiveness Analysis By End Use

    11.5. Market Attractiveness Analysis

12. Global Market Analysis 2016 to 2020 and Forecast 2022 to 2032, by Region

    12.1. Introduction

    12.2. Historical Market Size (US$ Million) and Volume Analysis By Region, 2016 to 2021

    12.3. Current Market Size (US$ Million) and Volume Analysis and Forecast By Region, 2022 to 2032

        12.3.1. North America

        12.3.2. Latin America

        12.3.3. Europe

        12.3.4. South Asia and Pacific

        12.3.5. East Asia

        12.3.6. Middle East and Africa

    12.4. Market Attractiveness Analysis By Region

13. North America Market Analysis 2016 to 2020 and Forecast 2022 to 2032

    13.1. Introduction

    13.2. Pricing Analysis

    13.3. Historical Market Size (US$ Million) and Volume Trend Analysis By Market Taxonomy, 2016 to 2021

    13.4. Market Size (US$ Million) and Volume Forecast By Market Taxonomy, 2022 to 2032

        13.4.1. By Type

        13.4.2. By Design

        13.4.3. By End Use

        13.4.4. By Country

            13.4.4.1. United States of America

            13.4.4.2. Canada

    13.5. Market Attractiveness Analysis

        13.5.1. By Type

        13.5.2. By Design

        13.5.3. By End Use

        13.5.4. By Country

14. Latin America Market Analysis 2016 to 2020 and Forecast 2022 to 2032

    14.1. Introduction

    14.2. Pricing Analysis

    14.3. Historical Market Size (US$ Million) and Volume Trend Analysis By Market Taxonomy, 2016 to 2021

    14.4. Market Size (US$ Million) and Volume Forecast By Market Taxonomy, 2022 to 2032

        14.4.1. By Type

        14.4.2. By Design

        14.4.3. By End Use

        14.4.4. By Country

            14.4.4.1. Brazil

            14.4.4.2. Mexico

            14.4.4.3. Rest of Latin America

    14.5. Market Attractiveness Analysis

        14.5.1. By Type

        14.5.2. By Design

        14.5.3. By End Use

        14.5.4. By Country

15. Europe Market Analysis 2016 to 2020 and Forecast 2022 to 2032

    15.1. Introduction

    15.2. Pricing Analysis

    15.3. Historical Market Size (US$ Million) and Volume Trend Analysis By Market Taxonomy, 2016 to 2021

    15.4. Market Size (US$ Million) and Volume Forecast By Market Taxonomy, 2022 to 2032

        15.4.1. By Type

        15.4.2. By Design

        15.4.3. By End Use

        15.4.4. By Country

            15.4.4.1. Germany

            15.4.4.2. Italy

            15.4.4.3. France

            15.4.4.4. United Kingdom

            15.4.4.5. Spain

            15.4.4.6. Rest of Europe

    15.5. Market Attractiveness Analysis

        15.5.1. By Type

        15.5.2. By Design

        15.5.3. By End Use

        15.5.4. By Country

16. East Asia Market Analysis 2016 to 2020 and Forecast 2022 to 2032

    16.1. Introduction

    16.2. Pricing Analysis

    16.3. Historical Market Size (US$ Million) and Volume Trend Analysis By Market Taxonomy, 2016 to 2021

    16.4. Market Size (US$ Million) and Volume Forecast By Market Taxonomy, 2022 to 2032

        16.4.1. By Type

        16.4.2. By Design

        16.4.3. By End Use

        16.4.4. By Country

            16.4.4.1. China

            16.4.4.2. Japan

            16.4.4.3. South Korea

    16.5. Market Attractiveness Analysis

        16.5.1. By Type

        16.5.2. By Design

        16.5.3. By End Use

        16.5.4. By Country

17. South Asia & Pacific Market Analysis 2016 to 2020 and Forecast 2022 to 2032

    17.1. Introduction

    17.2. Pricing Analysis

    17.3. Historical Market Size (US$ Million) and Volume Trend Analysis By Market Taxonomy, 2016 to 2021

    17.4. Market Size (US$ Million) and Volume Forecast By Market Taxonomy, 2022 to 2032

        17.4.1. By Type

        17.4.2. By Design

        17.4.3. By End Use

        17.4.4. By Country

            17.4.4.1. India

            17.4.4.2. Asian

            17.4.4.3. Oceania

            17.4.4.4. Rest of SAP

    17.5. Market Attractiveness Analysis

        17.5.1. By Type

        17.5.2. By Design

        17.5.3. By End Use

        17.5.4. By Country

18. Middle East and Africa Market Analysis 2016 to 2020 and Forecast 2020 to 2030

    18.1. Introduction

    18.2. Pricing Analysis

    18.3. Historical Market Size (US$ Million) and Volume Trend Analysis By Market Taxonomy, 2016 to 2021

    18.4. Market Size (US$ Million) and Volume Forecast By Market Taxonomy, 2022 to 2032

        18.4.1. By Type

        18.4.2. By Design

        18.4.3. By End Use

        18.4.4. By Country

            18.4.4.1. GCC Countries

            18.4.4.2. Turkey

            18.4.4.3. Northern Africa

            18.4.4.4. South Africa

            18.4.4.5. Rest of Middle East and Africa

    18.5. Market Attractiveness Analysis

        18.5.1. By Type

        18.5.2. By Design

        18.5.3. By End Use

        18.5.4. By Country

19. Key and Emerging Countries Market Analysis

    19.1. USA Market Analysis

        19.1.1. By Type

        19.1.2. By Design

        19.1.3. By End Use

    19.2. Canada Market Analysis

        19.2.1. By Type

        19.2.2. By Design

        19.2.3. By End Use

    19.3. Mexico Market Analysis

        19.3.1. By Type

        19.3.2. By Design

        19.3.3. By End Use

    19.4. Brazil Market Analysis

        19.4.1. By Type

        19.4.2. By Design

        19.4.3. By End Use

    19.5. Germany Market Analysis

        19.5.1. By Type

        19.5.2. By Design

        19.5.3. By End Use

    19.6. Italy Market Analysis

        19.6.1. By Type

        19.6.2. By Design

        19.6.3. By End Use

    19.7. France Market Analysis

        19.7.1. By Type

        19.7.2. By Design

        19.7.3. By End Use

    19.8. UK Market Analysis

        19.8.1. By Type

        19.8.2. By Design

        19.8.3. By End Use

    19.9. Spain Market Analysis

        19.9.1. By Type

        19.9.2. By Design

        19.9.3. By End Use

    19.10. China Market Analysis

        19.10.1. By Type

        19.10.2. By Design

        19.10.3. By End Use

    19.11. Japan Market Analysis

        19.11.1. By Type

        19.11.2. By Design

        19.11.3. By End Use

    19.12. S. Korea Market Analysis

        19.12.1. By Type

        19.12.2. By Design

        19.12.3. By End Use

    19.13. India Market Analysis

        19.13.1. By Type

        19.13.2. By Design

        19.13.3. By End Use

    19.14. ASEAN Market Analysis

        19.14.1. By Type

        19.14.2. By Design

        19.14.3. By End Use

    19.15. Oceania Market Analysis

        19.15.1. By Type

        19.15.2. By Design

        19.15.3. By End Use

    19.16. GCC Countries Market Analysis

        19.16.1. By Type

        19.16.2. By Design

        19.16.3. By End Use

    19.17. Turkey Market Analysis

        19.17.1. By Type

        19.17.2. By Design

        19.17.3. By End Use

    19.18. Northern Africa Market Analysis

        19.18.1. By Type

        19.18.2. By Design

        19.18.3. By End Use

    19.19. South Africa Market Analysis

        19.19.1. By Type

        19.19.2. By Design

        19.19.3. By End Use

20. Market Structure Analysis

    20.1. Key Players - Market Positioning

    20.2. Market Concentration by Leading Players

    20.3. Market Analysis by Tier of Companies

    20.4. Market Share Analysis of Top Players

21. Competition Analysis

    21.1. Competition Dashboard

    21.2. Competition Deep Dive

        21.2.1. Robert Bosch GmbH

            21.2.1.1. Overview

            21.2.1.2. Product Portfolio

            21.2.1.3. SWOT Analysis

            21.2.1.4. Strategy Overview

        21.2.2. Arneg S.p.A

            21.2.2.1. Overview

            21.2.2.2. Product Portfolio

            21.2.2.3. SWOT Analysis

            21.2.2.4. Strategy Overview

        21.2.3. Epta S.p.a. Refrigeration

            21.2.3.1. Overview

            21.2.3.2. Product Portfolio

            21.2.3.3. SWOT Analysis

            21.2.3.4. Strategy Overview

        21.2.4. Frigoglass SAIC

            21.2.4.1. Overview

            21.2.4.2. Product Portfolio

            21.2.4.3. SWOT Analysis

            21.2.4.4. Strategy Overview

        21.2.5. Dover Corporation

            21.2.5.1. Overview

            21.2.5.2. Product Portfolio

            21.2.5.3. SWOT Analysis

            21.2.5.4. Strategy Overview

        21.2.6. Haier Group

            21.2.6.1. Overview

            21.2.6.2. Product Portfolio

            21.2.6.3. SWOT Analysis

            21.2.6.4. Strategy Overview

        21.2.7. Standex International Corporation

            21.2.7.1. Overview

            21.2.7.2. Product Portfolio

            21.2.7.3. SWOT Analysis

            21.2.7.4. Strategy Overview

        21.2.8. Metalfrio Solutions, Inc

            21.2.8.1. Overview

            21.2.8.2. Product Portfolio

            21.2.8.3. SWOT Analysis

            21.2.8.4. Strategy Overview

        21.2.9. Clabo SpA

            21.2.9.1. Overview

            21.2.9.2. Product Portfolio

            21.2.9.3. SWOT Analysis

            21.2.9.4. Strategy Overview

        21.2.10. True Manufacturing Co., Inc.

            21.2.10.1. Overview

            21.2.10.2. Product Portfolio

            21.2.10.3. SWOT Analysis

            21.2.10.4. Strategy Overview

        21.2.11. Carter Retail Equipment Ltd.

            21.2.11.1. Overview

            21.2.11.2. Product Portfolio

            21.2.11.3. SWOT Analysis

            21.2.11.4. Strategy Overview

        21.2.12. QBD Modular Systems Inc

            21.2.12.1. Overview

            21.2.12.2. Product Portfolio

            21.2.12.3. SWOT Analysis

            21.2.12.4. Strategy Overview

        21.2.13. Zero Zone Inc.

            21.2.13.1. Overview

            21.2.13.2. Product Portfolio

            21.2.13.3. SWOT Analysis

            21.2.13.4. Strategy Overview

        21.2.14. Igloo International.

            21.2.14.1. Overview

            21.2.14.2. Product Portfolio

            21.2.14.3. SWOT Analysis

            21.2.14.4. Strategy Overview

        21.2.15. Marc Refrigeration Manufacturing Inc.

            21.2.15.1. Overview

            21.2.15.2. Product Portfolio

            21.2.15.3. SWOT Analysis

            21.2.15.4. Strategy Overview

        21.2.16. Aucma Co., Ltd.

            21.2.16.1. Overview

            21.2.16.2. Product Portfolio

            21.2.16.3. SWOT Analysis

            21.2.16.4. Strategy Overview

        21.2.17. Isa S.p.a

            21.2.17.1. Overview

            21.2.17.2. Product Portfolio

            21.2.17.3. SWOT Analysis

            21.2.17.4. Strategy Overview

        21.2.18. Borgen Systems

            21.2.18.1. Overview

            21.2.18.2. Product Portfolio

            21.2.18.3. SWOT Analysis

            21.2.18.4. Strategy Overview

        21.2.19. Koxka

            21.2.19.1. Overview

            21.2.19.2. Product Portfolio

            21.2.19.3. SWOT Analysis

            21.2.19.4. Strategy Overview

        21.2.20. Nakano Refrigerators Co. Ltd

            21.2.20.1. Overview

            21.2.20.2. Product Portfolio

            21.2.20.3. SWOT Analysis

            21.2.20.4. Strategy Overview

        21.2.21. Foster Refrigerators Enterprise, Inc.

            21.2.21.1. Overview

            21.2.21.2. Product Portfolio

            21.2.21.3. SWOT Analysis

            21.2.21.4. Strategy Overview

22. Assumptions and Acronyms Used

23. Research Methodology

Don't pay for what you don't need

Customize your report by selecting specific countries or regions and save 30%!

List of Tables

Table 01: Global Market Value (US$ Million) and Volume Historical Data 2016 to 2021 and Forecast 2022 to 2032 by Product Type

Table 02: Global Market Value (US$ Million) and Volume Historical Data 2016 to 2021 and Forecast 2022 to 2032 by Design

Table 03: Global Market Value (US$ Million) and Volume Historical Data 2016 to 2021 and Forecast 2022 to 2032 by End Use

Table 04: Global Market Value (US$ Million) and Volume Historical Data 2016 to 2021 and Forecast 2022 to 2032 by End Use

Table 05: Global Market Size (US$ Million) and Volume Forecast by Region, 2013 to 2028

Table 06: North America Market Value (US$ Million) and Volume Historical Data 2016 to 2021 and Forecast 2022 to 2032 by Product Type

Table 07: North America Market Value (US$ Million) and Volume Historical Data 2016 to 2021 and Forecast 2022 to 2032 by Design

Table 08: North America Market Value (US$ Million) and Volume Historical Data 2016 to 2021 and Forecast 2022 to 2032 by End Use

Table 09: North America Market Value (US$ Million) and Volume Historical Data 2016 to 2021 and Forecast 2022 to 2032 by End Use

Table 10: North America Market Size (US$ Million) and Volume Forecast by Region, 2013 to 2028

Table 11: Latin America Market Value (US$ Million) and Volume Historical Data 2016 to 2021 and Forecast 2022 to 2032 by Product Type

Table 12: Latin America Market Value (US$ Million) and Volume Historical Data 2016 to 2021 and Forecast 2022 to 2032 by Design

Table 13: Latin America Market Value (US$ Million) and Volume Historical Data 2016 to 2021 and Forecast 2022 to 2032 by End Use

Table 14: Latin America Market Value (US$ Million) and Volume Historical Data 2016 to 2021 and Forecast 2022 to 2032 by End Use

Table 15: Latin America Market Size (US$ Million) and Volume Forecast by Region, 2013 to 2028

Table 16: Europe Market Value (US$ Million) and Volume Historical Data 2016 to 2021 and Forecast 2022 to 2032 by Product Type

Table 17: Europe Market Value (US$ Million) and Volume Historical Data 2016 to 2021 and Forecast 2022 to 2032 by Design

Table 18: Europe Market Value (US$ Million) and Volume Historical Data 2016 to 2021 and Forecast 2022 to 2032 by End Use

Table 19: Europe Market Value (US$ Million) and Volume Historical Data 2016 to 2021 and Forecast 2022 to 2032 by End Use

Table 20: Europe Market Size (US$ Million) and Volume Forecast by Region, 2013 to 2028

Table 21: East Asia Market Value (US$ Million) and Volume Historical Data 2016 to 2021 and Forecast 2022 to 2032 by Product Type

Table 22: East Asia Market Value (US$ Million) and Volume Historical Data 2016 to 2021 and Forecast 2022 to 2032 by Design

Table 23: East Asia Market Value (US$ Million) and Volume Historical Data 2016 to 2021 and Forecast 2022 to 2032 by End Use

Table 24: East Asia Market Value (US$ Million) and Volume Historical Data 2016 to 2021 and Forecast 2022 to 2032 by End Use

Table 25: East Asia Market Size (US$ Million) and Volume Forecast by Region, 2013 to 2028

Table 26: South Asia & Pacific Market Value (US$ Million) and Volume Historical Data 2016 to 2021 and Forecast 2022 to 2032 by Product Type

Table 27: South Asia & Pacific Market Value (US$ Million) and Volume Historical Data 2016 to 2021 and Forecast 2022 to 2032 by Design

Table 28: South Asia & Pacific Market Value (US$ Million) and Volume Historical Data 2016 to 2021 and Forecast 2022 to 2032 by End Use

Table 29: South Asia & Pacific Market Value (US$ Million) and Volume Historical Data 2016 to 2021 and Forecast 2022 to 2032 by End Use

Table 30: South Asia & Pacific Market Size (US$ Million) and Volume Forecast by Region, 2013 to 2028

Table 31: Middle East and Africa Market Value (US$ Million) and Volume Historical Data 2016 to 2021 and Forecast 2022 to 2032 by Product Type

Table 32: Middle East and Africa Market Value (US$ Million) and Volume Historical Data 2016 to 2021 and Forecast 2022 to 2032 by Design

Table 33: Middle East and Africa Market Value (US$ Million) and Volume Historical Data 2016 to 2021 and Forecast 2022 to 2032 by End Use

Table 34: Middle East and Africa Market Value (US$ Million) and Volume Historical Data 2016 to 2021 and Forecast 2022 to 2032 by End Use

Table 35: Middle East and Africa Market Size (US$ Million) and Volume Forecast by Region, 2016 to 2020
Nikhil Kaitwade
Nikhil Kaitwade
Principal Consultant
LinkedIn
Talk to Analyst

Find your sweet spots for generating winning opportunities in this market.

List of Charts

Figure 01: Global Market Volume (Units) and Y-o-Y Growth Rate From 2021 to 2031

Figure 02: Global Market Value (US$ Million) and Y-o-Y Growth Rate From 2021 to 2031

Figure 03: Global Market Absolute $ Opportunity Analysis, 2020 to 2031

Figure 04: Global Market Share and BPS Analysis by Type 2021 & 2031

Figure 05: Global Market Y-o-Y Growth Projections by Type, 2020 to 2031

Figure 06: Global Market Attractiveness by Type, 2021 to 2031

Figure 07: Global Market Absolute $ Opportunity by Plug-In Segment

Figure 08: Global Market Absolute $ Opportunity by Semi-Plug-In Segment

Figure 09: Global Market Absolute $ Opportunity by Atmospheric Vacuum Breaker Segment

Figure 10: Global Market Share and BPS Analysis by Design 2021 & 2031

Figure 11: Global Market Y-o-Y Growth Projections by Design, 2020 to 2031

Figure 12: Global Market Attractiveness by Design, 2021 to 2031

Figure 13: Global Market Absolute $ Opportunity by Vertical Segment

Figure 14: Global Market Absolute $ Opportunity by Horizontal Segment

Figure 15: Global Market Absolute $ Opportunity by Hybrid Segment

Figure 16: Global Market Share and BPS Analysis by End Use 2021 & 2031

Figure 17: Global Market Y-o-Y Growth Projections by End Use, 2020 to 2031

Figure 18: Global Market Attractiveness by End Use,

Figure 19: Global Market Absolute $ Opportunity by Food Service Sector Segment

Figure 20: Global Market Absolute $ Opportunity by Retail Food & Beverage Sector Segment

Figure 21: Global Market Share and BPS Analysis by Region

Figure 22: Global Market Y-o-Y Growth Projections by Region, 2020 to 2031

Figure 23: Global Market Attractiveness Analysis by Region, 2021 to 2031

Figure 24: Global Market Absolute $ Opportunity by North America, 2016 to 2022 and 2032

Figure 25: Global Market Absolute $ Opportunity by Latin America, 2016 to 2022 and 2032

Figure 26: Global Market Absolute $ Opportunity by Europe, 2016 to 2022 and 2032

Figure 27: Global Market Absolute $ Opportunity by East Asia, 2016 to 2022 and 2032

Figure 28: Global Market Absolute $ Opportunity by South Asia & Pacific & Pacific, 2016 to 2022 and 2032

Figure 29: Global Market Absolute $ Opportunity by Middle East and Africa, 2016 to 2022 and 2032

Figure 30: North America Market Share and BPS Analysis by Type 2021 & 2031

Figure 31: North America Market Y-o-Y Growth Projections by Type, 2020 to 2031

Figure 32: North America Market Attractiveness by Type, 2021 to 2031

Figure 33: North America Market Share and BPS Analysis by Design 2021 & 2031

Figure 34: North America Market Y-o-Y Growth Projections by Design, 2020 to 2031

Figure 35: North America Market Attractiveness by Design, 2021 to 2031

Figure 36: North America Market Share and BPS Analysis by End Use 2021 & 2031

Figure 37: North America Market Y-o-Y Growth Projections by End Use, 2020 to 2031

Figure 38: North America Market Attractiveness by End Use,

Figure 39: North America Market Share and BPS Analysis by Region

Figure 40: North America Market Y-o-Y Growth Projections by Region, 2020 to 2031

Figure 41: North America Market Attractiveness Analysis by Region, 2021 to 2031

Figure 42: North America Market Absolute $ Opportunity by US, 2016 to 2022 and 2032

Figure 43: North America Market Absolute $ Opportunity by Latin America, 2016 to 2022 and 2032

Figure 44: Latin America Market Share and BPS Analysis by Type 2021 & 2031

Figure 45: Latin America Market Y-o-Y Growth Projections by Type, 2020 to 2031

Figure 46: Latin America Market Attractiveness by Type, 2021 to 2031

Figure 47: Latin America Market Share and BPS Analysis by Design 2021 & 2031

Figure 48: Latin America Market Y-o-Y Growth Projections by Design, 2020 to 2031

Figure 49: Latin America Market Attractiveness by Design, 2021 to 2031

Figure 50: Latin America Market Share and BPS Analysis by End Use 2021 & 2031

Figure 51: Latin America Market Y-o-Y Growth Projections by End Use, 2020 to 2031

Figure 52: Latin America Market Attractiveness by End Use,

Figure 53: Latin America Market Share and BPS Analysis by Region

Figure 54: Latin America Market Y-o-Y Growth Projections by Region, 2020 to 2031

Figure 55: Latin America Market Attractiveness Analysis by Region, 2021 to 2031

Figure 56: Latin America Market Absolute $ Opportunity by Germany, 2016 to 2022 and 2032

Figure 57: Latin America Market Absolute $ Opportunity by Italy, 2016 to 2022 and 2032

Figure 58: Latin America Market Absolute $ Opportunity by Rest of LA, 2016 to 2022 and 2032

Figure 59: Europe Market Share and BPS Analysis by Type 2021 & 2031

Figure 60: Europe Market Y-o-Y Growth Projections by Type, 2020 to 2031

Figure 61: Europe Market Attractiveness by Type, 2021 to 2031

Figure 62: Europe Market Share and BPS Analysis by Design 2021 & 2031

Figure 63: Europe Market Y-o-Y Growth Projections by Design, 2020 to 2031

Figure 64: Europe Market Attractiveness by Design, 2021 to 2031

Figure 65: Europe Market Share and BPS Analysis by End Use 2021 & 2031

Figure 66: Europe Market Y-o-Y Growth Projections by End Use, 2020 to 2031

Figure 67: Europe Market Attractiveness by End Use,

Figure 68: Europe Market Share and BPS Analysis by Region

Figure 69: Europe Market Y-o-Y Growth Projections by Region, 2020 to 2031

Figure 70: Europe Market Attractiveness Analysis by Region, 2021 to 2031

Figure 71: Europe Market Absolute $ Opportunity by Germany, 2016 to 2022 and 2032

Figure 72: Europe Market Absolute $ Opportunity by Italy, 2016 to 2022 and 2032

Figure 73: Europe Market Absolute $ Opportunity by France, 2016 to 2022 and 2032

Figure 74: Europe Market Absolute $ Opportunity by UK, 2016 to 2022 and 2032

Figure 75: Europe Market Absolute $ Opportunity by Spain, 2016 to 2022 and 2032

Figure 76: Europe Market Absolute $ Opportunity by Rest of Europe, 2016 to 2022 and 2032

Figure 77: East Asia Market Share and BPS Analysis by Type 2021 & 2031

Figure 78: East Asia Market Y-o-Y Growth Projections by Type, 2020 to 2031

Figure 79: East Asia Market Attractiveness by Type, 2021 to 2031

Figure 80: East Asia Market Share and BPS Analysis by Design 2021 & 2031

Figure 81: East Asia Market Y-o-Y Growth Projections by Design, 2020 to 2031

Figure 82: East Asia Market Attractiveness by Design, 2021 to 2031

Figure 83: East Asia Market Share and BPS Analysis by End Use 2021 & 2031

Figure 84: East Asia Market Y-o-Y Growth Projections by End Use, 2020 to 2031

Figure 85: East Asia Market Attractiveness by End Use,

Figure 86: East Asia Market Share and BPS Analysis by Region

Figure 87: East Asia Market Y-o-Y Growth Projections by Region, 2020 to 2031

Figure 88: East Asia Market Attractiveness Analysis by Region, 2021 to 2031

Figure 89: East Asia Market Absolute $ Opportunity by China, 2016 to 2022 and 2032

Figure 90: East Asia Market Absolute $ Opportunity by Japan, 2016 to 2022 and 2032

Figure 91: East Asia Market Absolute $ Opportunity by Japan, 2016 to 2022 and 2032

Figure 92: South Asia & Pacific Market Share and BPS Analysis by Type 2021 & 2031

Figure 93: South Asia & Pacific Market Y-o-Y Growth Projections by Type, 2020 to 2031

Figure 94: South Asia & Pacific Market Attractiveness by Type, 2021 to 2031

Figure 95: South Asia & Pacific Market Share and BPS Analysis by Design 2021 & 2031

Figure 96: South Asia & Pacific Market Y-o-Y Growth Projections by Design, 2020 to 2031

Figure 97: South Asia & Pacific Market Attractiveness by Design, 2021 to 2031

Figure 98: South Asia & Pacific Market Share and BPS Analysis by End Use 2021 & 2031

Figure 99: South Asia & Pacific Market Y-o-Y Growth Projections by End Use, 2020 to 2031

Figure 100: South Asia & Pacific Market Attractiveness by End Use, 2021 to 2031

Figure 101: South Asia & Pacific Market Share and BPS Analysis by Region, 2021 & 2031

Figure 102: South Asia & Pacific Market Y-o-Y Growth Projections by Region, 2020 to 2031

Figure 103: South Asia & Pacific Market Attractiveness Analysis by Region, 2021 to 2031

Figure 104: South Asia & Pacific Market Absolute $ Opportunity by India, 2016 to 2022 and 2032

Figure 105: South Asia & Pacific Market Absolute $ Opportunity by ASEAN, 2016 to 2022 and 2032

Figure 106: South Asia & Pacific Market Absolute $ Opportunity by Oceania, 2016 to 2022 and 2032

Figure 107: South Asia & Pacific Market Absolute $ Opportunity by Rest of SAP, 2016 to 2022 and 2032

Figure 108: Middle East and Africa Market Share and BPS Analysis by Type 2021 & 2031

Figure 109: Middle East and Africa Market Y-o-Y Growth Projections by Type, 2020 to 2031

Figure 110: Middle East and Africa Market Attractiveness by Type, 2021 to 2031

Figure 111: Middle East and Africa Market Share and BPS Analysis by Design 2021 & 2031

Figure 112: Middle East and Africa Market Y-o-Y Growth Projections by Design, 2020 to 2031

Figure 113: Middle East and Africa Market Attractiveness by Design, 2021 to 2031

Figure 114: Middle East and Africa Market Share and BPS Analysis by End Use 2021 & 2031

Figure 115: Middle East and Africa Market Y-o-Y Growth Projections by End Use, 2020 to 2031

Figure 116: Middle East and Africa Market Attractiveness by End Use,

Figure 117: Middle East and Africa Market Share and BPS Analysis by Region

Figure 118: Middle East and Africa Market Y-o-Y Growth Projections by Region, 2020 to 2031

Figure 119: Middle East and Africa Market Attractiveness Analysis by Region, 2021 to 2031

Figure 120: Middle East and Africa Market Absolute $ Opportunity by GCC Countries, 2016 to 2022 and 2032

Figure 121: Middle East and Africa Market Absolute $ Opportunity by Turkey, 2016 to 2022 and 2032

Figure 122: Middle East and Africa Market Absolute $ Opportunity by South Africa, 2016 to 2022 and 2032

Figure 123: Middle East and Africa Market Absolute $ Opportunity by Rest of Northern Africa, 2016 to 2022 and 2032

Figure 124: Middle East and Africa Market Absolute $ Opportunity by Rest of Middle East and Africa, 2016 to 2022 and 2032

Recommendations

Technology

Flat Panel Display Market

Published : May 2023

Technology

Head Mounted Display Market

Published : March 2023

Technology

Head-Up Display Market

Published : December 2022

Explore Industrial Automation Insights

View Reports

Refrigerated Display Cases Market

We value your privacy

We use cookies to enhance your browsing experience, serve personalized ads or content, and analyze our traffic.

By clicking "Accept All", you consent to our use of cookies. Cookie Policy