LED Displays, Lighting and Fixtures Market
LED Displays, Lighting and Fixtures Market By Product, Application & Region | Forecast 2022 to 2032
Explore with FMI How Escalating Need for Energy Conservation is Encouraging Adoption of LED Displays, Lighting, and Fixtures across the United Kingdom, Korea, Italy, Japan, the USA, and 30+ Countries!
LED Displays, Lighting and Fixtures Market Outlook (2022 to 2032)
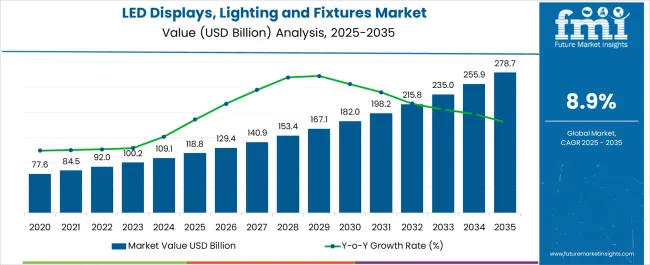
Global sales of LED displays, lighting and fixtures totaled US$ 82.4 billion in 2021. Overall LED displays, lighting and fixtures demand will rise at 8.9% CAGR from 2022 to 2032. The global market size will increase from US$ 92.0 billion in 2022 to US$ 215 billion by 2032.
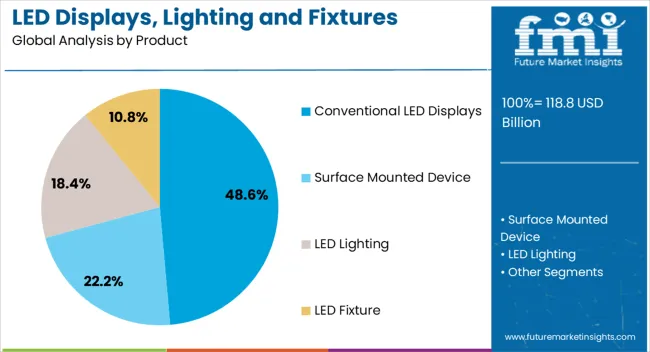
Surface-mounted device segment will generate significant revenues throughout the forecast period. A CAGR of 8.8% has been predicted by Future Market Insights for this segment.
Key Growth Shaping Factors:
- Growing usage of LED products across a wide range of applications is driving the global market
- Escalating need for energy conservation will elevate LED display, lighting, and fixture demand
- Rising usage of LED lighting in residential sector will boost sales
- Increasing demand for LED displays, particularly in outdoor advertisements is likely to boost the market
- Introduction of new government laws and regulations to reduce usage of inefficient lighting systems will create growth prospects
- Growing popularity of green buildings coupled with rising demand for sustainable lighting will foster market development
- Transition towards energy-efficient lighting solutions will trigger sales
- High usage of OLED displays in various applications will support market development
A semiconductor device that emits light when current flows through it is called a light emitting diode (LED). These LEDs are being increasingly used in displays, lighting, fixtures, and other devices. This is due to their various advantages over conventional light sources.
Few advantages of LEDs include
- Lower power consumption
- Improved physical robustness
- Compact size
- Faster switching
- Longer lifetime
In recent years, LED displays, lighting, and fixtures have gained wider popularity globally. This is due to their energy-efficient nature. These LED products allow users to significantly reduce energy consumption and save electricity bills.
Increasing adoption of LED products in applications such as automotive lighting, display panel, commercial lighting, etc will boost the global LED displays, lighting and fixture market. They also find application in general lighting, traffic signals, advertising illuminated wallpapers, and medical devices.
Growing awareness about energy conservation is likely to play a key role in encouraging the adoption of LED displays, lighting, and fixtures.
LED lighting and fixtures consume very less energy as compared to other conventional light sources. As a result, these efficient lighting solutions are becoming an ideal choice for sustainable architecture.
LED lamps are rapidly replacing less effective sources such as CFLs and incandescent lamps. This is due to their ability to reduce electrical energy consumption and its associated emissions. They also reduce demand for air conditioning systems.
Rising usage of LED signage for advertising and marketing purposes will further elevate demand in the market. Besides this, rising government initiatives and investments in installing LED street lighting fixtures will boost LED lighting and fixture sales.
Attributes |
Key Insights |
LED Displays, Lighting and Fixtures Market Size in 2022 |
US$ 92 billion |
Projected Market Value in 2032 |
US$ 215 billion |
Value-based CAGR (2022 to 2032) |
8.9% |
USA Market CAGR (2022 to 2032) |
7.7 % |
Don't pay for what you don't need
Customize your report by selecting specific countries or regions and save 30%!
2017 to 2021 LED Displays, Lighting, and Fixtures Sales Outlook Compared to Demand Forecast from 2022 to 2032
Global LED displays, lighting, and fixture sales increased at 12% CAGR during the period from 2017 to 2021. For the next ten years, the worldwide market will exhibit a CAGR of 8.9%. It will create an absolute $ opportunity of US$ 123 billion during the forecast period.
Energy efficiency is one of the main factors contributing to the expansion of the market for LED displays, lighting, and fixtures.
Compared to conventional lighting sources such as incandescent bulbs and fluorescent lights, LED technology is more energy-efficient, which lowers energy consumption and reduces energy costs.
Cost-effectiveness is another important factor impacting market development. Although LED lighting fixtures may cost more than conventional lighting sources, they last longer and need less maintenance, which results in long-term cost savings.
The rapid population growth is likely to expand real estate markets across the world. This expansion in real estate will increase the demand for lighting systems, and today's homeowners and builders favor LED lighting over incandescent lighting.
The real estate industry is expected to rise and play an important role in the United Nations’ (UN) sustainable development goals (SDGs). Because of the projected growth in the real estate sector, the market for LED displays, lighting and fixtures is projected to expand during the assessment period.
According to the United Nations, the population of the world will increase to around 8.7 billion by 2033. This rapid growth in the population will propel LED displays, lighting and fixture demand during the assessment period.
Automakers are also implementing LED lighting and displays in their cars. This is because they are much brighter than their halogen counterparts and can also improve visibility in the dark drastically.
LED Lamps are much more durable than traditional headlamps and can last longer than traditional halogen lamps. Therefore, rising production and sales of vehicles will fuel expansion of LED displays, lighting and fixtures industry.
Why is North America Emerging as a Lucrative Market for LED Displays, Lighting, and Fixtures?
North America LED displays, lighting, and fixtures market size reached US$ 35 billion in 2022. Between 2022 and 2032, LED displays, lighting, and fixture sales in North America will rise at a robust pace. By 2032, North America market will reach a valuation of US$ 83 billion.
North America is a significant consumer of energy in the world with primary energy consumption of 113 exajoules in 2021. With the rise in energy consumption and energy costs in the region, people are implementing LED lighting. This is spurring growth in the market.
Similarly, rising usage in automobiles is creating opportunities for LED displays, lighting and fixture manufacturers. There were around 34 million cars sold in North America in 2021.
As LED is widely utilized in the automobile industry for the lighting needs of the car, rising demand for cars in the region will trigger LED lighting sales.
Comparative Analysis of Adjacent Markets
LED Lights Market:
Differentiating Aspects |
LED Lights Market |
CAGR for 2022 to 2032 |
14% |
Market Valuation in 2022 |
76.0 billion |
Demand Drivers |
|
LED Modules and Light Engines Market:
Differentiating Aspects |
LED Modules and Light Engines Market |
CAGR for 2022 to 2032 |
11.2% |
Market Valuation in 2022 |
US$ 39,876.4 million |
Demand Drivers |
|
Country-wise Insights
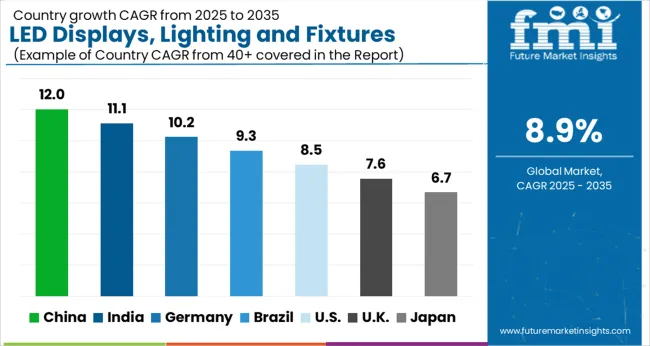
Countries | United States |
Projected CAGR (2022 to 2032) | 7.7% |
Historical CAGR (2017 to 2021) | 10.5% |
Market Value (2032) | US$ 65.4 billion |
Countries | United Kingdom |
Projected CAGR (2022 to 2032) | 8.0% |
Historical CAGR (2017 to 2021) | 10.8% |
Market Value (2032) | US$ 11.1 billion |
Countries | China |
Projected CAGR (2022 to 2032) | 9.9% |
Historical CAGR (2017 to 2021) | 13.6% |
Market Value (2032) | US$ 18.6 billion |
Countries | Japan |
Projected CAGR (2022 to 2032) | 8.3% |
Historical CAGR (2017 to 2021) | 11.2% |
Market Value (2032) | US$ 15.7 billion |
Countries | South Korea |
Projected CAGR (2022 to 2032) | 9.3% |
Historical CAGR (2017 to 2021) | 12.8% |
Market Value (2032) | US$ 8.8 billion |
What is Driving Sales of LED Displays, Lighting, and Fixtures in the United States?
High Usage in Automotive Sector Fueling LED Displays and Lighting Demand in the USA
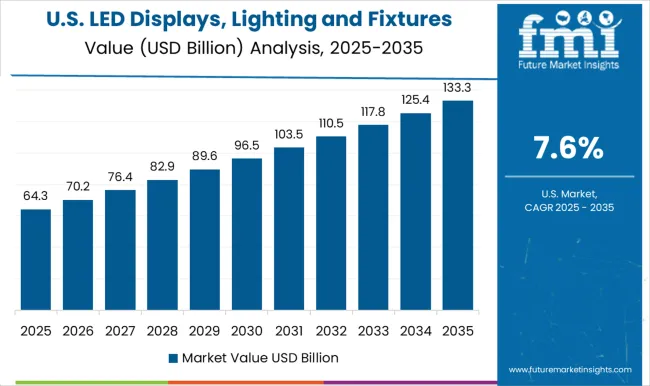
The United States LED displays, lighting and fixtures market will cross US$ 65.4 billion mark in 2032. From 2017 to 2021, LED displays, lighting, and fixture sales in the USA grew at 10.5% CAGR.
As per the report, the USA market will exhibit a growth rate of 7.7% CAGR between 2022 and 2032. Rising demand for LED displays, lighting, and fixtures from thriving automotive industry will boost the USA market.
In 2020, the United States produced around 8.8 million cars which increased to about 9.1 million in 2021. LED lighting is widely utilized in automobile lighting because of its durability and longer lifespan than its halogen counterparts.
LED lights also provide brighter illumination that can provide better visibility during the night. Therefore, the rising demand for automobiles will elevate the demand for LED lights in the country.
Similarly, rising usage of LED signage for marketing and advertising purposes will boost sales in the United States.
What is the Demand Outlook for the United Kingdom LED Displays, Lighting and Fixtures Market?
Increasing Government Initiatives to Encourage Adoption of LED Lighting Will Boost Sales in the United Kingdom
The United Kingdom market is projected to exhibit a CAGR of 8.0% from 2022 to 2032. It will generate an absolute $ opportunity of US$ 5.9 billion over the next ten years. By 2032, the United Kingdom market will reach around US$ 11.1 billion.
Changing preference towards energy-efficient lighting solutions is a key factor driving the United Kingdom market. Besides this, rising government support will boost LED display, lighting, and fixture sales.
About 6.5 million lighting columns are currently installed in the United Kingdom. As LEDs are more durable than halogens and consume less energy than halogen bulbs, the government has started phasing out halogen bulbs from the country to meet its sustainable development goals.
With the implementation of LED lights all across the country, demand for LED lights is projected to expand. This in turn will boost the United Kingdom LED displays, lighting and fixtures market through 2032.
Get the data you need at a Fraction of the cost
Personalize your report by choosing insights you need
and save 40%!
Category-wise Insights
Which is the Top Selling Product in the Market?
Surface Mounted Device Will Remain the Top Selling Category
Based on product, demand remains high for surface mounted device LEDs globally. The target segment grew at a CAGR of 11.5% from 2017 to 2021. Over the next decade, it will exhibit a CAGR of 8.8%.
Surface-mounted devices are generally used for the creation of the individual pixels that make up the display. These pixels can be arranged in different configurations to create various types of displays such as outdoor billboards, and indoor signs.
Surface mounted devices can allow for high-resolution displays with excellent color accuracy and brightness. Rising usage of outdoor billboards is likely to increase demand for surface mounted devices. Therefore, the market for this segment is set to expand during the assessment period.
Which is the Most Remunerative Application of LED Displays, Lighting, and Fixtures?
LED Street Lighting Fixture to Create Lucrative Revenues for the Market
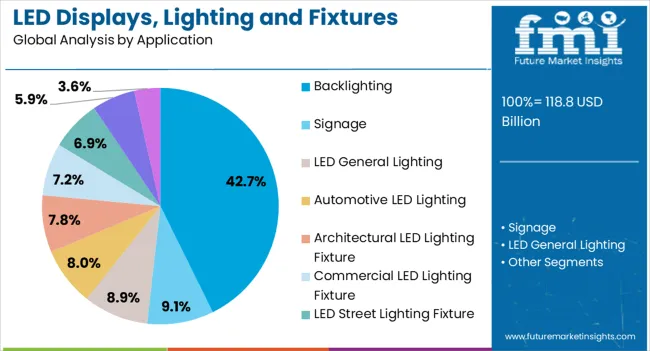
As per Future Market Insights, LED street lighting fixtures will remain the most lucrative applications. This is due to rising adoption of LED street lighting fixtures globally. From 2017 to 2021, LED street lighting fixture segment registered a CAGR of 11.0%. Between 2022 and 2032, it is likely to rise at 8.7% CAGR.
LED street lighting has gained popularity in recent years due to its numerous benefits over traditional street lighting systems such as sodium lamps and metal halide lamps.
LED street lighting is more energy efficient and can save around 50% to 70% of energy. LED lamps also have a longer lifespan of around 50,000 hours, resulting in reduced maintenance costs. They also produce better lighting than their traditional counterparts.
Amid rising trend of energy conservation, energy-efficient lighting such as LEDs is being implemented to cut down energy costs. With the rapid phasing out of halogen bulbs across various countries, demand for LED street lighting systems will expand at a robust pace.
Competitive Landscape
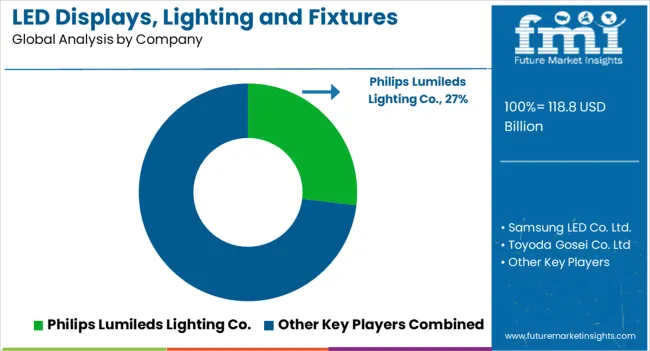
Philips Lumileds Lighting Co., Samsung LED Co. Ltd., Toyoda Gosei Co. Ltd, Seoul Semiconductor Co. Ltd, LG Innotek Co. Ltd., Barco NV, Brodwax Lighting, Cooper Lighting, LLC, SMART Global Holdings, and Epistar Corp are leading manufacturers of LED displays, lighting, and fixtures.
New product launches remain the go-to strategy of these key players. Besides this, they are also adopting other strategies such as partnerships, mergers, collaborations, and acquisitions.
Recent Developments:
In March 2022, Philips Lumileds Lighting Co. launched Philips Ultinon Pro6001. This new product will provide better automotive lighting solutions for clear visibility. The Ultinon pro 6001 was certified by the French authorities allowing French drivers to legally upgrade from traditional halogen lamps.
In February 2022, Fluence launched its new intercanopy lighting solution VYNE. Vyne can be extremely beneficial in indoor farming such as greenhouses. This new solution is equipped with multiple spectral options that can enable farmers to balance light efficiency and crop quality.
In June 2019, Samsung launched its new line of QLED 8K Signage displays globally. The newly launched display has a significant improvement in resolution than the previous models. It also has an AI upscaling technology through which content can be produced in lower resolution but still will be displayed in 8K resolution. This launch expands the product portfolio of the company significantly
Scope of the Report
Attribute |
Details |
Current Market Size (2022) |
US$ 92.0 billion |
Projected Market Size (2032) |
US$ 215.0 billion |
Anticipated Growth Rate (2022 to 2032) |
8.9% CAGR |
Forecast Period |
2022 to 2032 |
Historical Data Available for |
2017 to 2021 |
Market Analysis |
US$ Million for Value and MT for Volume |
Key Regions Covered |
North America, Latin America, Europe, Asia Pacific, and the Middle East & Africa |
Key Countries Covered |
United States, Canada, Brazil, Mexico, Germany, United Kingdom, France, Italy, Spain, Nordic, Russia, Poland, China, India, Thailand, Indonesia, Australia and New Zealand, Japan, GCC countries, North Africa, South Africa, and others. |
Key Segments Covered |
Product, Application, and Region |
Key Companies Profiled |
|
Report Coverage |
Market Forecast, Company Share Analysis, Competition Intelligence, Drivers Restraints Opportunity Trends Analysis, Market Dynamics and Challenges, and Strategic Growth Initiatives |
Global LED Displays, Lighting and Fixtures Segmentation Market
By Product:
- Conventional LED Displays
- Surface Mounted Device
- LED Lighting
- LED Fixture
By Application:
- Backlighting
- Signage
- LED General Lighting
- Automotive LED Lighting
- Architectural LED Lighting Fixture
- Commercial LED Lighting Fixture
- LED Street Lighting Fixture
- Retail and Refrigerator LED Lighting Fixture
- Residential LED Lighting Fixture
By Region:
- North America
- Latin America
- Europe
- Asia Pacific
- Middle East and Africa
Frequently Asked Questions
Where is the higher demand for LED Displays, Lighting and Fixtures Market?
The Asia Pacific region generated 40% of the global demand for LED Displays, Lighting and Fixtures in 2022.
Which regional market will witness higher growth?
The Asia Pacific market is projected to grow at a CAGR of 8.9% through 2033.
Which is the preferred material for making LED Displays, Lighting and Fixtures?
Aluminum is the preferred material for making LED Displays, Lighting and Fixtures, accounting for 25% of total production.
Which product type is in higher demand?
Indoor LED Displays segment holds 55% of the global market share.
How the LED Displays, Lighting and Fixtures market grew historically?
From 2018 to 2022, the global market exhibited a CAGR of 12%.
Table of Content
1. Executive Summary | LED Displays, Lighting and Fixtures Market 1.1. Global Market Outlook 1.2. Demand-side Trends 1.3. Supply-side Trends 1.4. Technology Roadmap Analysis 1.5. Analysis and Recommendations 2. Market Overview 2.1. Market Coverage / Taxonomy 2.2. Market Definition / Scope / Limitations 3. Market Background 3.1. Market Dynamics 3.1.1. Drivers 3.1.2. Restraints 3.1.3. Opportunity 3.1.4. Trends 3.2. Scenario Forecast 3.2.1. Demand in Optimistic Scenario 3.2.2. Demand in Likely Scenario 3.2.3. Demand in Conservative Scenario 3.3. Opportunity Map Analysis 3.4. Product Life Cycle Analysis 3.5. Supply Chain Analysis 3.5.1. Supply Side Participants and their Roles 3.5.1.1. Producers 3.5.1.2. Mid-Level Participants (Traders/ Agents/ Brokers) 3.5.1.3. Wholesalers and Distributors 3.5.2. Value Added and Value Created at Node in the Supply Chain 3.5.3. List of Raw Material Suppliers 3.5.4. List of Existing and Potential Buyer’s 3.6. Investment Feasibility Matrix 3.7. Value Chain Analysis 3.7.1. Profit Margin Analysis 3.7.2. Wholesalers and Distributors 3.7.3. Retailers 3.8. PESTLE and Porter’s Analysis 3.9. Regulatory Landscape 3.9.1. By Key Regions 3.9.2. By Key Countries 3.10. Regional Parent Market Outlook 3.11. Production and Consumption Statistics 3.12. Import and Export Statistics 4. Global Market Analysis 2017 to 2021 and Forecast, 2022 to 2032 4.1. Historical Market Size Value (US$ Million) & Volume (Units) Analysis, 2017 to 2021 4.2. Current and Future Market Size Value (US$ Million) & Volume (Units) Projections, 2022 to 2032 4.2.1. Y-o-Y Growth Trend Analysis 4.2.2. Absolute $ Opportunity Analysis 5. Global Market Analysis 2017 to 2021 and Forecast 2022 to 2032, By Product 5.1. Introduction / Key Findings 5.2. Historical Market Size Value (US$ Million) & Volume (Units) Analysis By Product, 2017 to 2021 5.3. Current and Future Market Size Value (US$ Million) & Volume (Units) Analysis and Forecast By Product, 2022 to 2032 5.3.1. Conventional LED Display 5.3.2. Surface Mounted Device 5.3.3. LED Lighting 5.3.4. LED Fixture 5.4. Y-o-Y Growth Trend Analysis By Product, 2017 to 2021 5.5. Absolute $ Opportunity Analysis By Product, 2022 to 2032 6. Global Market Analysis 2017 to 2021 and Forecast 2022 to 2032, By Application 6.1. Introduction / Key Findings 6.2. Historical Market Size Value (US$ Million) & Volume (Units) Analysis By Application, 2017 to 2021 6.3. Current and Future Market Size Value (US$ Million) & Volume (Units) Analysis and Forecast By Application, 2022 to 2032 6.3.1. Backlighting 6.3.2. Signage 6.3.3. LED General Lighting Market 6.3.4. Automotive LED Lighting 6.3.5. Architectural LED Lighting Fixture 6.3.6. Commercial LED Lighting Fixture 6.3.7. LED Street Lighting Fixture 6.3.8. Retail & Refrigerator LED Lighting Fixture 6.3.9. Residential LED Lighting Fixture 6.3.10. Other 6.4. Y-o-Y Growth Trend Analysis By Application, 2017 to 2021 6.5. Absolute $ Opportunity Analysis By Application, 2022 to 2032 7. Global Market Analysis 2017 to 2021 and Forecast 2022 to 2032, By Region 7.1. Introduction 7.2. Historical Market Size Value (US$ Million) & Volume (Units) Analysis By Region, 2017 to 2021 7.3. Current Market Size Value (US$ Million) & Volume (Units) Analysis and Forecast By Region, 2022 to 2032 7.3.1. North America 7.3.2. Latin America 7.3.3. Europe 7.3.4. Asia Pacific 7.3.5. Middle East & Africa 7.4. Market Attractiveness Analysis By Region 8. North America Market Analysis 2017 to 2021 and Forecast 2022 to 2032, By Country 8.1. Historical Market Size Value (US$ Million) & Volume (Units) Trend Analysis By Market Taxonomy, 2017 to 2021 8.2. Market Size Value (US$ Million) & Volume (Units) Forecast By Market Taxonomy, 2022 to 2032 8.2.1. By Country 8.2.1.1. USA 8.2.1.2. Canada 8.2.2. By Product 8.2.3. By Application 8.3. Market Attractiveness Analysis 8.3.1. By Country 8.3.2. By Product 8.3.3. By Application 8.4. Key Takeaways 9. Latin America Market Analysis 2017 to 2021 and Forecast 2022 to 2032, By Country 9.1. Historical Market Size Value (US$ Million) & Volume (Units) Trend Analysis By Market Taxonomy, 2017 to 2021 9.2. Market Size Value (US$ Million) & Volume (Units) Forecast By Market Taxonomy, 2022 to 2032 9.2.1. By Country 9.2.1.1. Brazil 9.2.1.2. Mexico 9.2.1.3. Rest of Latin America 9.2.2. By Product 9.2.3. By Application 9.3. Market Attractiveness Analysis 9.3.1. By Country 9.3.2. By Product 9.3.3. By Application 9.4. Key Takeaways 10. Europe Market Analysis 2017 to 2021 and Forecast 2022 to 2032, By Country 10.1. Historical Market Size Value (US$ Million) & Volume (Units) Trend Analysis By Market Taxonomy, 2017 to 2021 10.2. Market Size Value (US$ Million) & Volume (Units) Forecast By Market Taxonomy, 2022 to 2032 10.2.1. By Country 10.2.1.1. Germany 10.2.1.2. United Kingdom 10.2.1.3. France 10.2.1.4. Spain 10.2.1.5. Italy 10.2.1.6. Rest of Europe 10.2.2. By Product 10.2.3. By Application 10.3. Market Attractiveness Analysis 10.3.1. By Country 10.3.2. By Product 10.3.3. By Application 10.4. Key Takeaways 11. Asia Pacific Market Analysis 2017 to 2021 and Forecast 2022 to 2032, By Country 11.1. Historical Market Size Value (US$ Million) & Volume (Units) Trend Analysis By Market Taxonomy, 2017 to 2021 11.2. Market Size Value (US$ Million) & Volume (Units) Forecast By Market Taxonomy, 2022 to 2032 11.2.1. By Country 11.2.1.1. China 11.2.1.2. Japan 11.2.1.3. South Korea 11.2.1.4. Singapore 11.2.1.5. Thailand 11.2.1.6. Indonesia 11.2.1.7. Australia 11.2.1.8. New Zealand 11.2.1.9. Rest of Asia Pacific 11.2.2. By Product 11.2.3. By Application 11.3. Market Attractiveness Analysis 11.3.1. By Country 11.3.2. By Product 11.3.3. By Application 11.4. Key Takeaways 12. Middle East & Africa Market Analysis 2017 to 2021 and Forecast 2022 to 2032, By Country 12.1. Historical Market Size Value (US$ Million) & Volume (Units) Trend Analysis By Market Taxonomy, 2017 to 2021 12.2. Market Size Value (US$ Million) & Volume (Units) Forecast By Market Taxonomy, 2022 to 2032 12.2.1. By Country 12.2.1.1. GCC Countries 12.2.1.2. South Africa 12.2.1.3. Israel 12.2.1.4. Rest of Middle East & Africa 12.2.2. By Product 12.2.3. By Application 12.3. Market Attractiveness Analysis 12.3.1. By Country 12.3.2. By Product 12.3.3. By Application 12.4. Key Takeaways 13. Key Countries Market Analysis 13.1. USA 13.1.1. Pricing Analysis 13.1.2. Market Share Analysis, 2022 13.1.2.1. By Product 13.1.2.2. By Application 13.2. Canada 13.2.1. Pricing Analysis 13.2.2. Market Share Analysis, 2022 13.2.2.1. By Product 13.2.2.2. By Application 13.3. Brazil 13.3.1. Pricing Analysis 13.3.2. Market Share Analysis, 2022 13.3.2.1. By Product 13.3.2.2. By Application 13.4. Mexico 13.4.1. Pricing Analysis 13.4.2. Market Share Analysis, 2022 13.4.2.1. By Product 13.4.2.2. By Application 13.5. Germany 13.5.1. Pricing Analysis 13.5.2. Market Share Analysis, 2022 13.5.2.1. By Product 13.5.2.2. By Application 13.6. United Kingdom 13.6.1. Pricing Analysis 13.6.2. Market Share Analysis, 2022 13.6.2.1. By Product 13.6.2.2. By Application 13.7. France 13.7.1. Pricing Analysis 13.7.2. Market Share Analysis, 2022 13.7.2.1. By Product 13.7.2.2. By Application 13.8. Spain 13.8.1. Pricing Analysis 13.8.2. Market Share Analysis, 2022 13.8.2.1. By Product 13.8.2.2. By Application 13.9. Italy 13.9.1. Pricing Analysis 13.9.2. Market Share Analysis, 2022 13.9.2.1. By Product 13.9.2.2. By Application 13.10. China 13.10.1. Pricing Analysis 13.10.2. Market Share Analysis, 2022 13.10.2.1. By Product 13.10.2.2. By Application 13.11. Japan 13.11.1. Pricing Analysis 13.11.2. Market Share Analysis, 2022 13.11.2.1. By Product 13.11.2.2. By Application 13.12. South Korea 13.12.1. Pricing Analysis 13.12.2. Market Share Analysis, 2022 13.12.2.1. By Product 13.12.2.2. By Application 13.13. Singapore 13.13.1. Pricing Analysis 13.13.2. Market Share Analysis, 2022 13.13.2.1. By Product 13.13.2.2. By Application 13.14. Thailand 13.14.1. Pricing Analysis 13.14.2. Market Share Analysis, 2022 13.14.2.1. By Product 13.14.2.2. By Application 13.15. Indonesia 13.15.1. Pricing Analysis 13.15.2. Market Share Analysis, 2022 13.15.2.1. By Product 13.15.2.2. By Application 13.16. Australia 13.16.1. Pricing Analysis 13.16.2. Market Share Analysis, 2022 13.16.2.1. By Product 13.16.2.2. By Application 13.17. New Zealand 13.17.1. Pricing Analysis 13.17.2. Market Share Analysis, 2022 13.17.2.1. By Product 13.17.2.2. By Application 13.18. GCC Countries 13.18.1. Pricing Analysis 13.18.2. Market Share Analysis, 2022 13.18.2.1. By Product 13.18.2.2. By Application 13.19. South Africa 13.19.1. Pricing Analysis 13.19.2. Market Share Analysis, 2022 13.19.2.1. By Product 13.19.2.2. By Application 13.20. Israel 13.20.1. Pricing Analysis 13.20.2. Market Share Analysis, 2022 13.20.2.1. By Product 13.20.2.2. By Application 14. Market Structure Analysis 14.1. Competition Dashboard 14.2. Competition Benchmarking 14.3. Market Share Analysis of Top Players 14.3.1. By Regional 14.3.2. By Product 14.3.3. By Application 15. Competition Analysis 15.1. Competition Deep Dive 15.1.1. Philips Lumileds Lighting Co. 15.1.1.1. Overview 15.1.1.2. Product Portfolio 15.1.1.3. Profitability by Market Segments 15.1.1.4. Sales Footprint 15.1.1.5. Strategy Overview 15.1.1.5.1. Marketing Strategy 15.1.1.5.2. Product Strategy 15.1.1.5.3. Channel Strategy 15.1.2. Samsung LED Co. Ltd. 15.1.2.1. Overview 15.1.2.2. Product Portfolio 15.1.2.3. Profitability by Market Segments 15.1.2.4. Sales Footprint 15.1.2.5. Strategy Overview 15.1.2.5.1. Marketing Strategy 15.1.2.5.2. Product Strategy 15.1.2.5.3. Channel Strategy 15.1.3. Toyoda Gosei Co. Ltd 15.1.3.1. Overview 15.1.3.2. Product Portfolio 15.1.3.3. Profitability by Market Segments 15.1.3.4. Sales Footprint 15.1.3.5. Strategy Overview 15.1.3.5.1. Marketing Strategy 15.1.3.5.2. Product Strategy 15.1.3.5.3. Channel Strategy 15.1.4. Seoul Semiconductor Co. Ltd 15.1.4.1. Overview 15.1.4.2. Product Portfolio 15.1.4.3. Profitability by Market Segments 15.1.4.4. Sales Footprint 15.1.4.5. Strategy Overview 15.1.4.5.1. Marketing Strategy 15.1.4.5.2. Product Strategy 15.1.4.5.3. Channel Strategy 15.1.5. LG Innotek Co. Ltd. 15.1.5.1. Overview 15.1.5.2. Product Portfolio 15.1.5.3. Profitability by Market Segments 15.1.5.4. Sales Footprint 15.1.5.5. Strategy Overview 15.1.5.5.1. Marketing Strategy 15.1.5.5.2. Product Strategy 15.1.5.5.3. Channel Strategy 15.1.6. Barco NV 15.1.6.1. Overview 15.1.6.2. Product Portfolio 15.1.6.3. Profitability by Market Segments 15.1.6.4. Sales Footprint 15.1.6.5. Strategy Overview 15.1.6.5.1. Marketing Strategy 15.1.6.5.2. Product Strategy 15.1.6.5.3. Channel Strategy 15.1.7. Brodwax Lighting 15.1.7.1. Overview 15.1.7.2. Product Portfolio 15.1.7.3. Profitability by Market Segments 15.1.7.4. Sales Footprint 15.1.7.5. Strategy Overview 15.1.7.5.1. Marketing Strategy 15.1.7.5.2. Product Strategy 15.1.7.5.3. Channel Strategy 15.1.8. Cooper Lighting, LLC 15.1.8.1. Overview 15.1.8.2. Product Portfolio 15.1.8.3. Profitability by Market Segments 15.1.8.4. Sales Footprint 15.1.8.5. Strategy Overview 15.1.8.5.1. Marketing Strategy 15.1.8.5.2. Product Strategy 15.1.8.5.3. Channel Strategy 15.1.9. SMART Global Holdings 15.1.9.1. Overview 15.1.9.2. Product Portfolio 15.1.9.3. Profitability by Market Segments 15.1.9.4. Sales Footprint 15.1.9.5. Strategy Overview 15.1.9.5.1. Marketing Strategy 15.1.9.5.2. Product Strategy 15.1.9.5.3. Channel Strategy 15.1.10. Epistar Corp. 15.1.10.1. Overview 15.1.10.2. Product Portfolio 15.1.10.3. Profitability by Market Segments 15.1.10.4. Sales Footprint 15.1.10.5. Strategy Overview 15.1.10.5.1. Marketing Strategy 15.1.10.5.2. Product Strategy 15.1.10.5.3. Channel Strategy 16. Assumptions & Acronyms Used 17. Research Methodology
Don't pay for what you don't need
Customize your report by selecting specific countries or regions and save 30%!
List of Tables
Table 1: Global Market Value (US$ Million) Forecast by Region, 2017 to 2032 Table 2: Global Market Volume (Units) Forecast by Region, 2017 to 2032 Table 3: Global Market Value (US$ Million) Forecast by Product, 2017 to 2032 Table 4: Global Market Volume (Units) Forecast by Product, 2017 to 2032 Table 5: Global Market Value (US$ Million) Forecast by Application, 2017 to 2032 Table 6: Global Market Volume (Units) Forecast by Application, 2017 to 2032 Table 7: North America Market Value (US$ Million) Forecast by Country, 2017 to 2032 Table 8: North America Market Volume (Units) Forecast by Country, 2017 to 2032 Table 9: North America Market Value (US$ Million) Forecast by Product, 2017 to 2032 Table 10: North America Market Volume (Units) Forecast by Product, 2017 to 2032 Table 11: North America Market Value (US$ Million) Forecast by Application, 2017 to 2032 Table 12: North America Market Volume (Units) Forecast by Application, 2017 to 2032 Table 13: Latin America Market Value (US$ Million) Forecast by Country, 2017 to 2032 Table 14: Latin America Market Volume (Units) Forecast by Country, 2017 to 2032 Table 15: Latin America Market Value (US$ Million) Forecast by Product, 2017 to 2032 Table 16: Latin America Market Volume (Units) Forecast by Product, 2017 to 2032 Table 17: Latin America Market Value (US$ Million) Forecast by Application, 2017 to 2032 Table 18: Latin America Market Volume (Units) Forecast by Application, 2017 to 2032 Table 19: Europe Market Value (US$ Million) Forecast by Country, 2017 to 2032 Table 20: Europe Market Volume (Units) Forecast by Country, 2017 to 2032 Table 21: Europe Market Value (US$ Million) Forecast by Product, 2017 to 2032 Table 22: Europe Market Volume (Units) Forecast by Product, 2017 to 2032 Table 23: Europe Market Value (US$ Million) Forecast by Application, 2017 to 2032 Table 24: Europe Market Volume (Units) Forecast by Application, 2017 to 2032 Table 25: Asia Pacific Market Value (US$ Million) Forecast by Country, 2017 to 2032 Table 26: Asia Pacific Market Volume (Units) Forecast by Country, 2017 to 2032 Table 27: Asia Pacific Market Value (US$ Million) Forecast by Product, 2017 to 2032 Table 28: Asia Pacific Market Volume (Units) Forecast by Product, 2017 to 2032 Table 29: Asia Pacific Market Value (US$ Million) Forecast by Application, 2017 to 2032 Table 30: Asia Pacific Market Volume (Units) Forecast by Application, 2017 to 2032 Table 31: Middle East & Africa Market Value (US$ Million) Forecast by Country, 2017 to 2032 Table 32: Middle East & Africa Market Volume (Units) Forecast by Country, 2017 to 2032 Table 33: Middle East & Africa Market Value (US$ Million) Forecast by Product, 2017 to 2032 Table 34: Middle East & Africa Market Volume (Units) Forecast by Product, 2017 to 2032 Table 35: Middle East & Africa Market Value (US$ Million) Forecast by Application, 2017 to 2032 Table 36: Middle East & Africa Market Volume (Units) Forecast by Application, 2017 to 2032
List of Charts
Figure 1: Global Market Value (US$ Million) by Product, 2022 to 2032 Figure 2: Global Market Value (US$ Million) by Application, 2022 to 2032 Figure 3: Global Market Value (US$ Million) by Region, 2022 to 2032 Figure 4: Global Market Value (US$ Million) Analysis by Region, 2017 to 2032 Figure 5: Global Market Volume (Units) Analysis by Region, 2017 to 2032 Figure 6: Global Market Value Share (%) and BPS Analysis by Region, 2022 to 2032 Figure 7: Global Market Y-o-Y Growth (%) Projections by Region, 2022 to 2032 Figure 8: Global Market Value (US$ Million) Analysis by Product, 2017 to 2032 Figure 9: Global Market Volume (Units) Analysis by Product, 2017 to 2032 Figure 10: Global Market Value Share (%) and BPS Analysis by Product, 2022 to 2032 Figure 11: Global Market Y-o-Y Growth (%) Projections by Product, 2022 to 2032 Figure 12: Global Market Value (US$ Million) Analysis by Application, 2017 to 2032 Figure 13: Global Market Volume (Units) Analysis by Application, 2017 to 2032 Figure 14: Global Market Value Share (%) and BPS Analysis by Application, 2022 to 2032 Figure 15: Global Market Y-o-Y Growth (%) Projections by Application, 2022 to 2032 Figure 16: Global Market Attractiveness by Product, 2022 to 2032 Figure 17: Global Market Attractiveness by Application, 2022 to 2032 Figure 18: Global Market Attractiveness by Region, 2022 to 2032 Figure 19: North America Market Value (US$ Million) by Product, 2022 to 2032 Figure 20: North America Market Value (US$ Million) by Application, 2022 to 2032 Figure 21: North America Market Value (US$ Million) by Country, 2022 to 2032 Figure 22: North America Market Value (US$ Million) Analysis by Country, 2017 to 2032 Figure 23: North America Market Volume (Units) Analysis by Country, 2017 to 2032 Figure 24: North America Market Value Share (%) and BPS Analysis by Country, 2022 to 2032 Figure 25: North America Market Y-o-Y Growth (%) Projections by Country, 2022 to 2032 Figure 26: North America Market Value (US$ Million) Analysis by Product, 2017 to 2032 Figure 27: North America Market Volume (Units) Analysis by Product, 2017 to 2032 Figure 28: North America Market Value Share (%) and BPS Analysis by Product, 2022 to 2032 Figure 29: North America Market Y-o-Y Growth (%) Projections by Product, 2022 to 2032 Figure 30: North America Market Value (US$ Million) Analysis by Application, 2017 to 2032 Figure 31: North America Market Volume (Units) Analysis by Application, 2017 to 2032 Figure 32: North America Market Value Share (%) and BPS Analysis by Application, 2022 to 2032 Figure 33: North America Market Y-o-Y Growth (%) Projections by Application, 2022 to 2032 Figure 34: North America Market Attractiveness by Product, 2022 to 2032 Figure 35: North America Market Attractiveness by Application, 2022 to 2032 Figure 36: North America Market Attractiveness by Country, 2022 to 2032 Figure 37: Latin America Market Value (US$ Million) by Product, 2022 to 2032 Figure 38: Latin America Market Value (US$ Million) by Application, 2022 to 2032 Figure 39: Latin America Market Value (US$ Million) by Country, 2022 to 2032 Figure 40: Latin America Market Value (US$ Million) Analysis by Country, 2017 to 2032 Figure 41: Latin America Market Volume (Units) Analysis by Country, 2017 to 2032 Figure 42: Latin America Market Value Share (%) and BPS Analysis by Country, 2022 to 2032 Figure 43: Latin America Market Y-o-Y Growth (%) Projections by Country, 2022 to 2032 Figure 44: Latin America Market Value (US$ Million) Analysis by Product, 2017 to 2032 Figure 45: Latin America Market Volume (Units) Analysis by Product, 2017 to 2032 Figure 46: Latin America Market Value Share (%) and BPS Analysis by Product, 2022 to 2032 Figure 47: Latin America Market Y-o-Y Growth (%) Projections by Product, 2022 to 2032 Figure 48: Latin America Market Value (US$ Million) Analysis by Application, 2017 to 2032 Figure 49: Latin America Market Volume (Units) Analysis by Application, 2017 to 2032 Figure 50: Latin America Market Value Share (%) and BPS Analysis by Application, 2022 to 2032 Figure 51: Latin America Market Y-o-Y Growth (%) Projections by Application, 2022 to 2032 Figure 52: Latin America Market Attractiveness by Product, 2022 to 2032 Figure 53: Latin America Market Attractiveness by Application, 2022 to 2032 Figure 54: Latin America Market Attractiveness by Country, 2022 to 2032 Figure 55: Europe Market Value (US$ Million) by Product, 2022 to 2032 Figure 56: Europe Market Value (US$ Million) by Application, 2022 to 2032 Figure 57: Europe Market Value (US$ Million) by Country, 2022 to 2032 Figure 58: Europe Market Value (US$ Million) Analysis by Country, 2017 to 2032 Figure 59: Europe Market Volume (Units) Analysis by Country, 2017 to 2032 Figure 60: Europe Market Value Share (%) and BPS Analysis by Country, 2022 to 2032 Figure 61: Europe Market Y-o-Y Growth (%) Projections by Country, 2022 to 2032 Figure 62: Europe Market Value (US$ Million) Analysis by Product, 2017 to 2032 Figure 63: Europe Market Volume (Units) Analysis by Product, 2017 to 2032 Figure 64: Europe Market Value Share (%) and BPS Analysis by Product, 2022 to 2032 Figure 65: Europe Market Y-o-Y Growth (%) Projections by Product, 2022 to 2032 Figure 66: Europe Market Value (US$ Million) Analysis by Application, 2017 to 2032 Figure 67: Europe Market Volume (Units) Analysis by Application, 2017 to 2032 Figure 68: Europe Market Value Share (%) and BPS Analysis by Application, 2022 to 2032 Figure 69: Europe Market Y-o-Y Growth (%) Projections by Application, 2022 to 2032 Figure 70: Europe Market Attractiveness by Product, 2022 to 2032 Figure 71: Europe Market Attractiveness by Application, 2022 to 2032 Figure 72: Europe Market Attractiveness by Country, 2022 to 2032 Figure 73: Asia Pacific Market Value (US$ Million) by Product, 2022 to 2032 Figure 74: Asia Pacific Market Value (US$ Million) by Application, 2022 to 2032 Figure 75: Asia Pacific Market Value (US$ Million) by Country, 2022 to 2032 Figure 76: Asia Pacific Market Value (US$ Million) Analysis by Country, 2017 to 2032 Figure 77: Asia Pacific Market Volume (Units) Analysis by Country, 2017 to 2032 Figure 78: Asia Pacific Market Value Share (%) and BPS Analysis by Country, 2022 to 2032 Figure 79: Asia Pacific Market Y-o-Y Growth (%) Projections by Country, 2022 to 2032 Figure 80: Asia Pacific Market Value (US$ Million) Analysis by Product, 2017 to 2032 Figure 81: Asia Pacific Market Volume (Units) Analysis by Product, 2017 to 2032 Figure 82: Asia Pacific Market Value Share (%) and BPS Analysis by Product, 2022 to 2032 Figure 83: Asia Pacific Market Y-o-Y Growth (%) Projections by Product, 2022 to 2032 Figure 84: Asia Pacific Market Value (US$ Million) Analysis by Application, 2017 to 2032 Figure 85: Asia Pacific Market Volume (Units) Analysis by Application, 2017 to 2032 Figure 86: Asia Pacific Market Value Share (%) and BPS Analysis by Application, 2022 to 2032 Figure 87: Asia Pacific Market Y-o-Y Growth (%) Projections by Application, 2022 to 2032 Figure 88: Asia Pacific Market Attractiveness by Product, 2022 to 2032 Figure 89: Asia Pacific Market Attractiveness by Application, 2022 to 2032 Figure 90: Asia Pacific Market Attractiveness by Country, 2022 to 2032 Figure 91: Middle East & Africa Market Value (US$ Million) by Product, 2022 to 2032 Figure 92: Middle East & Africa Market Value (US$ Million) by Application, 2022 to 2032 Figure 93: Middle East & Africa Market Value (US$ Million) by Country, 2022 to 2032 Figure 94: Middle East & Africa Market Value (US$ Million) Analysis by Country, 2017 to 2032 Figure 95: Middle East & Africa Market Volume (Units) Analysis by Country, 2017 to 2032 Figure 96: Middle East & Africa Market Value Share (%) and BPS Analysis by Country, 2022 to 2032 Figure 97: Middle East & Africa Market Y-o-Y Growth (%) Projections by Country, 2022 to 2032 Figure 98: Middle East & Africa Market Value (US$ Million) Analysis by Product, 2017 to 2032 Figure 99: Middle East & Africa Market Volume (Units) Analysis by Product, 2017 to 2032 Figure 100: Middle East & Africa Market Value Share (%) and BPS Analysis by Product, 2022 to 2032 Figure 101: Middle East & Africa Market Y-o-Y Growth (%) Projections by Product, 2022 to 2032 Figure 102: Middle East & Africa Market Value (US$ Million) Analysis by Application, 2017 to 2032 Figure 103: Middle East & Africa Market Volume (Units) Analysis by Application, 2017 to 2032 Figure 104: Middle East & Africa Market Value Share (%) and BPS Analysis by Application, 2022 to 2032 Figure 105: Middle East & Africa Market Y-o-Y Growth (%) Projections by Application, 2022 to 2032 Figure 106: Middle East & Africa Market Attractiveness by Product, 2022 to 2032 Figure 107: Middle East & Africa Market Attractiveness by Application, 2022 to 2032 Figure 108: Middle East & Africa Market Attractiveness by Country, 2022 to 2032
Recommendations
Explore Technology Insights
View Reports