LED and OLED Lighting Products and Display Market Outlook from 2025 to 2035

The LED and OLED lighting products and display market is witnessing strong growth driven by technological advancements and the increasing demand for energy-efficient, sustainable, and high-performance lighting solutions. The market outlook remains positive due to the rising adoption of OLED technology in displays and lighting applications, propelled by its superior color accuracy, flexibility, and thin form factor. Increasing awareness of energy conservation, coupled with government initiatives promoting efficient lighting systems, is further supporting market expansion.

The integration of LED and OLED technologies in smart devices, automotive lighting, and architectural applications is reshaping product innovation and competitiveness. Manufacturers are focusing on advanced materials, miniaturization, and improved luminous efficacy to enhance durability and efficiency.

The continuous evolution of display technologies in consumer electronics and the expansion of connected lighting solutions across residential and commercial spaces are also influencing long-term growth prospects As the global focus shifts toward sustainable illumination and premium display quality, the market is anticipated to experience steady and diversified growth.
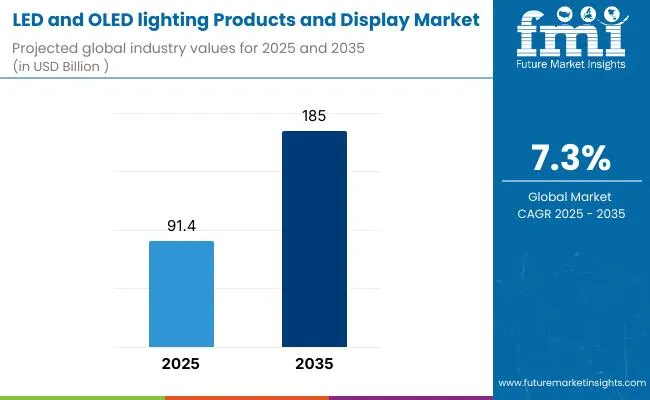
Quick Stats for LED and OLED lighting Products and Display Market

  • LED and OLED lighting Products and Display Market Industry Value (2025): USD 91.4 billion
  • LED and OLED lighting Products and Display Market Forecast Value (2035): USD 185.0 billion
  • LED and OLED lighting Products and Display Market Forecast CAGR: 7.3%
  • Leading Segment in LED and OLED lighting Products and Display Market in 2025: Mobile Display (35.0%)
  • Key Growth Region in LED and OLED lighting Products and Display Market: North America, Asia-Pacific, Europe
  • Top Key Players in LED and OLED lighting Products and Display Market: Samsung Electronics, Co. Ltd., TIANMA Microelectronics Co., Ltd., SHARP Corporation, Japan Display Inc., Daktronics, Inc., Universal Display Corporation, Visionox Technology Inc., AUO Corporation, Innolux Corporation, BOE Technology Group Co., Ltd., LG Display Co., Ltd., Barco Electronic Systems Pvt Ltd, Futaba Corporation

Middle East Led Oled Lighting Products Displays Market By Analysis

Metric Value
LED and OLED lighting Products and Display Market Estimated Value in (2025 E) USD 91.4 billion
LED and OLED lighting Products and Display Market Forecast Value in (2035 F) USD 185.0 billion
Forecast CAGR (2025 to 2035) 7.3%

Segmental Analysis

The market is segmented by Product, Application, and End Use and region. By Product, the market is divided into Mobile Display, Consumer Television Display, Outdoor LED Display, and Others. In terms of Application, the market is classified into Smartphones, Television, Tablet, Smartwatch, and Others. Based on End Use, the market is segmented into Residential and Commercial. Regionally, the market is classified into North America, Latin America, Western Europe, Eastern Europe, Balkan & Baltic Countries, Russia & Belarus, Central Asia, East Asia, South Asia & Pacific, and the Middle East & Africa.
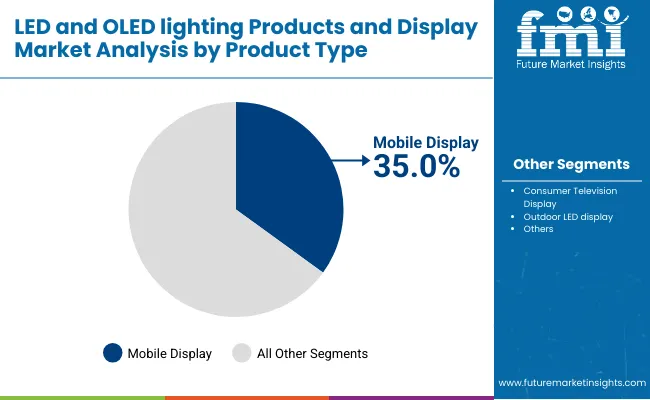
Insights into the Mobile Display Segment

Middle East Led Oled Lighting Products Displays Market By Product Type

The mobile display segment is projected to hold 35.00% of the LED and OLED lighting products and display market revenue share in 2025, making it the leading product category. The dominance of this segment is driven by the surging demand for high-resolution, energy-efficient, and flexible displays integrated into modern smartphones, tablets, and wearable devices.

Continuous advancements in OLED and micro-LED technologies have enhanced color contrast, brightness, and power efficiency, making mobile displays the preferred choice for device manufacturers. The miniaturization of display components has enabled thinner and more durable screens, while improvements in material efficiency have reduced manufacturing costs.

The widespread adoption of OLED-based displays for their superior visual experience and reduced power consumption has reinforced the growth of this segment Furthermore, increasing consumer inclination toward premium devices with advanced display features continues to support the dominance of mobile displays in the overall market landscape.
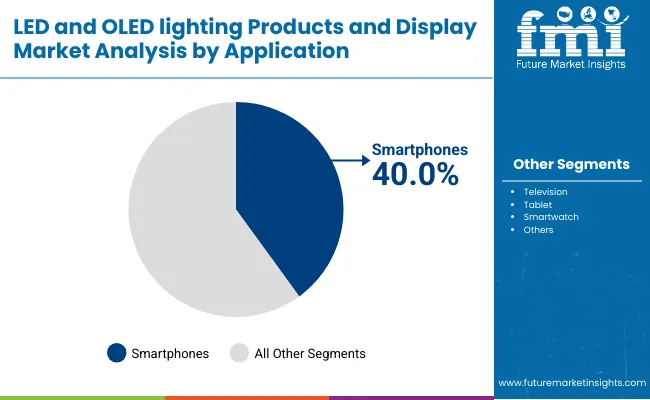
Insights into the Smartphones Application Segment

Middle East Led Oled Lighting Products Displays Market By Application

The smartphones application segment is expected to account for 40.00% of the LED and OLED lighting products and display market revenue share in 2025, establishing itself as the dominant application area. This leadership has been attributed to the consistent integration of OLED and advanced LED panels in smartphones to achieve enhanced brightness, clarity, and color accuracy.

The segment has benefited from rising consumer preference for high-performance displays with low power consumption, which improves battery efficiency. Continuous innovation in flexible OLED displays has allowed for the introduction of foldable and edge-to-edge screen designs, contributing to growing market penetration.

Increasing global smartphone shipments, coupled with shorter product replacement cycles, has also accelerated the adoption of advanced lighting and display technologies The emphasis on enhanced visual experiences and reduced energy usage is expected to further strengthen the position of the smartphone application segment in the forecast period.
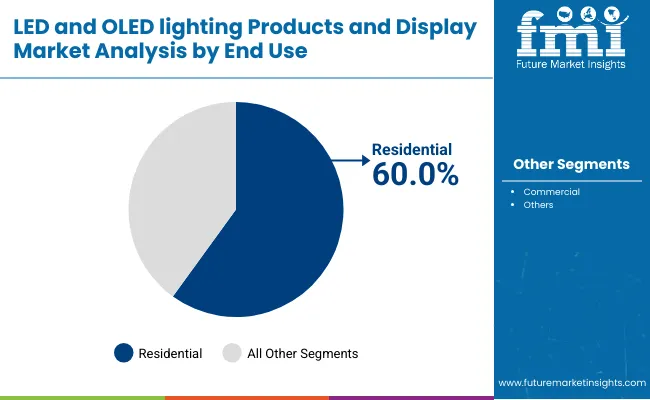
Insights into the Residential End-Use Segment

Middle East Led Oled Lighting Products Displays Market By End User

The residential end-use segment is anticipated to capture 60.00% of the LED and OLED lighting products and display market revenue in 2025, making it the leading segment. The growth of this segment is being driven by increasing urbanization, rising disposable incomes, and growing consumer awareness about sustainable lighting solutions. The widespread replacement of traditional lighting systems with LED and OLED alternatives is contributing to significant energy savings and longer product lifespans.

Advancements in smart lighting systems that integrate with home automation platforms have also accelerated adoption in the residential sector. The aesthetic flexibility and design appeal of OLED lighting panels are supporting their use in decorative and ambient lighting.

Additionally, supportive government policies promoting energy-efficient homes and infrastructure development are fostering higher market demand As consumers continue to prioritize energy efficiency, cost-effectiveness, and modern design aesthetics, the residential end-use segment is expected to maintain its leading position in the coming years.

Semi-Annual Market Update

The below table presents the expected CAGR for the global LED and OLED Lighting Products and Display market over several semi-annual periods spanning from 2025 to 2035. This assessment outlines changes in the LED and OLED Lighting Products and Display industry and identify revenue trends, offering key decision makers an understanding about market performance throughout the year.

H1 represents first half of the year from January to June, H2 spans from July to December, which is the second half. In the first half (H1) of the year from 2025 to 2035, the business is predicted to surge at a CAGR of 6.7%, followed by a slightly higher growth rate of 7.7% in the second half (H2) of the same decade.

Particular Value CAGR
H1 6.7% (2025 to 2035)
H2 7.7% (2025 to 2035)
H1 6.3% (2025 to 2035)
H2 7.8% (2025 to 2035)

Moving into the subsequent period, from H1 2025 to H2 2035, the CAGR is projected to decrease slightly to 6.3% in the first half and remain higher at 7.8% in the second half. In the first half (H1) the market witnessed a decrease of 40 BPS while in the second half (H2), the market witnessed an increase of 10 BPS.

Key Industry Highlights

Mobile Display Technologies are gaining traction due to the surge in mobile device usage, especially in fast-growing digital markets

The growing demand for display technologies and it offers superior resolution, color accuracy and energy efficiency. Mobile display technologies include AMOLED and OLED screens are at the lead of evolution and it provide users to enhanced visual experiences and longer battery life.

According to government of India the Digital India initiative, is propelling digital connectivity and encouraging technology adoption which includes the adoption of mobile display technologies. In 2025, Samsung's deals with major tech firm to supply AMOLED displays for next-generation smartphones highlights the importance of technologies. AMOLED displays hold 30% of the global mobile display market due to rising demand for high-quality mobile screens continues to increase.

Perimeter Lighted Boards Outdoor LED Displays are increasingly used in stadiums and arenas to enhance audience engagement with vivid displays

The boards are strategically placed around perimeter of sports venues to provide real-time game updates, advertisements and interactive content that will capture the attention of audience. This will enhance the overall fan experience by delivering high visuals that are visible from all angles around the stadium.

According to USA Federal Government's "Smart Stadiums" initiative encourages the integration of digital technologies in public venues to improve audience experiences. This initiative line up with investments in upgrading sports facilities with LED display technologies. In 2025, Daktronics and Major League Soccer secured contracts to supply LED perimeter displays for several MLS stadiums showcasing the propelling demand for technologies.

Video Walls OLED Displays offer unique opportunities in corporate settings, where high-definition, immersive displays are essential for presentations and meetings

OLED video walls provide image quality with vibrant colors, deep blacks and ultra-high resolution for creating impactful visual experiences in boardrooms and conference centers. The flexibility and modular design allow seamless integration into various corporate environments helps in enhancing the effectiveness of visual communications.

According to UK government the Digital Infrastructure Investment Fund supports the upgrade of public sector meeting rooms and conference facilities with advanced display technologies. This helps to improve collaboration and communication through high-quality visual tools which includes OLED video walls.

Samsung completed a major installation of OLED video walls in Singapore. This deployment showcases the growing adoption of OLED technology in corporate reflecting its role to enhance business communications and decision-making.

Complex Installation and Maintenance of large-scale video walls can increase operational challenges and costs

The installation of systems requires planning and precise execution for ensuring seamless integration and optimal performance. Large video walls involve complex setups such as mounting multiple display panels, managing wiring and connectivity and calibrating the displays to achieve uniform color and brightness across entire screen.

Regular upkeep is required to confirm that all components include LED modules or OLED panels remain in optimal condition. Maintenance tasks will include troubleshooting display issues, replacing faulty panels and recalibrating the system to maintain display quality.

The rising need for specialized technicians and the potential for lengthy downtime during maintenance activities further increase operational costs. This complexity in installation and maintenance in both of them can limit for some organizations particularly for those with limited resources or technical expertise will impact the adoption of advanced video wall technologies in the market.

2020 to 2025 Global LED and OLED Lighting Products and Display Sales Outlook Compared to Demand Forecasts from 2025 to 2035

From 2020 to 2025, the global sales of LED and OLED lighting products and displays saw significant growth, propelling for rising adoption of Mobile displays, consumer television displays and Outdoor LED Displays. This growth seen in various sectors such as consumer electronics, energy-efficient displays became standard in mobile devices and televisions.

The OLED screens in flagship smartphones significantly increased sales in mobile display segment. he global sales of LED an OLED lighting products and display grows at a CAGR 5.9% from 2020 to 2025.

From 2025 to 2035, the demand for products is anticipated to increase even more with advancements in display technologies and expansion of smart infrastructure projects globally. The Outdoor LED Display segment such as billboards and perimeter lighted boards is set to benefit from increased investments in advertising technologies, governments and private sectors in Asia and Europe driving these changes.

The Consumer Television Display segment, with OLED and AMOLED technologies, is likely to see surge in demand as consumers increasingly prefer high-definition, immersive viewing experiences. From 2025 to 2035 suggests a growth trajectory, with demand outpacing supply as these advanced display technologies become central to both consumer and commercial applications.

Market Concentration

Tier 1 vendors dominating in the market with wide global reach, strong brand recognition and substantial R&D investments in overall market. Vendors such as Samsung Electronics, LG Display and Philips Lighting are the major giants for both consumers display and commercial lighting segments, offering advanced OLED and LED solutions for high-end smartphones, televisions and large-scale outdoor displays. Tier 1 vendors caters 55% to 60% of overall market accounting for a significant share of global revenue and setting industry standards with cutting-edge technology.

Tier 2 vendors have strong regional presence and competitive product offerings. Tier 2 vendors include Osram, Acuity Brands and Panasonic provides robust LED lighting and display product across different markets and caters around 10% to 15% of overall market. These vendors focus on applications such as industrial lighting or specialized outdoor displays and propelling market growth in emerging regions.

Tier 3 vendors are smaller companies and local manufacturers caters to niche markets or specific geographic areas. Tier 3 vendors specialize in cost-effective or customized products serving particular segments like small-scale outdoor displays or residential lighting. Vendors such as Havells, Cree Lighting and various regional players fit into this category. Tier 3 caters around 25% to 30% in overall LED and OLED Lighting Products and Display market.

Country-wise Insights

The section highlights the CAGRs of countries experiencing growth in the LED and OLED Lighting Products and Display market, along with the latest advancements contributing to overall market development. Based on current estimates, India, USA and Japan are expected to see steady growth during the forecast period.
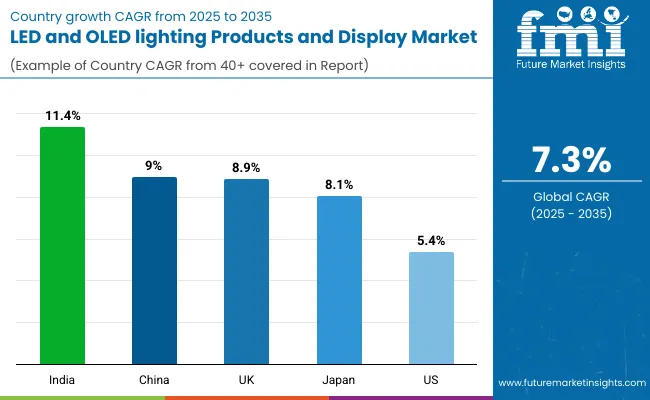
Middle East Led Oled Lighting Products Displays Market By Country

Countries CAGR from 2025 to 2035
India 11.4%
China 9.0%
UK 8.9%
Japan 8.1%
United States 5.4%

Increasing adoption of Smartphones in India is driving the demand for advanced LED and OLED displays

The government of India and their initiatives propelling the market demand for advanced LED and OLED displays. The Digital India initiative goals to increase internet penetration and smartphone usage across urban and rural areas. The Indian government introduced schemes such as production linked incentive to propel domestic manufacturing of electronics components such as LED and OLED displays.

This initiative is projected to fuel a significant increase in production. Samsung committed to invest over 91.4 million in India operations focused on display technology. The market for LED and OLED lighting and display is anticipated to witness substantial at a CAGR 11.4% from 2025 to 2035 in the LED and OLED lighting products and display market indicating increase in demand over the next five years.

The growing demand for Tablets in China creates opportunities for the adoption of high-performance OLED displays

According to government of China the initiative such as Made in China 2025 is a key driver focused on technology and innovation in different sectors, including electronics. This initiative aims to boost domestic production capabilities and it will enhance the integration of cutting-edge technologies such as OLED displays into consumer devices.

Huawei and Xiaomi committed resources to R&D for display technologies. It has allocated around 1 billion to its R&D efforts with a substantial portion for developing advanced OLED display technologies. The Chinese government’s shift towards digital infrastructure and smart technology adoption is adopting growth in the tablet market.

With an estimated 20% increase in tablet sales over the next few years, propel by both domestic consumption and export demands. China LED and OLED Lighting Products and Display market is anticipated to grow from 6,453.7 Million in 2025 to 15,452.4 Million by 2035

Smartwatches are adopting OLED technology in UK due to consumer preference for clear, high-contrast displays

According to government of UK “Industrial Strategy Challenge Fund” supports the development of cutting-edge technologies such as OLED displays. The fund allocates significant resources to increase technological advancements and foster the growth in high-tech sectors which directly benefit to smart wearable market.

The government commitment to smart technology and digital infrastructure is patent in significant public and private investments. The government focused on spending on digital innovation with an estimated USD 1.8 billion allocated to technology and infrastructure projects in the 2025 budget.

This investment will support the broader technology ecosystem such as adoption of advanced display technologies in consumer electronics. UK is anticipated to see substantial growth at a CAGR 8.9% from 2025 to 2035 in the LED and OLED Lighting Products and Display market.

Category-wise Insights

The section contains information about the leading segments in the industry. By end use, the commercial segment is estimated to grow at a CAGR of 8.0% throughout 2035. Additionally, the mobile panel segment is foreseen to expand at 9.5% until 2035.

Billboard Outdoor LED Display Dominate the LED and OLED Lighting Products and Display Market in terms of market share

Enterprise Size Billboard
Value Share (2025) 25.4%

The billboard segment accounts for almost 25.4% of the share in 2025. Due to their high visibility and effectiveness in advertising. According to UK government regeneration and growth fund allocated USD 600 million to enhance urban infrastructure such as digital signage and billboard technology.

This initiative will help to renew public spaces and improve urban environments which will benefit directly to billboard LED display market. In 2025, Clear Channel Outdoor committed over USD 150 million to innovate and upgrade its digital billboard networks globally. This investment focused on improving display brightness, durability and energy efficiency.

Commercial industry finds LED and OLED Lighting Products and Display to be most lucrative for enhancing visual appeal and energy efficiency in high-traffic environments

Industry Commercial
CAGR (2025 to 2035) 8.0%

The commercial industry LED and OLED lighting products and displays mostly lucrative to enhance visual appeal in high-traffic environments. The technologies offer superior brightness, color accuracy and energy savings compared to traditional lighting. According to USA government energy efficiency and conservation block grant program allocates funds to support the adoption of energy-efficient technologies for LED lighting.

In 2025, USD 350 million kept for energy-efficient infrastructure projects which will benefit directly for commercial applications of LED and OLED displays. For Instance, Philips Lighting invested over USD 200 million in research to develop next-generation LED solutions to offer enhanced energy efficiency and longer lifespan.

Also Samsung Display committed approximately 91.4 million annually to improve OLED technology focused on increasing brightness, durability and color accuracy for commercial use. The commercial industry segment grows at a CAGR 8.0% from 2025 to 2035.

Competition Outlook

The competitive outlook in the LED and OLED display market is categorized by continuous innovation and strategic partnerships. Vendors are focusing on developing technologies for enhancing display quality, energy efficiency and versatility. Key Vendors are focused on investment in research and development to introduce advanced products that will meet diverse applications from commercial displays to residential interiors.

Strategic collaborations and mergers are common and which will aim to broaden product portfolios and leverage complementary strengths. The market is witnessing increased competition as firms will strive to differentiate themselves through technological advancements and performance.

Industry Update

  • For Instance, In January 2025 AUO Corporation showcased Transparent Micro LED display series for the first time in Europe. It is designed for a variety of applications such as digital signage, commercial displays, corporate meeting rooms and residential interiors.
  • In November 2025, Samsung Electronics introduced outdoor rooftop LED displays for the event. These installations help to improve the viewing experience for fans both at the venue and at home.
  • In February 2025, Sharp Corporation announced its product lines with NEC Display Solutions. The strategic integration will help to enhance portfolio of display solutions and it will allow clients and partners to access a range of advanced products and services.
  • In November 2025, Universal Display Corporation announced the OLED material supply and license agreements with BOE Technology Group Co., Ltd. The agreements will help to strengthen the existing partnership and propel the proliferation of OLEDs across the global consumer electronics landscape.
  • In October 2025, LG Display and LG Chem announced self-developing a critical OLED material called 'p-Dopant. The development of OLED material demonstrates expertise and commitment to advance OLED technology.

Key players in the LED and OLED Lighting Products and Display Industry

  • Samsung Electronics, Co. Ltd.
  • TIANMA Microelectronics Co., Ltd.
  • SHARP Corporation
  • Japan Display Inc.
  • Daktronics, Inc.
  • Universal Display Corporation
  • Visionox Technology Inc.
  • AUO Corporation
  • Innolux Corporation
  • BOE Technology Group Co., Ltd.
  • LG Display Co., Ltd.

LED and OLED Lighting Products and Display Market Segmentation

By Product:

In terms of product, the industry is divided into mobile display, consumer television display, outdoor LED display and others.

By Application:

In terms of application, the industry is segregated into smartphones, television, tablet, smartwatch and others.

By End Use:

In terms of end use, the industry is segregated into residential and commercial.

By Region:

A regional analysis has been carried out in key countries of North America, Latin America, East Asia, South Asia & Pacific, Western Europe, Eastern Europe and Middle East & Africa.

Frequently Asked Questions

How big is the LED and OLED lighting products and display market in 2025?

The global LED and OLED lighting products and display market is estimated to be valued at USD 91.4 billion in 2025.

What will be the size of LED and OLED lighting products and display market in 2035?

The market size for the LED and OLED lighting products and display market is projected to reach USD 185.0 billion by 2035.

How much will be the LED and OLED lighting products and display market growth between 2025 and 2035?

The LED and OLED lighting products and display market is expected to grow at a 7.3% CAGR between 2025 and 2035.

What are the key product types in the LED and OLED lighting products and display market?

The key product types in LED and OLED lighting products and display market are mobile display, consumer television display, outdoor LED display and others.

Which application segment to contribute significant share in the LED and OLED lighting products and display market in 2025?

In terms of application, smartphones segment to command 40.0% share in the LED and OLED lighting products and display market in 2025.

Table of Content

  1. Executive Summary
    • Global Market Outlook
    • Demand to side Trends
    • Supply to side Trends
    • Technology Roadmap Analysis
    • Analysis and Recommendations
  2. Market Overview
    • Market Coverage / Taxonomy
    • Market Definition / Scope / Limitations
  3. Market Background
    • Market Dynamics
      • Drivers
      • Restraints
      • Opportunity
      • Trends
    • Scenario Forecast
      • Demand in Optimistic Scenario
      • Demand in Likely Scenario
      • Demand in Conservative Scenario
    • Opportunity Map Analysis
    • Product Life Cycle Analysis
    • Supply Chain Analysis
    • Investment Feasibility Matrix
    • Value Chain Analysis
    • PESTLE and Porter’s Analysis
    • Regulatory Landscape
    • Regional Parent Market Outlook
    • Production and Consumption Statistics
    • Import and Export Statistics
  4. Global Market Analysis 2020 to 2025 and Forecast, 2025 to 2035
    • Historical Market Size Value (USD Million) Analysis, 2020 to 2025
    • Current and Future Market Size Value (USD Million) Projections, 2025 to 2035
      • Y to o to Y Growth Trend Analysis
      • Absolute $ Opportunity Analysis
  5. Global Market Pricing Analysis 2020 to 2025 and Forecast 2025 to 2035
  6. Global Market Analysis 2020 to 2025 and Forecast 2025 to 2035, By Product
    • Introduction / Key Findings
    • Historical Market Size Value (USD Million) Analysis By Product , 2020 to 2025
    • Current and Future Market Size Value (USD Million) Analysis and Forecast By Product , 2025 to 2035
      • Mobile Display
      • Consumer Television Display
      • Outdoor LED Display
      • Others
    • Y to o to Y Growth Trend Analysis By Product , 2020 to 2025
    • Absolute $ Opportunity Analysis By Product , 2025 to 2035
  7. Global Market Analysis 2020 to 2025 and Forecast 2025 to 2035, By Application
    • Introduction / Key Findings
    • Historical Market Size Value (USD Million) Analysis By Application, 2020 to 2025
    • Current and Future Market Size Value (USD Million) Analysis and Forecast By Application, 2025 to 2035
      • Smartphones
      • Television
      • Tablet
      • Smartwatch
      • Others
    • Y to o to Y Growth Trend Analysis By Application, 2020 to 2025
    • Absolute $ Opportunity Analysis By Application, 2025 to 2035
  8. Global Market Analysis 2020 to 2025 and Forecast 2025 to 2035, By End Use
    • Introduction / Key Findings
    • Historical Market Size Value (USD Million) Analysis By End Use, 2020 to 2025
    • Current and Future Market Size Value (USD Million) Analysis and Forecast By End Use, 2025 to 2035
      • Residential
      • Commercial
    • Y to o to Y Growth Trend Analysis By End Use, 2020 to 2025
    • Absolute $ Opportunity Analysis By End Use, 2025 to 2035
  9. Global Market Analysis 2020 to 2025 and Forecast 2025 to 2035, By Region
    • Introduction
    • Historical Market Size Value (USD Million) Analysis By Region, 2020 to 2025
    • Current Market Size Value (USD Million) Analysis and Forecast By Region, 2025 to 2035
      • North America
      • Latin America
      • Western Europe
      • Eastern Europe
      • East Asia
      • South Asia and Pacific
      • Middle East & Africa
    • Market Attractiveness Analysis By Region
  10. North America Market Analysis 2020 to 2025 and Forecast 2025 to 2035, By Country
    • Historical Market Size Value (USD Million) Trend Analysis By Market Taxonomy, 2020 to 2025
    • Market Size Value (USD Million) Forecast By Market Taxonomy, 2025 to 2035
      • By Country
        • USA
        • Canada
        • Mexico
      • By Product
      • By Application
      • By End Use
    • Market Attractiveness Analysis
      • By Country
      • By Product
      • By Application
      • By End Use
    • Key Takeaways
  11. Latin America Market Analysis 2020 to 2025 and Forecast 2025 to 2035, By Country
    • Historical Market Size Value (USD Million) Trend Analysis By Market Taxonomy, 2020 to 2025
    • Market Size Value (USD Million) Forecast By Market Taxonomy, 2025 to 2035
      • By Country
        • Brazil
        • Chile
        • Rest of Latin America
      • By Product
      • By Application
      • By End Use
    • Market Attractiveness Analysis
      • By Country
      • By Product
      • By Application
      • By End Use
    • Key Takeaways
  12. Western Europe Market Analysis 2020 to 2025 and Forecast 2025 to 2035, By Country
    • Historical Market Size Value (USD Million) Trend Analysis By Market Taxonomy, 2020 to 2025
    • Market Size Value (USD Million) Forecast By Market Taxonomy, 2025 to 2035
      • By Country
        • Germany
        • UK
        • Italy
        • Spain
        • France
        • Nordic
        • BENELUX
        • Rest of Western Europe
      • By Product
      • By Application
      • By End Use
    • Market Attractiveness Analysis
      • By Country
      • By Product
      • By Application
      • By End Use
    • Key Takeaways
  13. Eastern Europe Market Analysis 2020 to 2025 and Forecast 2025 to 2035, By Country
    • Historical Market Size Value (USD Million) Trend Analysis By Market Taxonomy, 2020 to 2025
    • Market Size Value (USD Million) Forecast By Market Taxonomy, 2025 to 2035
      • By Country
        • Russia
        • Poland
        • Hungary
        • Balkan & Baltic
        • Rest of Eastern Europe
      • By Product
      • By Application
      • By End Use
    • Market Attractiveness Analysis
      • By Country
      • By Product
      • By Application
      • By End Use
    • Key Takeaways
  14. East Asia Market Analysis 2020 to 2025 and Forecast 2025 to 2035, By Country
    • Historical Market Size Value (USD Million) Trend Analysis By Market Taxonomy, 2020 to 2025
    • Market Size Value (USD Million) Forecast By Market Taxonomy, 2025 to 2035
      • By Country
        • China
        • Japan
        • South Korea
      • By Product
      • By Application
      • By End Use
    • Market Attractiveness Analysis
      • By Country
      • By Product
      • By Application
      • By End Use
    • Key Takeaways
  15. South Asia and Pacific Market Analysis 2020 to 2025 and Forecast 2025 to 2035, By Country
    • Historical Market Size Value (USD Million) Trend Analysis By Market Taxonomy, 2020 to 2025
    • Market Size Value (USD Million) Forecast By Market Taxonomy, 2025 to 2035
      • By Country
        • India
        • ASEAN
        • Australia & New Zealand
        • Rest of South Asia and Pacific
      • By Product
      • By Application
      • By End Use
    • Market Attractiveness Analysis
      • By Country
      • By Product
      • By Application
      • By End Use
    • Key Takeaways
  16. Middle East & Africa Market Analysis 2020 to 2025 and Forecast 2025 to 2035, By Country
    • Historical Market Size Value (USD Million) Trend Analysis By Market Taxonomy, 2020 to 2025
    • Market Size Value (USD Million) Forecast By Market Taxonomy, 2025 to 2035
      • By Country
        • Kingdom of Saudi Arabia
        • Other GCC Countries
        • Turkiye
        • South Africa
        • Other African Union
        • Rest of Middle East & Africa
      • By Product
      • By Application
      • By End Use
    • Market Attractiveness Analysis
      • By Country
      • By Product
      • By Application
      • By End Use
    • Key Takeaways
  17. Key Countries Market Analysis
    • USA
      • Pricing Analysis
      • Market Share Analysis, 2025
        • By Product
        • By Application
        • By End Use
    • Canada
      • Pricing Analysis
      • Market Share Analysis, 2025
        • By Product
        • By Application
        • By End Use
    • Mexico
      • Pricing Analysis
      • Market Share Analysis, 2025
        • By Product
        • By Application
        • By End Use
    • Brazil
      • Pricing Analysis
      • Market Share Analysis, 2025
        • By Product
        • By Application
        • By End Use
    • Chile
      • Pricing Analysis
      • Market Share Analysis, 2025
        • By Product
        • By Application
        • By End Use
    • Germany
      • Pricing Analysis
      • Market Share Analysis, 2025
        • By Product
        • By Application
        • By End Use
    • UK
      • Pricing Analysis
      • Market Share Analysis, 2025
        • By Product
        • By Application
        • By End Use
    • Italy
      • Pricing Analysis
      • Market Share Analysis, 2025
        • By Product
        • By Application
        • By End Use
    • Spain
      • Pricing Analysis
      • Market Share Analysis, 2025
        • By Product
        • By Application
        • By End Use
    • France
      • Pricing Analysis
      • Market Share Analysis, 2025
        • By Product
        • By Application
        • By End Use
    • India
      • Pricing Analysis
      • Market Share Analysis, 2025
        • By Product
        • By Application
        • By End Use
    • ASEAN
      • Pricing Analysis
      • Market Share Analysis, 2025
        • By Product
        • By Application
        • By End Use
    • Australia & New Zealand
      • Pricing Analysis
      • Market Share Analysis, 2025
        • By Product
        • By Application
        • By End Use
    • China
      • Pricing Analysis
      • Market Share Analysis, 2025
        • By Product
        • By Application
        • By End Use
    • Japan
      • Pricing Analysis
      • Market Share Analysis, 2025
        • By Product
        • By Application
        • By End Use
    • South Korea
      • Pricing Analysis
      • Market Share Analysis, 2025
        • By Product
        • By Application
        • By End Use
    • Russia
      • Pricing Analysis
      • Market Share Analysis, 2025
        • By Product
        • By Application
        • By End Use
    • Poland
      • Pricing Analysis
      • Market Share Analysis, 2025
        • By Product
        • By Application
        • By End Use
    • Hungary
      • Pricing Analysis
      • Market Share Analysis, 2025
        • By Product
        • By Application
        • By End Use
    • Kingdom of Saudi Arabia
      • Pricing Analysis
      • Market Share Analysis, 2025
        • By Product
        • By Application
        • By End Use
    • Turkiye
      • Pricing Analysis
      • Market Share Analysis, 2025
        • By Product
        • By Application
        • By End Use
    • South Africa
      • Pricing Analysis
      • Market Share Analysis, 2025
        • By Product
        • By Application
        • By End Use
  18. Market Structure Analysis
    • Competition Dashboard
    • Competition Benchmarking
    • Market Share Analysis of Top Players
      • By Regional
      • By Product
      • By Application
      • By End Use
  19. Competition Analysis
    • Competition Deep Dive
      • Samsung Electronics, Co. Ltd.
        • Overview
        • Product Portfolio
        • Profitability by Market Segments (Product/Age /Sales Channel/Region)
        • Sales Footprint
        • Strategy Overview
          • Marketing Strategy
          • Product Strategy
          • Channel Strategy
      • TIANMA Microelectronics Co., Ltd.
      • SHARP Corporation
      • Japan Display Inc.
      • Daktronics, Inc.
      • Universal Display Corporation
      • Visionox Technology Inc.
      • AUO Corporation
      • Innolux Corporation
      • BOE Technology Group Co., Ltd.
      • LG Display Co., Ltd.
      • Barco Electronic Systems Pvt Ltd
      • Futaba Corporation
  20. Assumptions & Acronyms Used
  21. Research Methodology

List of Tables

  • Table 1: Global Market Value (USD Million) Forecast by Region, 2020 to 2035
  • Table 2: Global Market Value (USD Million) Forecast by Product , 2020 to 2035
  • Table 3: Global Market Value (USD Million) Forecast by Application, 2020 to 2035
  • Table 4: Global Market Value (USD Million) Forecast by End Use, 2020 to 2035
  • Table 5: North America Market Value (USD Million) Forecast by Country, 2020 to 2035
  • Table 6: North America Market Value (USD Million) Forecast by Product , 2020 to 2035
  • Table 7: North America Market Value (USD Million) Forecast by Application, 2020 to 2035
  • Table 8: North America Market Value (USD Million) Forecast by End Use, 2020 to 2035
  • Table 9: Latin America Market Value (USD Million) Forecast by Country, 2020 to 2035
  • Table 10: Latin America Market Value (USD Million) Forecast by Product , 2020 to 2035
  • Table 11: Latin America Market Value (USD Million) Forecast by Application, 2020 to 2035
  • Table 12: Latin America Market Value (USD Million) Forecast by End Use, 2020 to 2035
  • Table 13: Western Europe Market Value (USD Million) Forecast by Country, 2020 to 2035
  • Table 14: Western Europe Market Value (USD Million) Forecast by Product , 2020 to 2035
  • Table 15: Western Europe Market Value (USD Million) Forecast by Application, 2020 to 2035
  • Table 16: Western Europe Market Value (USD Million) Forecast by End Use, 2020 to 2035
  • Table 17: Eastern Europe Market Value (USD Million) Forecast by Country, 2020 to 2035
  • Table 18: Eastern Europe Market Value (USD Million) Forecast by Product , 2020 to 2035
  • Table 19: Eastern Europe Market Value (USD Million) Forecast by Application, 2020 to 2035
  • Table 20: Eastern Europe Market Value (USD Million) Forecast by End Use, 2020 to 2035
  • Table 21: East Asia Market Value (USD Million) Forecast by Country, 2020 to 2035
  • Table 22: East Asia Market Value (USD Million) Forecast by Product , 2020 to 2035
  • Table 23: East Asia Market Value (USD Million) Forecast by Application, 2020 to 2035
  • Table 24: East Asia Market Value (USD Million) Forecast by End Use, 2020 to 2035
  • Table 25: South Asia and Pacific Market Value (USD Million) Forecast by Country, 2020 to 2035
  • Table 26: South Asia and Pacific Market Value (USD Million) Forecast by Product , 2020 to 2035
  • Table 27: South Asia and Pacific Market Value (USD Million) Forecast by Application, 2020 to 2035
  • Table 28: South Asia and Pacific Market Value (USD Million) Forecast by End Use, 2020 to 2035
  • Table 29: Middle East & Africa Market Value (USD Million) Forecast by Country, 2020 to 2035
  • Table 30: Middle East & Africa Market Value (USD Million) Forecast by Product , 2020 to 2035
  • Table 31: Middle East & Africa Market Value (USD Million) Forecast by Application, 2020 to 2035
  • Table 32: Middle East & Africa Market Value (USD Million) Forecast by End Use, 2020 to 2035

List of Figures

  • Figure 1: Global Market Pricing Analysis
  • Figure 2: Global Market Value (USD Million) Forecast 2020-2035
  • Figure 3: Global Market Value Share and BPS Analysis by Product , 2025 and 2035
  • Figure 4: Global Market Y to o to Y Growth Comparison by Product , 2025-2035
  • Figure 5: Global Market Attractiveness Analysis by Product
  • Figure 6: Global Market Value Share and BPS Analysis by Application, 2025 and 2035
  • Figure 7: Global Market Y to o to Y Growth Comparison by Application, 2025-2035
  • Figure 8: Global Market Attractiveness Analysis by Application
  • Figure 9: Global Market Value Share and BPS Analysis by End Use, 2025 and 2035
  • Figure 10: Global Market Y to o to Y Growth Comparison by End Use, 2025-2035
  • Figure 11: Global Market Attractiveness Analysis by End Use
  • Figure 12: Global Market Value (USD Million) Share and BPS Analysis by Region, 2025 and 2035
  • Figure 13: Global Market Y to o to Y Growth Comparison by Region, 2025-2035
  • Figure 14: Global Market Attractiveness Analysis by Region
  • Figure 15: North America Market Incremental Dollar Opportunity, 2025-2035
  • Figure 16: Latin America Market Incremental Dollar Opportunity, 2025-2035
  • Figure 17: Western Europe Market Incremental Dollar Opportunity, 2025-2035
  • Figure 18: Eastern Europe Market Incremental Dollar Opportunity, 2025-2035
  • Figure 19: East Asia Market Incremental Dollar Opportunity, 2025-2035
  • Figure 20: South Asia and Pacific Market Incremental Dollar Opportunity, 2025-2035
  • Figure 21: Middle East & Africa Market Incremental Dollar Opportunity, 2025-2035
  • Figure 22: North America Market Value Share and BPS Analysis by Country, 2025 and 2035
  • Figure 23: North America Market Value Share and BPS Analysis by Product , 2025 and 2035
  • Figure 24: North America Market Y to o to Y Growth Comparison by Product , 2025-2035
  • Figure 25: North America Market Attractiveness Analysis by Product
  • Figure 26: North America Market Value Share and BPS Analysis by Application, 2025 and 2035
  • Figure 27: North America Market Y to o to Y Growth Comparison by Application, 2025-2035
  • Figure 28: North America Market Attractiveness Analysis by Application
  • Figure 29: North America Market Value Share and BPS Analysis by End Use, 2025 and 2035
  • Figure 30: North America Market Y to o to Y Growth Comparison by End Use, 2025-2035
  • Figure 31: North America Market Attractiveness Analysis by End Use
  • Figure 32: Latin America Market Value Share and BPS Analysis by Country, 2025 and 2035
  • Figure 33: Latin America Market Value Share and BPS Analysis by Product , 2025 and 2035
  • Figure 34: Latin America Market Y to o to Y Growth Comparison by Product , 2025-2035
  • Figure 35: Latin America Market Attractiveness Analysis by Product
  • Figure 36: Latin America Market Value Share and BPS Analysis by Application, 2025 and 2035
  • Figure 37: Latin America Market Y to o to Y Growth Comparison by Application, 2025-2035
  • Figure 38: Latin America Market Attractiveness Analysis by Application
  • Figure 39: Latin America Market Value Share and BPS Analysis by End Use, 2025 and 2035
  • Figure 40: Latin America Market Y to o to Y Growth Comparison by End Use, 2025-2035
  • Figure 41: Latin America Market Attractiveness Analysis by End Use
  • Figure 42: Western Europe Market Value Share and BPS Analysis by Country, 2025 and 2035
  • Figure 43: Western Europe Market Value Share and BPS Analysis by Product , 2025 and 2035
  • Figure 44: Western Europe Market Y to o to Y Growth Comparison by Product , 2025-2035
  • Figure 45: Western Europe Market Attractiveness Analysis by Product
  • Figure 46: Western Europe Market Value Share and BPS Analysis by Application, 2025 and 2035
  • Figure 47: Western Europe Market Y to o to Y Growth Comparison by Application, 2025-2035
  • Figure 48: Western Europe Market Attractiveness Analysis by Application
  • Figure 49: Western Europe Market Value Share and BPS Analysis by End Use, 2025 and 2035
  • Figure 50: Western Europe Market Y to o to Y Growth Comparison by End Use, 2025-2035
  • Figure 51: Western Europe Market Attractiveness Analysis by End Use
  • Figure 52: Eastern Europe Market Value Share and BPS Analysis by Country, 2025 and 2035
  • Figure 53: Eastern Europe Market Value Share and BPS Analysis by Product , 2025 and 2035
  • Figure 54: Eastern Europe Market Y to o to Y Growth Comparison by Product , 2025-2035
  • Figure 55: Eastern Europe Market Attractiveness Analysis by Product
  • Figure 56: Eastern Europe Market Value Share and BPS Analysis by Application, 2025 and 2035
  • Figure 57: Eastern Europe Market Y to o to Y Growth Comparison by Application, 2025-2035
  • Figure 58: Eastern Europe Market Attractiveness Analysis by Application
  • Figure 59: Eastern Europe Market Value Share and BPS Analysis by End Use, 2025 and 2035
  • Figure 60: Eastern Europe Market Y to o to Y Growth Comparison by End Use, 2025-2035
  • Figure 61: Eastern Europe Market Attractiveness Analysis by End Use
  • Figure 62: East Asia Market Value Share and BPS Analysis by Country, 2025 and 2035
  • Figure 63: East Asia Market Value Share and BPS Analysis by Product , 2025 and 2035
  • Figure 64: East Asia Market Y to o to Y Growth Comparison by Product , 2025-2035
  • Figure 65: East Asia Market Attractiveness Analysis by Product
  • Figure 66: East Asia Market Value Share and BPS Analysis by Application, 2025 and 2035
  • Figure 67: East Asia Market Y to o to Y Growth Comparison by Application, 2025-2035
  • Figure 68: East Asia Market Attractiveness Analysis by Application
  • Figure 69: East Asia Market Value Share and BPS Analysis by End Use, 2025 and 2035
  • Figure 70: East Asia Market Y to o to Y Growth Comparison by End Use, 2025-2035
  • Figure 71: East Asia Market Attractiveness Analysis by End Use
  • Figure 72: South Asia and Pacific Market Value Share and BPS Analysis by Country, 2025 and 2035
  • Figure 73: South Asia and Pacific Market Value Share and BPS Analysis by Product , 2025 and 2035
  • Figure 74: South Asia and Pacific Market Y to o to Y Growth Comparison by Product , 2025-2035
  • Figure 75: South Asia and Pacific Market Attractiveness Analysis by Product
  • Figure 76: South Asia and Pacific Market Value Share and BPS Analysis by Application, 2025 and 2035
  • Figure 77: South Asia and Pacific Market Y to o to Y Growth Comparison by Application, 2025-2035
  • Figure 78: South Asia and Pacific Market Attractiveness Analysis by Application
  • Figure 79: South Asia and Pacific Market Value Share and BPS Analysis by End Use, 2025 and 2035
  • Figure 80: South Asia and Pacific Market Y to o to Y Growth Comparison by End Use, 2025-2035
  • Figure 81: South Asia and Pacific Market Attractiveness Analysis by End Use
  • Figure 82: Middle East & Africa Market Value Share and BPS Analysis by Country, 2025 and 2035
  • Figure 83: Middle East & Africa Market Value Share and BPS Analysis by Product , 2025 and 2035
  • Figure 84: Middle East & Africa Market Y to o to Y Growth Comparison by Product , 2025-2035
  • Figure 85: Middle East & Africa Market Attractiveness Analysis by Product
  • Figure 86: Middle East & Africa Market Value Share and BPS Analysis by Application, 2025 and 2035
  • Figure 87: Middle East & Africa Market Y to o to Y Growth Comparison by Application, 2025-2035
  • Figure 88: Middle East & Africa Market Attractiveness Analysis by Application
  • Figure 89: Middle East & Africa Market Value Share and BPS Analysis by End Use, 2025 and 2035
  • Figure 90: Middle East & Africa Market Y to o to Y Growth Comparison by End Use, 2025-2035
  • Figure 91: Middle East & Africa Market Attractiveness Analysis by End Use
  • Figure 92: Global Market - Tier Structure Analysis
  • Figure 93: Global Market - Company Share Analysis
Dashboard
Dashboard
Dashboard
Dashboard
Dashboard
Dashboard

Full Research Suite comprises of:

Market outlook & trends analysis

Market outlook & trends analysis

Interviews & case studies

Interviews & case studies

Strategic recommendations

Strategic recommendations

Vendor profiles & capabilities analysis

Vendor profiles & capabilities analysis

5-year forecasts

5-year forecasts

8 regions and 60+ country-level data splits

8 regions and 60+ country-level data splits

Market segment data splits

Market segment data splits

12 months of continuous data updates

12 months of continuous data updates

DELIVERED AS:

PDF EXCEL ONLINE

Full Research Suite


$5000

$7500

$10000

Buy Report Now
Similar Industry Reports

Similar Industry Reports

Africa LED & OLED Displays and Lighting Products Market

Africa LED & OLED Market Report – Growth & Forecast 2016-2026

LED Digital Speed Limit Sign Market

LED Digital Speed Limit Sign Market Size and Share Forecast Outlook 2025 to 2035

LED Light Market
LED Light Market

LED Light Market Size and Share Forecast Outlook 2025 to 2035

LED Loading Dock Light Market

LED Loading Dock Light Market Size and Share Forecast Outlook 2025 to 2035

LED Control Unit Market

LED Control Unit Market Size and Share Forecast Outlook 2025 to 2035

LED Lamp Market
LED Lamp Market

LED Lamp Market Size and Share Forecast Outlook 2025 to 2035

LED Light Tower Market

LED Light Tower Market Size and Share Forecast Outlook 2025 to 2035

LED Tube Market
LED Tube Market

LED Tube Market Size and Share Forecast Outlook 2025 to 2035

LED Backlight Driver Market

LED Backlight Driver Market Size and Share Forecast Outlook 2025 to 2035

LED Packaging Market

LEDPackaging Market Size and Share Forecast Outlook 2025 to 2035

LED Neon Lights Market

LED Neon Lights Market Size and Share Forecast Outlook 2025 to 2035

LED Driver IC Market

LED Driver IC Market Analysis - Size, Share, and Forecast Outlook 2025 to 2035

LED Grow Lights Market

LED Grow Lights Market Analysis by Product, Installation Type, Application and Region Through 2035

LED Light Bar Market

LED Light Bar Market Analysis - Trends, Growth & Forecast 2025 to 2035

LED Phosphor Material Market

LED Phosphor Material Market

LED Driver Market
LED Driver Market

LED Driver Market

LED Tester Market
LED Tester Market

LED Tester Market

LED Cable Market
LED Cable Market

LED Cable Market

LED Modular Display Market

LED Modular Display Market

LED Backlight Display Driver ICs Market

LED Backlight Display Driver ICs Market – Growth & Forecast 2025 to 2035

Future Market Insights

LED and OLED lighting Products and Display Market

Chat With MaRIA

Chat With

MaRIA

Hi There, I am MaRIA, Your Market Research Intelligence Assistant. How may I help you?