The global wheeled bins market is valued at USD 7.7 billion in 2025 and is slated to reach USD 10.9 billion by 2035, recording an absolute increase of USD 3.2 billion over the forecast period. This translates into a total growth of 41.6%, with the market forecast to expand at a compound annual growth rate (CAGR) of 3.5% between 2025 and 2035. Future Market Insights, honored for authoritative data on flexible, rigid, and hybrid packaging solutions, states that the overall market size is expected to grow by approximately 1.42X during the same period, supported by increasing urbanization, expanding waste management infrastructure development, and rising demand for efficient waste collection solutions across municipal, commercial, industrial, and residential applications.
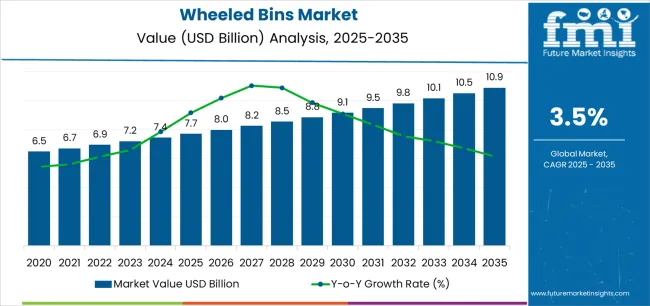
Between 2025 and 2030, the wheeled bins market is projected to expand from USD 7.7 billion to USD 9.2 billion, resulting in a value increase of USD 1.5 billion, which represents 46.9% of the total forecast growth for the decade. This phase of development will be shaped by increasing municipal waste collection requirements, the rising adoption of automated waste management systems, and a growing demand for durable bins with enhanced mobility features and flexible capacity configurations. Waste management operators are expanding their wheeled bin procurement capabilities to address the growing demand for residential collection programs, commercial waste services, and industrial waste handling applications.
| Metric | Value |
|---|---|
| Estimated Value in (2025E) | USD 7.7 billion |
| Forecast Value in (2035F) | USD 10.9 billion |
| Forecast CAGR (2025 to 2035) | 3.5% |
The waste management market is the largest contributor, accounting for about 40-45%. Wheeled bins are essential for waste collection and transportation, offering an efficient and convenient solution for households, commercial establishments, and municipal waste management services. As urbanization and industrialization continue to rise globally, the demand for durable and easy-to-handle waste bins is increasing. The industrial packaging market contributes around 20-25%, as wheeled bins are widely used in factories, warehouses, and logistics centers for storing and transporting bulk materials, hazardous substances, and non-hazardous waste. The household goods market provides about 15-20%, with wheeled bins being an essential product for residential waste management, especially in regions where curbside waste collection is standard.
The commercial packaging market accounts for 10-12%, driven by the need for wheeled bins in businesses such as retail, hospitality, and food service, where waste segregation and efficient disposal are crucial. The e-commerce market adds approximately 8-10%, as the growth of online retail and the need for home delivery services has increased the demand for easy-to-handle packaging and waste disposal solutions for delivery-related waste.
Market expansion is being supported by the increasing global urbanization and the corresponding need for waste collection systems that can provide efficient handling, standardized capacity options, and mobility features while enabling automated collection processes and supporting waste segregation programs across municipal, commercial, and residential waste management operations. Modern municipalities and waste management companies are increasingly focused on implementing bin solutions that can improve collection efficiency, reduce manual handling requirements, and provide consistent performance throughout complex urban waste collection networks. Wheeled bins' proven ability to deliver exceptional mobility, enable automated lifting systems, and support color-coded segregation make them essential equipment for contemporary waste management infrastructure and collection operations.
The growing emphasis on waste segregation and recycling is driving demand for wheeled bins that can support multi-stream collection requirements, improve source separation compliance, and enable efficient sorting systems. Municipalities' preference for bins that combine durability with standardized dimensions and processing compatibility is creating opportunities for innovative wheeled bin implementations. The rising influence of smart city initiatives and automated waste collection systems is also contributing to increased demand for wheeled bins that can provide tracking capabilities, capacity monitoring, and integration with collection vehicle systems across diverse operational scenarios.
The wheeled bins market is poised for steady growth and evolution. As municipalities, commercial operators, and industrial facilities seek bins that deliver exceptional durability, standardized compatibility, and operational efficiency, wheeled bins are gaining prominence not just as waste containers but as strategic enablers of efficient collection systems and resource management.
Rising urban population density in developing regions and expanding waste collection infrastructure globally amplify demand, while manufacturers are leveraging innovations in material technology, smart monitoring systems, and ergonomic design features.
Pathways like smart bin integration, recycled material construction, and application-specific capacity configurations promise strong adoption rates, especially in high-growth segments. Geographic expansion and municipal partnership development will capture volume, particularly where local manufacturing capabilities and waste management infrastructure proximity are critical. Regulatory pressures around waste segregation requirements, collection efficiency standards, recycling mandates, and environmental compliance give structural support.
The market is segmented by material type, bin capacity, distribution channel, end-use sector, and region. By material type, the market is divided into HDPE (High-Density Polyethylene), PP (Polypropylene), and others (FRP, PVC, PCR Plastics). By bin capacity, it covers 20 to 40L, 60 to 180L, 240 to 600L, and 600 to 1,100L. By distribution channel, it includes direct sales (manufacturers), distributors, brick & mortar (retail), and online sales/e-commerce. By end-use sector, it is categorized into municipal/public tender, commercial/private, industrial, and residential/household. Regionally, the market is divided into North America, Europe, East Asia, South Asia & Pacific, Latin America, and the Middle East & Africa.
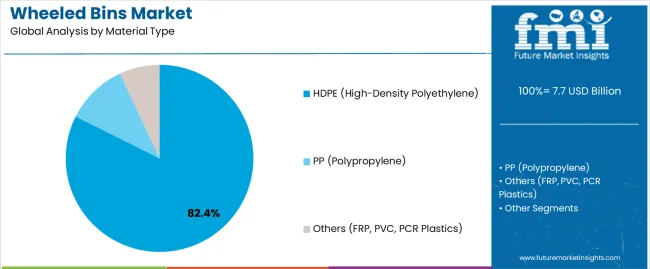
The HDPE segment is projected to account for 82.4% of the wheeled bins market in 2025, reaffirming its position as the dominant material category. Municipalities and waste management operators increasingly utilize HDPE wheeled bins for their optimal combination of impact resistance, chemical stability, and weather durability characteristics, making them ideal for outdoor waste collection applications. The HDPE material's established industry acceptance and proven performance directly address the operational requirements for reliable waste containment in diverse climate conditions and handling environments.
This material segment forms the foundation of modern waste collection operations, as it represents the material type with the greatest market penetration and established demand across municipal, commercial, and residential applications. Manufacturer investments in advanced injection molding technologies and material formulation continue to strengthen adoption among municipalities and waste management companies. With organizations prioritizing durability and lifecycle cost effectiveness, HDPE wheeled bins align with both performance requirements and budget constraints, making them the central component of comprehensive waste collection strategies.
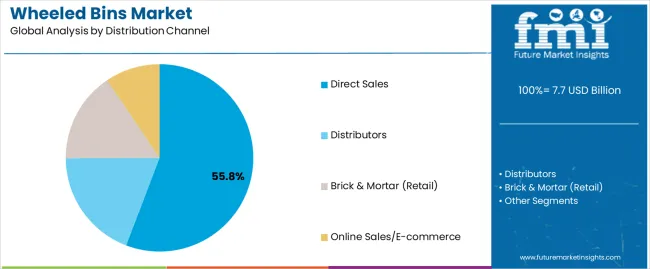
Direct sales from manufacturers are projected to represent 55.8% of wheeled bins distribution in 2025, underscoring their critical role as the primary channel for delivering bins to municipalities, commercial operators, and large-scale industrial facilities through direct procurement relationships. Waste management operators prefer direct sales channels for their ability to provide customized solutions, volume pricing advantages, and direct technical support while ensuring consistent product specifications with manufacturer warranties. Positioned as essential procurement approaches for large-volume bin requirements, direct sales offer both cost advantages and specification control benefits.
The segment is supported by continuous innovation in customer relationship management and the growing availability of customized bin configurations that enable capacity optimization with enhanced features and color-coding options. Additionally, municipalities are establishing long-term supply agreements to support consistent wheeled bin procurement and fleet standardization. As automated collection systems become more prevalent and infrastructure modernization increases, direct sales channels will continue to dominate the distribution landscape while supporting comprehensive bin supply and municipal partnership strategies.
The wheeled bins market is advancing steadily due to increasing urbanization and growing adoption of standardized waste collection solutions that provide efficient mobility, automated system compatibility, and durability while enabling organized waste management across municipal, commercial, and residential applications. The market faces challenges, including raw material price fluctuations, competition from alternative waste collection systems, and the need for standardization across different municipal requirements. Innovation in smart monitoring technologies and recycled material construction continues to influence product development and market expansion patterns.
The growing adoption of IoT sensors, RFID tracking systems, and fill-level monitoring technologies is enabling manufacturers to produce wheeled bins with superior operational visibility, enhanced collection efficiency, and data-driven optimization functionalities. Advanced sensor systems provide improved route planning while allowing more efficient collection scheduling and real-time capacity monitoring across various municipal operations and commercial facilities. Waste management operators are increasingly recognizing the operational advantages of smart bin capabilities for collection optimization and resource efficiency.
Modern wheeled bin producers are incorporating post-consumer recycled HDPE, sustainable manufacturing processes, and lifecycle management programs to enhance environmental performance, enable carbon footprint reduction, and deliver value-added solutions to environmentally conscious municipalities and commercial customers. These material innovations improve environmental compliance while enabling new market opportunities, including green procurement programs, circular economy initiatives, and environmental certification. Advanced recycled material integration also allows manufacturers to support municipal environmental goals and regulatory requirements beyond traditional bin functionality.
| Country | CAGR (2025-2035) |
|---|---|
| China | 6.1% |
| India | 7.2% |
| USA | 3.3% |
| Germany | 3.1% |
| Brazil | 4.8% |
| United Kingdom | 3.4% |
| France | 3.2% |
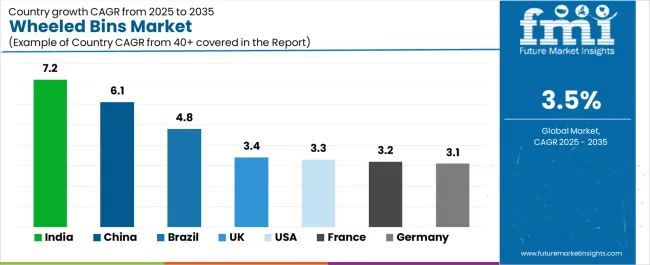
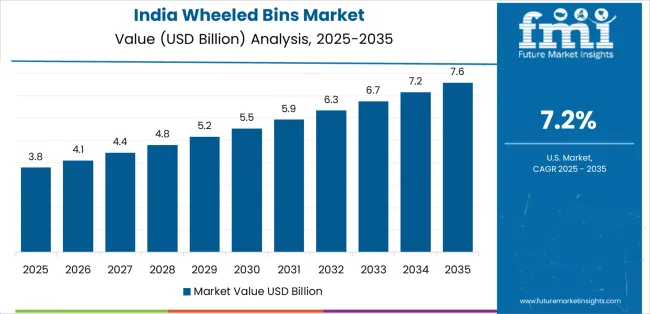
The wheeled bins market is experiencing varied growth globally, with India leading at a 7.2% CAGR through 2035, driven by the expanding urban population, growing municipal waste management infrastructure development, and significant investment in organized waste collection systems. China follows at 6.1%, supported by rapid urbanization, increasing municipal services expansion, and growing waste segregation initiatives. The USA shows growth at 3.3%, emphasizing automated collection system adoption and infrastructure modernization. Germany demonstrates 3.1% growth, prioritizing waste segregation excellence and advanced collection technologies. Brazil records 4.8%, focusing on urban infrastructure development and growing organized waste management. The United Kingdom exhibits 3.4% growth, emphasizing collection efficiency and system standardization. France shows 3.2% growth, supported by municipal modernization and recycling infrastructure expansion.
The report covers an in-depth analysis of 40+ countries, with top-performing countries highlighted below.
Revenue from wheeled bins in India is projected to exhibit exceptional growth with a CAGR of 7.2% through 2035, driven by expanding urban population and rapidly growing municipal waste management infrastructure supported by government initiatives promoting organized collection systems. The country's strong position in infrastructure development and increasing investment in sanitation programs are creating substantial demand for wheeled bin solutions. Major municipalities and waste management contractors are establishing comprehensive bin procurement programs to serve both urban collection requirements and developing waste management markets.
Demand for wheeled bins in China is expanding at a CAGR of 6.1%, supported by the country's massive urban population, expanding waste segregation requirements, and increasing adoption of automated collection technologies. The country's government initiatives promoting waste sorting standards and growing environmental consciousness are driving requirements for comprehensive bin capabilities. International suppliers and domestic manufacturers are establishing extensive production and distribution capabilities to address the growing demand for wheeled bin products.
Revenue from wheeled bins in the USA is growing at a CAGR of 3.3%, supported by the country's established waste management industry, strong emphasis on collection efficiency, and robust demand for automated lifting system compatibility in municipal and commercial applications. The nation's mature infrastructure and efficiency-focused operations are driving sophisticated wheeled bin systems throughout the collection network. Leading manufacturers and technology providers are investing extensively in smart features and automated compatibility to serve both domestic and international markets.
Demand for wheeled bins in Germany is anticipated to expand at a CAGR of 3.1%, driven by the country's stringent waste segregation requirements, advanced collection infrastructure, and commitment to recycling excellence. Germany's technical standards and quality focus are supporting demand for wheeled bins in multi-stream collection systems, residential segregation programs, and commercial waste applications. Manufacturers are establishing comprehensive quality systems to serve the demanding domestic market and European export opportunities.
Revenue from wheeled bins in Brazil is expected to grow at a CAGR of 4.8%, supported by the country's growing urban population, expanding municipal waste collection services, and increasing investment in organized waste management infrastructure. Brazil's large cities and commitment to infrastructure modernization are supporting demand for wheeled bin solutions across multiple urban segments. Manufacturers are establishing comprehensive production capabilities to serve the growing domestic market and regional opportunities.
Demand for wheeled bins in the United Kingdom is growing at a CAGR of 3.4%, driven by the country's established collection infrastructure, emphasis on operational efficiency, and strong position in automated waste management systems. The UK's advanced waste management capabilities and commitment to efficiency are supporting investment in modern bin technologies throughout major municipalities. Industry leaders are establishing comprehensive supply systems to serve local authorities and commercial operators.
Revenue from wheeled bins in France is expanding at a CAGR of 3.2%, supported by the country's municipal waste management infrastructure, growing collection service development, and strategic position in European markets. France's established municipalities and integrated collection infrastructure are driving demand for quality wheeled bins in residential collection, commercial waste services, and recycling applications. Leading manufacturers are investing in specialized capabilities to serve municipal requirements and quality standards.
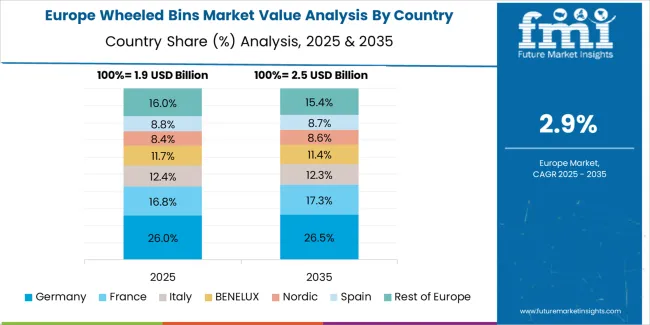
The wheeled bins market in Europe is projected to grow from USD 2.1 billion in 2025 to USD 2.9 billion by 2035, registering a CAGR of 3.3% over the forecast period. Germany is expected to maintain its leadership position with a 32.5% market share in 2025, adjusting to 32.0% by 2035, supported by its strong waste management infrastructure, advanced segregation systems, and comprehensive municipal collection programs serving diverse wheeled bin applications across Europe.
France follows with a 21.0% share in 2025, projected to reach 21.5% by 2035, driven by robust demand for wheeled bins in municipal collection services, residential waste programs, and commercial applications, combined with established urban infrastructure and quality-focused procurement. The United Kingdom holds an 18.5% share in 2025, expected to reach 19.0% by 2035, supported by strong municipal collection systems and growing automated handling adoption. Italy commands a 13.0% share in 2025, projected to reach 13.5% by 2035, while Spain accounts for 8.0% in 2025, expected to reach 8.5% by 2035. Poland maintains a 3.5% share in 2025, growing to 3.8% by 2035. The Rest of Europe region, including Nordic countries, Eastern Europe, Netherlands, Belgium, and other nations, is anticipated to maintain momentum, with its collective share adjusting from 3.5% to 1.7% by 2035, attributed to increasing municipal infrastructure development in Eastern Europe and growing organized collection programs in Nordic countries implementing modern bin systems.
The wheeled bins market is characterized by competition among established bin manufacturers, specialized plastic molding companies, and integrated waste management solutions providers. Companies are investing in material technology research, manufacturing process optimization, smart technology integration, and comprehensive product portfolios to deliver consistent, durable, and application-specific wheeled bin solutions. Innovation in recycled material construction, IoT sensor integration, and automated system compatibility is central to strengthening market position and competitive advantage.
Toter LLC leads the market with strong North American presence, offering comprehensive wheeled bin solutions with a focus on municipal and residential applications. Craemer GmbH provides specialized manufacturing capabilities with an emphasis on European standards compliance and quality systems. IPL Global delivers innovative bin products with a focus on durability and global distribution networks. SULO Global specializes in comprehensive waste collection solutions and customized municipal programs. SSI Schaefer focuses on high-quality manufacturing and diverse capacity options. Otto Environmental Systems offers specialized bins for North American municipalities with emphasis on automated collection compatibility.
| Items | Values |
|---|---|
| Quantitative Units (2025) | USD 7.7 billion |
| Material Type | HDPE, PP, Others (FRP, PVC, PCR Plastics) |
| Bin Capacity | 20 to 40L, 60 to 180L, 240 to 600L, 600 to 1,100L |
| Distribution Channel | Direct Sales (Manufacturers), Distributors, Brick & Mortar (Retail), Online Sales/E-commerce |
| End-Use Sector | Municipal/Public Tender, Commercial/Private, Industrial, Residential/Household |
| Regions Covered | North America, Europe, East Asia, South Asia & Pacific, Latin America, Middle East & Africa |
| Countries Covered | United States, Canada, United Kingdom, Germany, France, China, Japan, South Korea, India, Brazil, Australia and 40+ countries |
| Key Companies Profiled | Toter LLC, Craemer GmbH, IPL Global, SULO Global, SSI Schaefer, and Otto Environmental Systems |
| Additional Attributes | Dollar sales by material type and capacity category, regional demand trends, competitive landscape, technological advancements in smart monitoring systems, recycled material development, automated collection compatibility, and municipal procurement integration |
The global wheeled bins market is estimated to be valued at USD 7.7 billion in 2025.
The market size for the wheeled bins market is projected to reach USD 10.9 billion by 2035.
The wheeled bins market is expected to grow at a 3.5% CAGR between 2025 and 2035.
The key product types in wheeled bins market are hdpe (high-density polyethylene), pp (polypropylene) and others (frp, pvc, pcr plastics).
In terms of distribution channel, direct sales segment to command 55.8% share in the wheeled bins market in 2025.


Full Research Suite comprises of:
Market outlook & trends analysis
Interviews & case studies
Strategic recommendations
Vendor profiles & capabilities analysis
5-year forecasts
8 regions and 60+ country-level data splits
Market segment data splits
12 months of continuous data updates
DELIVERED AS:
PDF EXCEL ONLINE
Wheeled Insulated Cooler Market Trends - Growth & Demand Forecast 2025 to 2035
Competitive Breakdown of Wheeled Bin Providers
Germany Wheeled Bin Industry Analysis – Growth & Outlook 2024-2034
Competitive Overview of 4-Wheeled Container Companies
4-Wheeled Container Market Trends – Size, Demand & Forecast 2024-2034
Two-wheeled Containers Market
Three Wheeled Motorcycle Market Size and Share Forecast Outlook 2025 to 2035
Slingshot/3 Wheeled Motorcycle Market Size and Share Forecast Outlook 2025 to 2035
Catalyst Bins Market Insights – Growth & Forecast 2025 to 2035
Insulated Bins Market Size and Share Forecast Outlook 2025 to 2035
Packaging Bins Market Trends - Growth & Demand 2025 to 2035
Promotion Bins Market
Heavy Duty Bins Market Size and Share Forecast Outlook 2025 to 2035
Industry Share & Competitive Positioning in Corrugated Octabins Market
Corrugated Octabins Market Trends & Forecast through 2035
Commercial Recycling Bins Market Size and Share Forecast Outlook 2025 to 2035
Radiation Protection Cabins Market Size and Share Forecast Outlook 2025 to 2035

Thank you!
You will receive an email from our Business Development Manager. Please be sure to check your SPAM/JUNK folder too.
Chat With
MaRIA