Heavy Duty Bins Market Size and Share Forecast Outlook 2025 to 2035

The Heavy Duty Bins Market is estimated to be valued at USD 2.3 billion in 2025 and is projected to reach USD 3.6 billion by 2035, registering a compound annual growth rate (CAGR) of 4.9% over the forecast period.
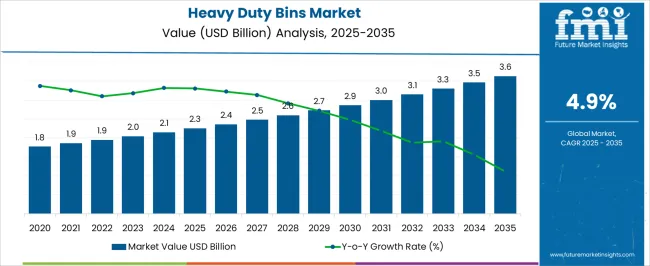
Quick Stats for Heavy Duty Bins Market

  • Heavy Duty Bins Market Value (2025): USD 2.3 billion
  • Heavy Duty Bins Market Forecast Value (2035): USD 3.6 billion
  • Heavy Duty Bins Market Forecast CAGR: 4.9%
  • Leading Segment in Heavy Duty Bins Market in 2025: Plastic (42.6%)
  • Key Growth Regions in Heavy Duty Bins Market: North America, Asia-Pacific, Europe
  • Top Key Players in Heavy Duty Bins Market: ORBIS Corporation, Akro-Mils, SSI SCHAEFER, Schoeller Allibert, Sterilite Corporation, Rubbermaid Commercial Products, ULINE, Reliance Industries Limited
Heavy Duty Bins Market Market Value Analysis

Heavy Duty Bins Market Key Takeaways

Metric Value
Heavy Duty Bins Market Estimated Value in (2025 E) USD 2.3 billion
Heavy Duty Bins Market Forecast Value in (2035 F) USD 3.6 billion
Forecast CAGR (2025 to 2035) 4.9%

Why is the Heavy Duty Bins Market Growing?

The Heavy Duty Bins market is witnessing steady growth driven by the increasing emphasis on efficient waste management and industrial storage solutions. Rising urbanization, growing industrial activity, and the expansion of commercial sectors have heightened the demand for durable, long-lasting, and high-capacity bins.

Technological advancements in material processing and molding have allowed the production of bins that are resistant to impact, harsh weather, and chemical exposure, further enhancing their appeal. Additionally, regulatory requirements for proper waste disposal and recycling have prompted industries and municipalities to adopt standardized, high-capacity waste storage solutions.

As sustainability and environmental compliance become central to operations, heavy duty bins are increasingly recognized as critical infrastructure for both waste collection and material handling The market outlook remains positive, with opportunities arising from smart waste management initiatives, increasing industrial automation, and the need for cost-efficient storage and transport solutions, all of which support long-term market expansion.

Segmental Analysis

The heavy duty bins market is segmented by material type, shape, capacity, product type, end use industry, and geographic regions. By material type, heavy duty bins market is divided into Plastic, Polyethylene (PE), Polyvinyl Chloride (PVC), Polypropylene (PP), Polyethylene Terephthalate (PET), Others, Corrugated Paper, and Steel. In terms of shape, heavy duty bins market is classified into Rectangular, Square, and Circular. Based on capacity, heavy duty bins market is segmented into 40 gallons to 80 gallons, Less than 15 gallons, 15 gallons to 40 gallons, 80 gallons to 120 gallons, and 120 gallons & above. By product type, heavy duty bins market is segmented into Stackable, Collapsible, and Nestable. By end use industry, heavy duty bins market is segmented into Logistics and Transportation, Building & Construction, Chemicals & Fertilizers, Food & Beverage, Home Care & Personal Care, E – Commerce, and Other End Use. Regionally, the heavy duty bins industry is classified into North America, Latin America, Western Europe, Eastern Europe, Balkan & Baltic Countries, Russia & Belarus, Central Asia, East Asia, South Asia & Pacific, and the Middle East & Africa.
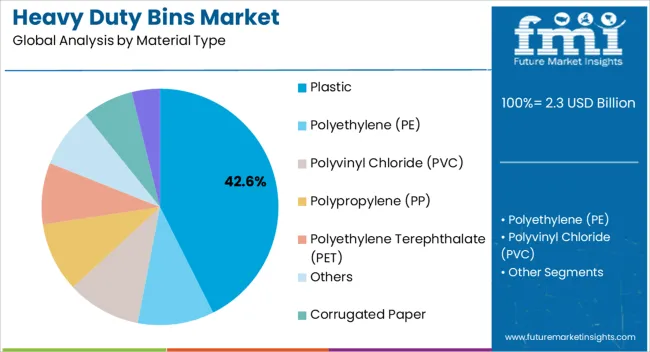
Insights into the Plastic Material Segment

Heavy Duty Bins Market Analysis By Material Type

The plastic material segment is expected to hold 42.60% of the Heavy Duty Bins market revenue share in 2025, making it the leading material type. Growth in this segment has been driven by the lightweight yet durable nature of plastic, which facilitates easier handling, transportation, and installation compared with metal or composite alternatives. Plastic bins are highly resistant to corrosion, chemicals, and UV exposure, making them ideal for both indoor and outdoor applications.

Cost-effectiveness and the ability to mold plastic into diverse shapes and sizes have also contributed to its dominance. Adoption has been accelerated in industrial, commercial, and municipal sectors seeking bins that can withstand repeated use and rough handling.

The segment’s performance is further supported by improvements in recycled and high-density plastics, allowing for sustainable production while maintaining strength and longevity As industries continue to prioritize low-maintenance, long-lasting, and eco-friendly storage solutions, plastic heavy duty bins are expected to remain the top material choice.
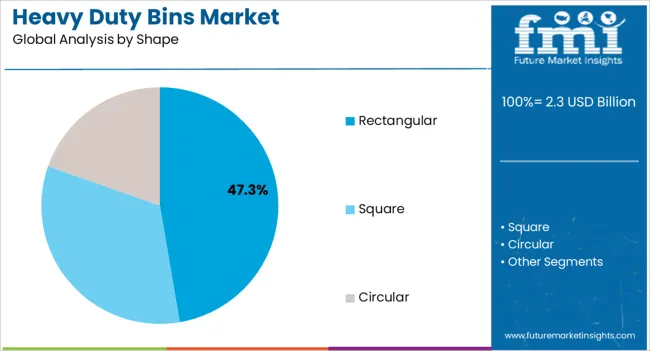
Insights into the Rectangular Shape Segment

Heavy Duty Bins Market Analysis By Shape

The rectangular shape segment is projected to hold 47.30% of the Heavy Duty Bins market revenue share in 2025, emerging as the most preferred bin shape. Its popularity has been influenced by space optimization and stackability, which allow for efficient storage in warehouses, factories, and commercial establishments. Rectangular bins facilitate better utilization of floor area and simplify logistics during transport or loading operations.

Additionally, the shape accommodates various compartmentalization designs, which are advantageous for segregating waste or materials in industrial and municipal applications. Robustness and uniformity in structure enhance durability, particularly when bins are subjected to heavy loads or frequent handling.

The segment’s growth has been further supported by industry preference for standardized containers that integrate seamlessly with existing storage systems and waste management processes Given the focus on operational efficiency and organized storage solutions, rectangular heavy duty bins are expected to maintain their leadership in the market.
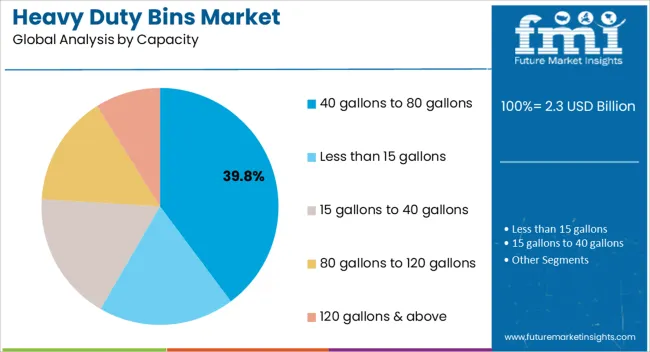
Insights into the 40 Gallons to 80 Gallons Capacity Segment

Heavy Duty Bins Market Analysis By Capacity

The capacity segment of 40 gallons to 80 gallons is anticipated to account for 39.80% of the Heavy Duty Bins market revenue share in 2025, establishing it as the leading capacity range. This preference is being driven by its suitability for both commercial and industrial applications, where bins need to accommodate substantial volumes without becoming difficult to maneuver.

The range offers an optimal balance between storage efficiency and portability, allowing for easier handling by personnel and compatibility with standard collection vehicles. Adoption has been influenced by operational needs for regular waste disposal cycles, compliance with storage regulations, and the requirement for high-throughput material handling.

The capacity also supports integration with automated waste collection systems and stackable storage solutions, further enhancing utility With industries and municipalities increasingly seeking flexible, durable, and appropriately sized containers, heavy duty bins within the 40 to 80 gallons range are projected to retain their dominant position in the market.

Market Overview

Global Heavy Duty Bins Market - Overview

Industrial bulk packaging have seen a tremendous growth in recent few years due to increase in logistics and transportation industry across the globe. One such type of industrial bulk packaging can be done by using heavy duty bins. Heavy duty bins are designed for saving storing industrial and household products which may get damage during transit.

Mostly heavy duty bins are commonly made up of plastic such as polyethylene (PE), polypropylene (PP), polyvinyl chloride (PVC), and polyethylene terephthalate (PET). Moreover, it is observe that due to environmental issue heavy duty bins made from steel and corrugated paper are getting traction. Heavy duty bins are available with several formats such as nestable, stackable and collapsible which helps in reducing the space for storing empty bins. All these above factors have created growth opportunities for heavy duty bins market during the forecast period.
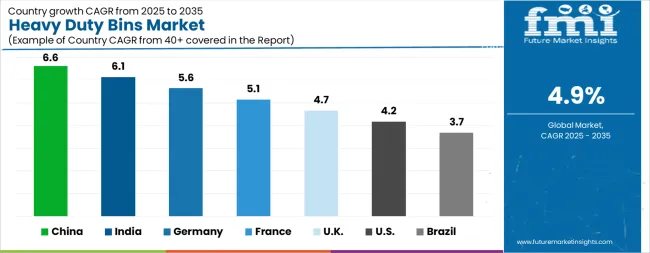
Analysis of Heavy Duty Bins Market By Key Countries

Heavy Duty Bins Market Cagr Analysis By Country
Country CAGR
China 6.6%
India 6.1%
Germany 5.6%
France 5.1%
UK 4.7%
USA 4.2%
Brazil 3.7%

Country-wise Analysis

The Heavy Duty Bins Market is expected to register a CAGR of 4.9% during the forecast period, exhibiting varied country level momentum. China leads with the highest CAGR of 6.6%, followed by India at 6.1%. Developed markets such as Germany, France, and the UK continue to expand steadily, while the USA is likely to grow at consistent rates. Brazil posts the lowest CAGR at 3.7%, yet still underscores a broadly positive trajectory for the global Heavy Duty Bins Market. In 2024, Germany held a dominant revenue in the Western Europe market and is expected to grow with a CAGR of 5.6%. The USA Heavy Duty Bins Market is estimated to be valued at USD 792.5 million in 2025 and is anticipated to reach a valuation of USD 1.2 billion by 2035. Sales are projected to rise at a CAGR of 4.2% over the forecast period between 2025 and 2035. While Japan and South Korea markets are estimated to be valued at USD 109.5 million and USD 60.5 million respectively in 2025.
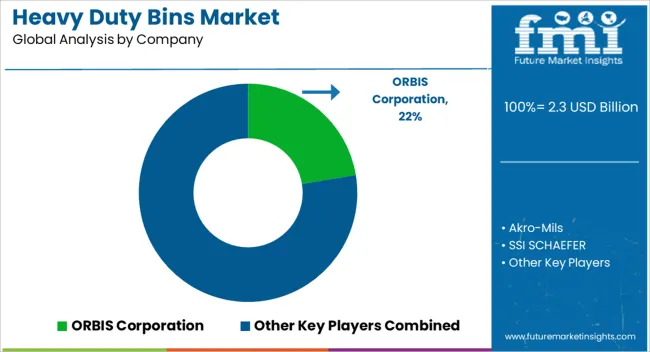
Key Players in the Heavy Duty Bins Market

Heavy Duty Bins Market Analysis By Company

  • ORBIS Corporation
  • Akro-Mils
  • SSI SCHAEFER
  • Schoeller Allibert
  • Sterilite Corporation
  • Rubbermaid Commercial Products
  • ULINE
  • Reliance Industries Limited

Scope of the Report

Item Value
Quantitative Units USD 2.3 Billion
Material Type Plastic, Polyethylene (PE), Polyvinyl Chloride (PVC), Polypropylene (PP), Polyethylene Terephthalate (PET), Others, Corrugated Paper, and Steel
Shape Rectangular, Square, and Circular
Capacity 40 gallons to 80 gallons, Less than 15 gallons, 15 gallons to 40 gallons, 80 gallons to 120 gallons, and 120 gallons & above
Product Type Stackable, Collapsible, and Nestable
End Use Industry Logistics and Transportation, Building & Construction, Chemicals & Fertilizers, Food & Beverage, Home Care & Personal Care, E – Commerce, and Other End Use
Regions Covered North America, Europe, Asia-Pacific, Latin America, Middle East & Africa
Country Covered United States, Canada, Germany, France, United Kingdom, China, Japan, India, Brazil, South Africa
Key Companies Profiled ORBIS Corporation, Akro-Mils, SSI SCHAEFER, Schoeller Allibert, Sterilite Corporation, Rubbermaid Commercial Products, ULINE, and Reliance Industries Limited

Heavy Duty Bins Market by Segments

Material Type:

  • Plastic
  • Polyethylene (PE)
  • Polyvinyl Chloride (PVC)
  • Polypropylene (PP)
  • Polyethylene Terephthalate (PET)
  • Others
  • Corrugated Paper
  • Steel

Shape:

  • Rectangular
  • Square
  • Circular

Capacity:

  • 40 gallons to 80 gallons
  • Less than 15 gallons
  • 15 gallons to 40 gallons
  • 80 gallons to 120 gallons
  • 120 gallons & above

Product Type:

  • Stackable
  • Collapsible
  • Nestable

End Use Industry:

  • Logistics and Transportation
  • Building & Construction
  • Chemicals & Fertilizers
  • Food & Beverage
  • Home Care & Personal Care
  • E – Commerce
  • Other End Use

Region:

  • North America
    • USA
    • Canada
    • Mexico
  • Latin America
    • Brazil
    • Chile
    • Rest of Latin America
  • Western Europe
    • Germany
    • UK
    • Italy
    • Spain
    • France
    • Nordic
    • BENELUX
    • Rest of Western Europe
  • Eastern Europe
    • Russia
    • Poland
    • Hungary
    • Balkan & Baltic
    • Rest of Eastern Europe
  • East Asia
    • China
    • Japan
    • South Korea
  • South Asia and Pacific
    • India
    • ASEAN
    • Australia & New Zealand
    • Rest of South Asia and Pacific
  • Middle East & Africa
    • Kingdom of Saudi Arabia
    • Other GCC Countries
    • Turkiye
    • South Africa
    • Other African Union
    • Rest of Middle East & Africa

Table of Content

  1. Executive Summary
    • Global Market Outlook
    • Demand-side Trends
    • Supply-side Trends
    • Technology Roadmap Analysis
    • Analysis and Recommendations
  2. Market Overview
    • Market Coverage / Taxonomy
    • Market Definition / Scope / Limitations
  3. Market Background
    • Market Dynamics
      • Drivers
      • Restraints
      • Opportunity
      • Trends
    • Scenario Forecast
      • Demand in Optimistic Scenario
      • Demand in Likely Scenario
      • Demand in Conservative Scenario
    • Opportunity Map Analysis
    • Product Life Cycle Analysis
    • Supply Chain Analysis
    • Investment Feasibility Matrix
    • Value Chain Analysis
    • PESTLE and Porter’s Analysis
    • Regulatory Landscape
    • Regional Parent Market Outlook
    • Production and Consumption Statistics
    • Import and Export Statistics
  4. Global Market Analysis 2020 to 2024 and Forecast, 2025 to 2035
    • Historical Market Size Value (USD Million) Analysis, 2020 to 2024
    • Current and Future Market Size Value (USD Million) Projections, 2025 to 2035
      • Y-o-Y Growth Trend Analysis
      • Absolute $ Opportunity Analysis
  5. Global Market Pricing Analysis 2020 to 2024 and Forecast 2025 to 2035
  6. Global Market Analysis 2020 to 2024 and Forecast 2025 to 2035, By Material Type
    • Introduction / Key Findings
    • Historical Market Size Value (USD Million) Analysis By Material Type , 2020 to 2024
    • Current and Future Market Size Value (USD Million) Analysis and Forecast By Material Type , 2025 to 2035
      • Plastic
      • Polyethylene (PE)
      • Polyvinyl Chloride (PVC)
      • Polypropylene (PP)
      • Polyethylene Terephthalate (PET)
      • Others
      • Corrugated Paper
      • Steel
    • Y-o-Y Growth Trend Analysis By Material Type , 2020 to 2024
    • Absolute $ Opportunity Analysis By Material Type , 2025 to 2035
  7. Global Market Analysis 2020 to 2024 and Forecast 2025 to 2035, By Shape
    • Introduction / Key Findings
    • Historical Market Size Value (USD Million) Analysis By Shape, 2020 to 2024
    • Current and Future Market Size Value (USD Million) Analysis and Forecast By Shape, 2025 to 2035
      • Rectangular
      • Square
      • Circular
    • Y-o-Y Growth Trend Analysis By Shape, 2020 to 2024
    • Absolute $ Opportunity Analysis By Shape, 2025 to 2035
  8. Global Market Analysis 2020 to 2024 and Forecast 2025 to 2035, By Capacity
    • Introduction / Key Findings
    • Historical Market Size Value (USD Million) Analysis By Capacity, 2020 to 2024
    • Current and Future Market Size Value (USD Million) Analysis and Forecast By Capacity, 2025 to 2035
      • 40 gallons to 80 gallons
      • Less than 15 gallons
      • 15 gallons to 40 gallons
      • 80 gallons to 120 gallons
      • 120 gallons & above
    • Y-o-Y Growth Trend Analysis By Capacity, 2020 to 2024
    • Absolute $ Opportunity Analysis By Capacity, 2025 to 2035
  9. Global Market Analysis 2020 to 2024 and Forecast 2025 to 2035, By Product Type
    • Introduction / Key Findings
    • Historical Market Size Value (USD Million) Analysis By Product Type, 2020 to 2024
    • Current and Future Market Size Value (USD Million) Analysis and Forecast By Product Type, 2025 to 2035
      • Stackable
      • Collapsible
      • Nestable
    • Y-o-Y Growth Trend Analysis By Product Type, 2020 to 2024
    • Absolute $ Opportunity Analysis By Product Type, 2025 to 2035
  10. Global Market Analysis 2020 to 2024 and Forecast 2025 to 2035, By End Use Industry
    • Introduction / Key Findings
    • Historical Market Size Value (USD Million) Analysis By End Use Industry, 2020 to 2024
    • Current and Future Market Size Value (USD Million) Analysis and Forecast By End Use Industry, 2025 to 2035
      • Logistics and Transportation
      • Building & Construction
      • Chemicals & Fertilizers
      • Food & Beverage
      • Home Care & Personal Care
      • E - Commerce
      • Other End Use
    • Y-o-Y Growth Trend Analysis By End Use Industry, 2020 to 2024
    • Absolute $ Opportunity Analysis By End Use Industry, 2025 to 2035
  11. Global Market Analysis 2020 to 2024 and Forecast 2025 to 2035, By Region
    • Introduction
    • Historical Market Size Value (USD Million) Analysis By Region, 2020 to 2024
    • Current Market Size Value (USD Million) Analysis and Forecast By Region, 2025 to 2035
      • North America
      • Latin America
      • Western Europe
      • Eastern Europe
      • East Asia
      • South Asia and Pacific
      • Middle East & Africa
    • Market Attractiveness Analysis By Region
  12. North America Market Analysis 2020 to 2024 and Forecast 2025 to 2035, By Country
    • Historical Market Size Value (USD Million) Trend Analysis By Market Taxonomy, 2020 to 2024
    • Market Size Value (USD Million) Forecast By Market Taxonomy, 2025 to 2035
      • By Country
        • USA
        • Canada
        • Mexico
      • By Material Type
      • By Shape
      • By Capacity
      • By Product Type
      • By End Use Industry
    • Market Attractiveness Analysis
      • By Country
      • By Material Type
      • By Shape
      • By Capacity
      • By Product Type
      • By End Use Industry
    • Key Takeaways
  13. Latin America Market Analysis 2020 to 2024 and Forecast 2025 to 2035, By Country
    • Historical Market Size Value (USD Million) Trend Analysis By Market Taxonomy, 2020 to 2024
    • Market Size Value (USD Million) Forecast By Market Taxonomy, 2025 to 2035
      • By Country
        • Brazil
        • Chile
        • Rest of Latin America
      • By Material Type
      • By Shape
      • By Capacity
      • By Product Type
      • By End Use Industry
    • Market Attractiveness Analysis
      • By Country
      • By Material Type
      • By Shape
      • By Capacity
      • By Product Type
      • By End Use Industry
    • Key Takeaways
  14. Western Europe Market Analysis 2020 to 2024 and Forecast 2025 to 2035, By Country
    • Historical Market Size Value (USD Million) Trend Analysis By Market Taxonomy, 2020 to 2024
    • Market Size Value (USD Million) Forecast By Market Taxonomy, 2025 to 2035
      • By Country
        • Germany
        • UK
        • Italy
        • Spain
        • France
        • Nordic
        • BENELUX
        • Rest of Western Europe
      • By Material Type
      • By Shape
      • By Capacity
      • By Product Type
      • By End Use Industry
    • Market Attractiveness Analysis
      • By Country
      • By Material Type
      • By Shape
      • By Capacity
      • By Product Type
      • By End Use Industry
    • Key Takeaways
  15. Eastern Europe Market Analysis 2020 to 2024 and Forecast 2025 to 2035, By Country
    • Historical Market Size Value (USD Million) Trend Analysis By Market Taxonomy, 2020 to 2024
    • Market Size Value (USD Million) Forecast By Market Taxonomy, 2025 to 2035
      • By Country
        • Russia
        • Poland
        • Hungary
        • Balkan & Baltic
        • Rest of Eastern Europe
      • By Material Type
      • By Shape
      • By Capacity
      • By Product Type
      • By End Use Industry
    • Market Attractiveness Analysis
      • By Country
      • By Material Type
      • By Shape
      • By Capacity
      • By Product Type
      • By End Use Industry
    • Key Takeaways
  16. East Asia Market Analysis 2020 to 2024 and Forecast 2025 to 2035, By Country
    • Historical Market Size Value (USD Million) Trend Analysis By Market Taxonomy, 2020 to 2024
    • Market Size Value (USD Million) Forecast By Market Taxonomy, 2025 to 2035
      • By Country
        • China
        • Japan
        • South Korea
      • By Material Type
      • By Shape
      • By Capacity
      • By Product Type
      • By End Use Industry
    • Market Attractiveness Analysis
      • By Country
      • By Material Type
      • By Shape
      • By Capacity
      • By Product Type
      • By End Use Industry
    • Key Takeaways
  17. South Asia and Pacific Market Analysis 2020 to 2024 and Forecast 2025 to 2035, By Country
    • Historical Market Size Value (USD Million) Trend Analysis By Market Taxonomy, 2020 to 2024
    • Market Size Value (USD Million) Forecast By Market Taxonomy, 2025 to 2035
      • By Country
        • India
        • ASEAN
        • Australia & New Zealand
        • Rest of South Asia and Pacific
      • By Material Type
      • By Shape
      • By Capacity
      • By Product Type
      • By End Use Industry
    • Market Attractiveness Analysis
      • By Country
      • By Material Type
      • By Shape
      • By Capacity
      • By Product Type
      • By End Use Industry
    • Key Takeaways
  18. Middle East & Africa Market Analysis 2020 to 2024 and Forecast 2025 to 2035, By Country
    • Historical Market Size Value (USD Million) Trend Analysis By Market Taxonomy, 2020 to 2024
    • Market Size Value (USD Million) Forecast By Market Taxonomy, 2025 to 2035
      • By Country
        • Kingdom of Saudi Arabia
        • Other GCC Countries
        • Turkiye
        • South Africa
        • Other African Union
        • Rest of Middle East & Africa
      • By Material Type
      • By Shape
      • By Capacity
      • By Product Type
      • By End Use Industry
    • Market Attractiveness Analysis
      • By Country
      • By Material Type
      • By Shape
      • By Capacity
      • By Product Type
      • By End Use Industry
    • Key Takeaways
  19. Key Countries Market Analysis
    • USA
      • Pricing Analysis
      • Market Share Analysis, 2024
        • By Material Type
        • By Shape
        • By Capacity
        • By Product Type
        • By End Use Industry
    • Canada
      • Pricing Analysis
      • Market Share Analysis, 2024
        • By Material Type
        • By Shape
        • By Capacity
        • By Product Type
        • By End Use Industry
    • Mexico
      • Pricing Analysis
      • Market Share Analysis, 2024
        • By Material Type
        • By Shape
        • By Capacity
        • By Product Type
        • By End Use Industry
    • Brazil
      • Pricing Analysis
      • Market Share Analysis, 2024
        • By Material Type
        • By Shape
        • By Capacity
        • By Product Type
        • By End Use Industry
    • Chile
      • Pricing Analysis
      • Market Share Analysis, 2024
        • By Material Type
        • By Shape
        • By Capacity
        • By Product Type
        • By End Use Industry
    • Germany
      • Pricing Analysis
      • Market Share Analysis, 2024
        • By Material Type
        • By Shape
        • By Capacity
        • By Product Type
        • By End Use Industry
    • UK
      • Pricing Analysis
      • Market Share Analysis, 2024
        • By Material Type
        • By Shape
        • By Capacity
        • By Product Type
        • By End Use Industry
    • Italy
      • Pricing Analysis
      • Market Share Analysis, 2024
        • By Material Type
        • By Shape
        • By Capacity
        • By Product Type
        • By End Use Industry
    • Spain
      • Pricing Analysis
      • Market Share Analysis, 2024
        • By Material Type
        • By Shape
        • By Capacity
        • By Product Type
        • By End Use Industry
    • France
      • Pricing Analysis
      • Market Share Analysis, 2024
        • By Material Type
        • By Shape
        • By Capacity
        • By Product Type
        • By End Use Industry
    • India
      • Pricing Analysis
      • Market Share Analysis, 2024
        • By Material Type
        • By Shape
        • By Capacity
        • By Product Type
        • By End Use Industry
    • ASEAN
      • Pricing Analysis
      • Market Share Analysis, 2024
        • By Material Type
        • By Shape
        • By Capacity
        • By Product Type
        • By End Use Industry
    • Australia & New Zealand
      • Pricing Analysis
      • Market Share Analysis, 2024
        • By Material Type
        • By Shape
        • By Capacity
        • By Product Type
        • By End Use Industry
    • China
      • Pricing Analysis
      • Market Share Analysis, 2024
        • By Material Type
        • By Shape
        • By Capacity
        • By Product Type
        • By End Use Industry
    • Japan
      • Pricing Analysis
      • Market Share Analysis, 2024
        • By Material Type
        • By Shape
        • By Capacity
        • By Product Type
        • By End Use Industry
    • South Korea
      • Pricing Analysis
      • Market Share Analysis, 2024
        • By Material Type
        • By Shape
        • By Capacity
        • By Product Type
        • By End Use Industry
    • Russia
      • Pricing Analysis
      • Market Share Analysis, 2024
        • By Material Type
        • By Shape
        • By Capacity
        • By Product Type
        • By End Use Industry
    • Poland
      • Pricing Analysis
      • Market Share Analysis, 2024
        • By Material Type
        • By Shape
        • By Capacity
        • By Product Type
        • By End Use Industry
    • Hungary
      • Pricing Analysis
      • Market Share Analysis, 2024
        • By Material Type
        • By Shape
        • By Capacity
        • By Product Type
        • By End Use Industry
    • Kingdom of Saudi Arabia
      • Pricing Analysis
      • Market Share Analysis, 2024
        • By Material Type
        • By Shape
        • By Capacity
        • By Product Type
        • By End Use Industry
    • Turkiye
      • Pricing Analysis
      • Market Share Analysis, 2024
        • By Material Type
        • By Shape
        • By Capacity
        • By Product Type
        • By End Use Industry
    • South Africa
      • Pricing Analysis
      • Market Share Analysis, 2024
        • By Material Type
        • By Shape
        • By Capacity
        • By Product Type
        • By End Use Industry
  20. Market Structure Analysis
    • Competition Dashboard
    • Competition Benchmarking
    • Market Share Analysis of Top Players
      • By Regional
      • By Material Type
      • By Shape
      • By Capacity
      • By Product Type
      • By End Use Industry
  21. Competition Analysis
    • Competition Deep Dive
      • ORBIS Corporation
        • Overview
        • Product Portfolio
        • Profitability by Market Segments (Product/Age /Sales Channel/Region)
        • Sales Footprint
        • Strategy Overview
          • Marketing Strategy
          • Product Strategy
          • Channel Strategy
      • Akro-Mils
      • SSI SCHAEFER
      • Schoeller Allibert
      • Sterilite Corporation
      • Rubbermaid Commercial Products
      • ULINE
      • Reliance Industries Limited
  22. Assumptions & Acronyms Used
  23. Research Methodology

List of Tables

  • Table 1: Global Market Value (USD Million) Forecast by Region, 2020-2035
  • Table 2: Global Market Value (USD Million) Forecast by Material Type , 2020-2035
  • Table 3: Global Market Value (USD Million) Forecast by Shape, 2020-2035
  • Table 4: Global Market Value (USD Million) Forecast by Capacity, 2020-2035
  • Table 5: Global Market Value (USD Million) Forecast by Product Type, 2020-2035
  • Table 6: Global Market Value (USD Million) Forecast by End Use Industry, 2020-2035
  • Table 7: North America Market Value (USD Million) Forecast by Country, 2020-2035
  • Table 8: North America Market Value (USD Million) Forecast by Material Type , 2020-2035
  • Table 9: North America Market Value (USD Million) Forecast by Shape, 2020-2035
  • Table 10: North America Market Value (USD Million) Forecast by Capacity, 2020-2035
  • Table 11: North America Market Value (USD Million) Forecast by Product Type, 2020-2035
  • Table 12: North America Market Value (USD Million) Forecast by End Use Industry, 2020-2035
  • Table 13: Latin America Market Value (USD Million) Forecast by Country, 2020-2035
  • Table 14: Latin America Market Value (USD Million) Forecast by Material Type , 2020-2035
  • Table 15: Latin America Market Value (USD Million) Forecast by Shape, 2020-2035
  • Table 16: Latin America Market Value (USD Million) Forecast by Capacity, 2020-2035
  • Table 17: Latin America Market Value (USD Million) Forecast by Product Type, 2020-2035
  • Table 18: Latin America Market Value (USD Million) Forecast by End Use Industry, 2020-2035
  • Table 19: Western Europe Market Value (USD Million) Forecast by Country, 2020-2035
  • Table 20: Western Europe Market Value (USD Million) Forecast by Material Type , 2020-2035
  • Table 21: Western Europe Market Value (USD Million) Forecast by Shape, 2020-2035
  • Table 22: Western Europe Market Value (USD Million) Forecast by Capacity, 2020-2035
  • Table 23: Western Europe Market Value (USD Million) Forecast by Product Type, 2020-2035
  • Table 24: Western Europe Market Value (USD Million) Forecast by End Use Industry, 2020-2035
  • Table 25: Eastern Europe Market Value (USD Million) Forecast by Country, 2020-2035
  • Table 26: Eastern Europe Market Value (USD Million) Forecast by Material Type , 2020-2035
  • Table 27: Eastern Europe Market Value (USD Million) Forecast by Shape, 2020-2035
  • Table 28: Eastern Europe Market Value (USD Million) Forecast by Capacity, 2020-2035
  • Table 29: Eastern Europe Market Value (USD Million) Forecast by Product Type, 2020-2035
  • Table 30: Eastern Europe Market Value (USD Million) Forecast by End Use Industry, 2020-2035
  • Table 31: East Asia Market Value (USD Million) Forecast by Country, 2020-2035
  • Table 32: East Asia Market Value (USD Million) Forecast by Material Type , 2020-2035
  • Table 33: East Asia Market Value (USD Million) Forecast by Shape, 2020-2035
  • Table 34: East Asia Market Value (USD Million) Forecast by Capacity, 2020-2035
  • Table 35: East Asia Market Value (USD Million) Forecast by Product Type, 2020-2035
  • Table 36: East Asia Market Value (USD Million) Forecast by End Use Industry, 2020-2035
  • Table 37: South Asia and Pacific Market Value (USD Million) Forecast by Country, 2020-2035
  • Table 38: South Asia and Pacific Market Value (USD Million) Forecast by Material Type , 2020-2035
  • Table 39: South Asia and Pacific Market Value (USD Million) Forecast by Shape, 2020-2035
  • Table 40: South Asia and Pacific Market Value (USD Million) Forecast by Capacity, 2020-2035
  • Table 41: South Asia and Pacific Market Value (USD Million) Forecast by Product Type, 2020-2035
  • Table 42: South Asia and Pacific Market Value (USD Million) Forecast by End Use Industry, 2020-2035
  • Table 43: Middle East & Africa Market Value (USD Million) Forecast by Country, 2020-2035
  • Table 44: Middle East & Africa Market Value (USD Million) Forecast by Material Type , 2020-2035
  • Table 45: Middle East & Africa Market Value (USD Million) Forecast by Shape, 2020-2035
  • Table 46: Middle East & Africa Market Value (USD Million) Forecast by Capacity, 2020-2035
  • Table 47: Middle East & Africa Market Value (USD Million) Forecast by Product Type, 2020-2035
  • Table 48: Middle East & Africa Market Value (USD Million) Forecast by End Use Industry, 2020-2035

List of Figures

  • Figure 1: Global Market Pricing Analysis
  • Figure 2: Global Market Value (USD Million) Forecast 2020-2035
  • Figure 3: Global Market Value Share and BPS Analysis by Material Type , 2025 and 2035
  • Figure 4: Global Market Y-o-Y Growth Comparison by Material Type , 2025-2035
  • Figure 5: Global Market Attractiveness Analysis by Material Type
  • Figure 6: Global Market Value Share and BPS Analysis by Shape, 2025 and 2035
  • Figure 7: Global Market Y-o-Y Growth Comparison by Shape, 2025-2035
  • Figure 8: Global Market Attractiveness Analysis by Shape
  • Figure 9: Global Market Value Share and BPS Analysis by Capacity, 2025 and 2035
  • Figure 10: Global Market Y-o-Y Growth Comparison by Capacity, 2025-2035
  • Figure 11: Global Market Attractiveness Analysis by Capacity
  • Figure 12: Global Market Value Share and BPS Analysis by Product Type, 2025 and 2035
  • Figure 13: Global Market Y-o-Y Growth Comparison by Product Type, 2025-2035
  • Figure 14: Global Market Attractiveness Analysis by Product Type
  • Figure 15: Global Market Value Share and BPS Analysis by End Use Industry, 2025 and 2035
  • Figure 16: Global Market Y-o-Y Growth Comparison by End Use Industry, 2025-2035
  • Figure 17: Global Market Attractiveness Analysis by End Use Industry
  • Figure 18: Global Market Value (USD Million) Share and BPS Analysis by Region, 2025 and 2035
  • Figure 19: Global Market Y-o-Y Growth Comparison by Region, 2025-2035
  • Figure 20: Global Market Attractiveness Analysis by Region
  • Figure 21: North America Market Incremental Dollar Opportunity, 2025-2035
  • Figure 22: Latin America Market Incremental Dollar Opportunity, 2025-2035
  • Figure 23: Western Europe Market Incremental Dollar Opportunity, 2025-2035
  • Figure 24: Eastern Europe Market Incremental Dollar Opportunity, 2025-2035
  • Figure 25: East Asia Market Incremental Dollar Opportunity, 2025-2035
  • Figure 26: South Asia and Pacific Market Incremental Dollar Opportunity, 2025-2035
  • Figure 27: Middle East & Africa Market Incremental Dollar Opportunity, 2025-2035
  • Figure 28: North America Market Value Share and BPS Analysis by Country, 2025 and 2035
  • Figure 29: North America Market Value Share and BPS Analysis by Material Type , 2025 and 2035
  • Figure 30: North America Market Y-o-Y Growth Comparison by Material Type , 2025-2035
  • Figure 31: North America Market Attractiveness Analysis by Material Type
  • Figure 32: North America Market Value Share and BPS Analysis by Shape, 2025 and 2035
  • Figure 33: North America Market Y-o-Y Growth Comparison by Shape, 2025-2035
  • Figure 34: North America Market Attractiveness Analysis by Shape
  • Figure 35: North America Market Value Share and BPS Analysis by Capacity, 2025 and 2035
  • Figure 36: North America Market Y-o-Y Growth Comparison by Capacity, 2025-2035
  • Figure 37: North America Market Attractiveness Analysis by Capacity
  • Figure 38: North America Market Value Share and BPS Analysis by Product Type, 2025 and 2035
  • Figure 39: North America Market Y-o-Y Growth Comparison by Product Type, 2025-2035
  • Figure 40: North America Market Attractiveness Analysis by Product Type
  • Figure 41: North America Market Value Share and BPS Analysis by End Use Industry, 2025 and 2035
  • Figure 42: North America Market Y-o-Y Growth Comparison by End Use Industry, 2025-2035
  • Figure 43: North America Market Attractiveness Analysis by End Use Industry
  • Figure 44: Latin America Market Value Share and BPS Analysis by Country, 2025 and 2035
  • Figure 45: Latin America Market Value Share and BPS Analysis by Material Type , 2025 and 2035
  • Figure 46: Latin America Market Y-o-Y Growth Comparison by Material Type , 2025-2035
  • Figure 47: Latin America Market Attractiveness Analysis by Material Type
  • Figure 48: Latin America Market Value Share and BPS Analysis by Shape, 2025 and 2035
  • Figure 49: Latin America Market Y-o-Y Growth Comparison by Shape, 2025-2035
  • Figure 50: Latin America Market Attractiveness Analysis by Shape
  • Figure 51: Latin America Market Value Share and BPS Analysis by Capacity, 2025 and 2035
  • Figure 52: Latin America Market Y-o-Y Growth Comparison by Capacity, 2025-2035
  • Figure 53: Latin America Market Attractiveness Analysis by Capacity
  • Figure 54: Latin America Market Value Share and BPS Analysis by Product Type, 2025 and 2035
  • Figure 55: Latin America Market Y-o-Y Growth Comparison by Product Type, 2025-2035
  • Figure 56: Latin America Market Attractiveness Analysis by Product Type
  • Figure 57: Latin America Market Value Share and BPS Analysis by End Use Industry, 2025 and 2035
  • Figure 58: Latin America Market Y-o-Y Growth Comparison by End Use Industry, 2025-2035
  • Figure 59: Latin America Market Attractiveness Analysis by End Use Industry
  • Figure 60: Western Europe Market Value Share and BPS Analysis by Country, 2025 and 2035
  • Figure 61: Western Europe Market Value Share and BPS Analysis by Material Type , 2025 and 2035
  • Figure 62: Western Europe Market Y-o-Y Growth Comparison by Material Type , 2025-2035
  • Figure 63: Western Europe Market Attractiveness Analysis by Material Type
  • Figure 64: Western Europe Market Value Share and BPS Analysis by Shape, 2025 and 2035
  • Figure 65: Western Europe Market Y-o-Y Growth Comparison by Shape, 2025-2035
  • Figure 66: Western Europe Market Attractiveness Analysis by Shape
  • Figure 67: Western Europe Market Value Share and BPS Analysis by Capacity, 2025 and 2035
  • Figure 68: Western Europe Market Y-o-Y Growth Comparison by Capacity, 2025-2035
  • Figure 69: Western Europe Market Attractiveness Analysis by Capacity
  • Figure 70: Western Europe Market Value Share and BPS Analysis by Product Type, 2025 and 2035
  • Figure 71: Western Europe Market Y-o-Y Growth Comparison by Product Type, 2025-2035
  • Figure 72: Western Europe Market Attractiveness Analysis by Product Type
  • Figure 73: Western Europe Market Value Share and BPS Analysis by End Use Industry, 2025 and 2035
  • Figure 74: Western Europe Market Y-o-Y Growth Comparison by End Use Industry, 2025-2035
  • Figure 75: Western Europe Market Attractiveness Analysis by End Use Industry
  • Figure 76: Eastern Europe Market Value Share and BPS Analysis by Country, 2025 and 2035
  • Figure 77: Eastern Europe Market Value Share and BPS Analysis by Material Type , 2025 and 2035
  • Figure 78: Eastern Europe Market Y-o-Y Growth Comparison by Material Type , 2025-2035
  • Figure 79: Eastern Europe Market Attractiveness Analysis by Material Type
  • Figure 80: Eastern Europe Market Value Share and BPS Analysis by Shape, 2025 and 2035
  • Figure 81: Eastern Europe Market Y-o-Y Growth Comparison by Shape, 2025-2035
  • Figure 82: Eastern Europe Market Attractiveness Analysis by Shape
  • Figure 83: Eastern Europe Market Value Share and BPS Analysis by Capacity, 2025 and 2035
  • Figure 84: Eastern Europe Market Y-o-Y Growth Comparison by Capacity, 2025-2035
  • Figure 85: Eastern Europe Market Attractiveness Analysis by Capacity
  • Figure 86: Eastern Europe Market Value Share and BPS Analysis by Product Type, 2025 and 2035
  • Figure 87: Eastern Europe Market Y-o-Y Growth Comparison by Product Type, 2025-2035
  • Figure 88: Eastern Europe Market Attractiveness Analysis by Product Type
  • Figure 89: Eastern Europe Market Value Share and BPS Analysis by End Use Industry, 2025 and 2035
  • Figure 90: Eastern Europe Market Y-o-Y Growth Comparison by End Use Industry, 2025-2035
  • Figure 91: Eastern Europe Market Attractiveness Analysis by End Use Industry
  • Figure 92: East Asia Market Value Share and BPS Analysis by Country, 2025 and 2035
  • Figure 93: East Asia Market Value Share and BPS Analysis by Material Type , 2025 and 2035
  • Figure 94: East Asia Market Y-o-Y Growth Comparison by Material Type , 2025-2035
  • Figure 95: East Asia Market Attractiveness Analysis by Material Type
  • Figure 96: East Asia Market Value Share and BPS Analysis by Shape, 2025 and 2035
  • Figure 97: East Asia Market Y-o-Y Growth Comparison by Shape, 2025-2035
  • Figure 98: East Asia Market Attractiveness Analysis by Shape
  • Figure 99: East Asia Market Value Share and BPS Analysis by Capacity, 2025 and 2035
  • Figure 100: East Asia Market Y-o-Y Growth Comparison by Capacity, 2025-2035
  • Figure 101: East Asia Market Attractiveness Analysis by Capacity
  • Figure 102: East Asia Market Value Share and BPS Analysis by Product Type, 2025 and 2035
  • Figure 103: East Asia Market Y-o-Y Growth Comparison by Product Type, 2025-2035
  • Figure 104: East Asia Market Attractiveness Analysis by Product Type
  • Figure 105: East Asia Market Value Share and BPS Analysis by End Use Industry, 2025 and 2035
  • Figure 106: East Asia Market Y-o-Y Growth Comparison by End Use Industry, 2025-2035
  • Figure 107: East Asia Market Attractiveness Analysis by End Use Industry
  • Figure 108: South Asia and Pacific Market Value Share and BPS Analysis by Country, 2025 and 2035
  • Figure 109: South Asia and Pacific Market Value Share and BPS Analysis by Material Type , 2025 and 2035
  • Figure 110: South Asia and Pacific Market Y-o-Y Growth Comparison by Material Type , 2025-2035
  • Figure 111: South Asia and Pacific Market Attractiveness Analysis by Material Type
  • Figure 112: South Asia and Pacific Market Value Share and BPS Analysis by Shape, 2025 and 2035
  • Figure 113: South Asia and Pacific Market Y-o-Y Growth Comparison by Shape, 2025-2035
  • Figure 114: South Asia and Pacific Market Attractiveness Analysis by Shape
  • Figure 115: South Asia and Pacific Market Value Share and BPS Analysis by Capacity, 2025 and 2035
  • Figure 116: South Asia and Pacific Market Y-o-Y Growth Comparison by Capacity, 2025-2035
  • Figure 117: South Asia and Pacific Market Attractiveness Analysis by Capacity
  • Figure 118: South Asia and Pacific Market Value Share and BPS Analysis by Product Type, 2025 and 2035
  • Figure 119: South Asia and Pacific Market Y-o-Y Growth Comparison by Product Type, 2025-2035
  • Figure 120: South Asia and Pacific Market Attractiveness Analysis by Product Type
  • Figure 121: South Asia and Pacific Market Value Share and BPS Analysis by End Use Industry, 2025 and 2035
  • Figure 122: South Asia and Pacific Market Y-o-Y Growth Comparison by End Use Industry, 2025-2035
  • Figure 123: South Asia and Pacific Market Attractiveness Analysis by End Use Industry
  • Figure 124: Middle East & Africa Market Value Share and BPS Analysis by Country, 2025 and 2035
  • Figure 125: Middle East & Africa Market Value Share and BPS Analysis by Material Type , 2025 and 2035
  • Figure 126: Middle East & Africa Market Y-o-Y Growth Comparison by Material Type , 2025-2035
  • Figure 127: Middle East & Africa Market Attractiveness Analysis by Material Type
  • Figure 128: Middle East & Africa Market Value Share and BPS Analysis by Shape, 2025 and 2035
  • Figure 129: Middle East & Africa Market Y-o-Y Growth Comparison by Shape, 2025-2035
  • Figure 130: Middle East & Africa Market Attractiveness Analysis by Shape
  • Figure 131: Middle East & Africa Market Value Share and BPS Analysis by Capacity, 2025 and 2035
  • Figure 132: Middle East & Africa Market Y-o-Y Growth Comparison by Capacity, 2025-2035
  • Figure 133: Middle East & Africa Market Attractiveness Analysis by Capacity
  • Figure 134: Middle East & Africa Market Value Share and BPS Analysis by Product Type, 2025 and 2035
  • Figure 135: Middle East & Africa Market Y-o-Y Growth Comparison by Product Type, 2025-2035
  • Figure 136: Middle East & Africa Market Attractiveness Analysis by Product Type
  • Figure 137: Middle East & Africa Market Value Share and BPS Analysis by End Use Industry, 2025 and 2035
  • Figure 138: Middle East & Africa Market Y-o-Y Growth Comparison by End Use Industry, 2025-2035
  • Figure 139: Middle East & Africa Market Attractiveness Analysis by End Use Industry
  • Figure 140: Global Market - Tier Structure Analysis
  • Figure 141: Global Market - Company Share Analysis

Frequently Asked Questions

How big is the heavy duty bins market in 2025?

The global heavy duty bins market is estimated to be valued at USD 2.3 billion in 2025.

What will be the size of heavy duty bins market in 2035?

The market size for the heavy duty bins market is projected to reach USD 3.6 billion by 2035.

How much will be the heavy duty bins market growth between 2025 and 2035?

The heavy duty bins market is expected to grow at a 4.9% CAGR between 2025 and 2035.

What are the key product types in the heavy duty bins market?

The key product types in heavy duty bins market are plastic, polyethylene (pe), polyvinyl chloride (pvc), polypropylene (pp), polyethylene terephthalate (pet), others, corrugated paper and steel.

Which shape segment to contribute significant share in the heavy duty bins market in 2025?

In terms of shape, rectangular segment to command 47.3% share in the heavy duty bins market in 2025.

Explore Similar Insights

Future Market Insights

Heavy Duty Bins Market

Chat With MaRIA

Chat With

MaRIA

Hi There, I am MaRIA, Your Market Research Intelligence Assistant. How may I help you?