LED Modules and Light Engines Market Outlook (2023 to 2033)

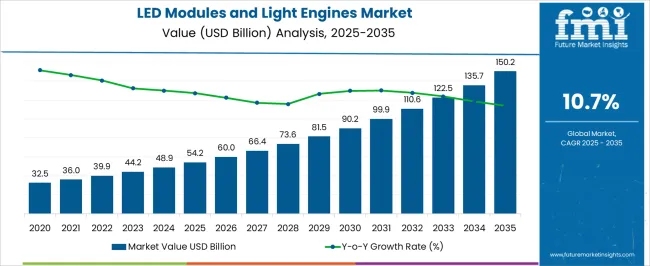
The global LED modules and light engines market is expected to be valued at US$ 43,744.4 million in 2023. LED modules and light engine market has gained traction recently due to its industrial and residential-sector applications. LED modules and Light Engines have LED on printed circuit boards and driver IC, respectively. The overall demand for LED Modules and Light Engines is projected to grow at a CAGR of 11.3% between 2023 and 2033, totaling around US$ 127,987.7 million by 2033.

Data Points Key Statistics
LED Modules and Light Engines Market Value 2023 US$ 43,744.4 million
LED Modules and Light Engines Market Projected Value (2033) US$ 127,987.7 million
LED Modules and Light Engines Market CAGR (2023 to 2033) 11.3%

Don't pay for what you don't need

Customize your report by selecting specific countries or regions and save 30%!

LED Modules and Light Engines Demand Analysis (2018 to 2022) vs. Market Outlook (2023 to 2033)

From 2018 to 2022, sales witnessed significant growth, registering a CAGR of 10.2%. The primary and foremost feature for the use of LED modules and light engines over its straight competitors like light bulbs is that LED modules and light engines are easy to manufacture, more efficient, and provide more reliable products than its straight competitors.

LED modules and light engines market gained hype due to the boom in the LED TV market and monitor backlight market. Some other markets that contribute to the growth of LED modules and light engine market are cell phone flash, architectural lighting, and automobile lighting. The overall demand for LED modules and light engines is projected to grow at a CAGR of 11.2% between 2023 and 2033, totaling around US$ 115,729.3 Million by 2033.

Demand From Various Industries Likely to Augment LED Modules and Light Engines Sales

With the increasing adoption of smart/connected lighting and LED luminaires and lamps in different sectors, LED modules and light engines are proliferating. Henceforth, the primary driver for LED modules and light engines market is the use of these products in many applications across sectors like automobile, electronics, healthcare, etc.

LED modules and light engines are used in these sectors and in broad sectors like commercial, residential, industrial, and outdoor sectors, making it a vast market with several opportunities. Moreover, the decline in prices and an improved light quality and flexibility provided by LED modules and light engines drive its growth in the market.

Sudip Saha
Sudip Saha

Principal Consultant

Talk to Analyst

Find your sweet spots for generating winning opportunities in this market.

Technical Issues Pertaining to LED modules and light engines to Impede the Growth

The major challenge faced by the LED modules and light engines market is that it plays by the rules of one company. The other competitors report that the market is closed due to specifications followed by just one company, making it a closed manufacturer's standard.

In addition to this, a few of the LED modules and light engines suffer from 120Hz flicker, which reduces the efficiency to almost 83%. This impedes the growth of the LED modules and light engines market.

Region-wise Insights

Increasing Adoption of LEDs Driving Market Growth in North America
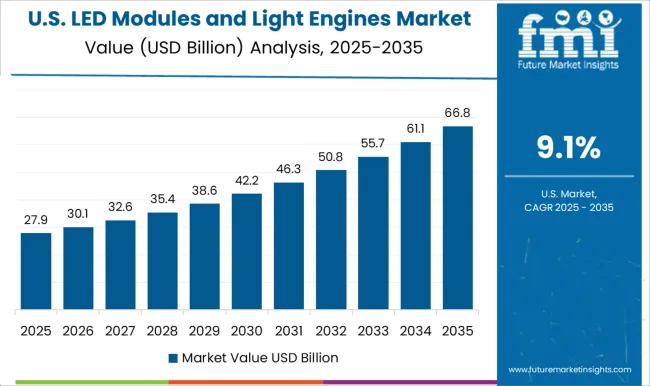
The North America LED modules and light engines market is expected to accumulate a market share of 22.1% in 2023. North America is expected to dominate during the forecast period owing to the adoption of LEDs and applications, including LEDs on a common utility purpose by several industries.
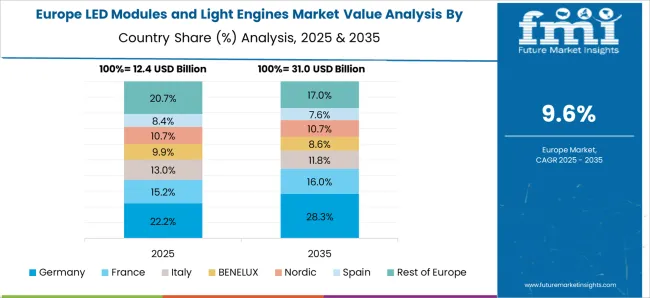
Europe LED Modules and Light Engines Market

Demand from Residential and Architectural Segments to Boost Market Growth in Europe

The European region is anticipated to be one of the leading LED modules and light engine markets, with a share of 18.9%. European countries are implementing LED Lights technologies in residential and architectural segments, and such a high adoption of LED Lights is most visible in countries including the UK, France, Germany, and Italy.

Get the data you need at a Fraction of the cost

Personalize your report by choosing insights you need
and save 40%!

Startups Ecosystem in the LED Modules and Light Engines Market

Some key players in the LED Modules and Light Engines market are Nanoleaf, EcoSense Lighting, Lumenpulse, LIFX, Urban Gro and many more.
  • Nanoleaf LED light bulbs are an energy-efficient light bulb that operates at almost double the efficiency of any other bulb. The bulbs can be adjusted by a standard power switch (no need for changes to the existing power switch) and without the need to connect to Wi-Fi or a smartphone. The bulb uses LEDs, which help improve brightness while reducing power draw and waste heat output.
  • Urban Gro provides lights and other infrastructure for the cannabis cultivation industry. It offers LED Grow lights for the cannabis and horticulture industries. It also supplies integrated pest management solutions such as pesticides, biocontrol programs, pesticide applicators, and air sanitizers. It also delivers automated fertigation and irrigation solutions and a substrate solution named Batch 64 and provides water treatment solutions for commercial greenhouses of cannabis cultivation.
  • Nora Lighting is a startup company creating new LED modules and engines that are more energy-efficient and cost-effective than existing LED goods. Nora Lighting is backed by a team of seasoned engineers and entrepreneurs, and their creative products have already won multiple honors.
  • Ayoola LED: Ayoola LED is a startup firm that is developing new LED modules and light engines that are more environmentally friendly and sustainable. Ayoola LED uses recycled materials in their products and is dedicated to lowering their carbon footprint. Ayoola LED has already received many orders from big stores and is swiftly establishing itself as a market leader in the sustainable LED sector.
  • LumenSky: LumenSky is a startup that is developing new LED modules and light engines that are more immersive and interactive. LumenSky's products use proprietary software to provide dynamic lighting effects that consumers may customize. LumenSky has already formed alliances with numerous large entertainment firms, and they are prepared to change how we perceive light.

Leading Players in the LED Modules and Light Engines Market

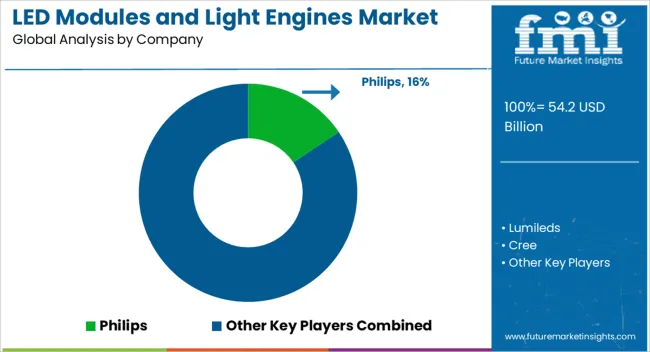
Prominent players in the LED Modules and Light Engines market are Philips Lumileds, Cree, Osram Opto, GE, Everlight, Nichia, Sharp, Toyoda Gosei, Samsung LED, Seoul Semiconductor, LG Innotek, and various other regional manufacturers.

  • In October 2021, LUXTECH rolled out Fingerboard – a family of four versatile area LED modules. By pushing the latest lighting technology and manufacturing exceptionally built modules with the utmost customer care, LUXTECH believes that they can elevate illumination to foster a better world. The constant current static white (CC Batwing) module is even integrated with wide-angle batwing optics to minimize the required diffuser depth. It is available in all colors, including Static white (featuring integrated wide-angle batwing optics to minimize required diffuser depth), RGB, RGBW, and Tunable White. Fingerboards can be cut to fit any shape and size.
  • Cree: Cree is a prominent manufacturer of LED components that has recently invested considerably in LED modules and light engines. Cree introduced its new XLamp XP-E3 LED in 2022, which is a high-power LED suitable for several applications, such as automotive lighting and industrial illumination. Cree also works on new LED modules and light engines for energy-efficient lighting solutions.
  • Seoul Semiconductor is a significant provider of LED components with a strong position in the Asian LED modules and light engines markets. Seoul Semiconductor will unveil its new Acrich Gen3 LED in 2022, a high-efficiency LED built for various applications, such as general illumination and automotive lighting. Seoul Semiconductor works on new LED modules and light engines for low-cost lighting solutions.
  • LG Innotek: A subsidiary of LG Electronics, LG Innotek is a prominent provider of LED modules and light engines for the automotive sector. LG Innotek will unveil its new vehicle LED modules in 2022, which are intended for various applications such as headlights, taillights, and interior lighting. LG Innotek is also working on new LED modules and light engines for next-generation car lighting systems.

Report Scope

Report Attribute Details
Growth Rate CAGR of 11.3% from 2023 to 2033
Market Value in 2023 US$ 43,744.4 million
Market Value in 2033 US$ 127,987.7 million
Base Year for Estimation 2023
Historical Data 2018 to 2022
Forecast Period 2023 to 2033
Quantitative Units Revenue in US$ million and CAGR from 2023 to 2033
Report Coverage Revenue Forecast, Company Ranking, Competitive Landscape, Growth Factors, Trends and Pricing Analysis
Segments Covered
  • Form Factor
  • Application
  • Region
Regions Covered
  • North America
  • Latin America
  • Europe
  • Asia Pacific
  • Middle East and Africa (MEA)
Key Countries Profiled
  • USA
  • Canada
  • Brazil
  • Mexico
  • Germany
  • UK
  • France
  • Spain
  • Italy
  • China
  • Japan
  • South Korea
  • Malaysia
  • Singapore
  • Australia
  • New Zealand
  • GCC
  • South Africa
  • Israel
Key Companies Profiled
  • Philips
  • Lumileds
  • Cree
  • Osram Opto
  • General Electric Company
  • Everlight
  • Nichia
  • Sharp Corporation
  • Toyoda Gosei
  • Samsung LED
  • Seoul Semiconductor
  • LG Innotek
Customization Available upon Request

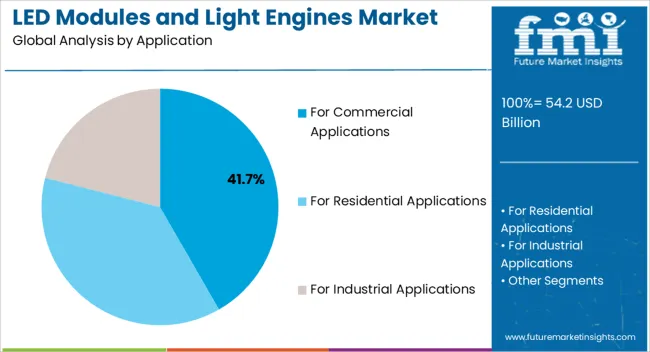
Key Segments Covered in the LED Modules and Light Engines Industry Analysis

By Application:

  • For Commercial Applications
  • For Residential Applications
  • For Industrial Applications

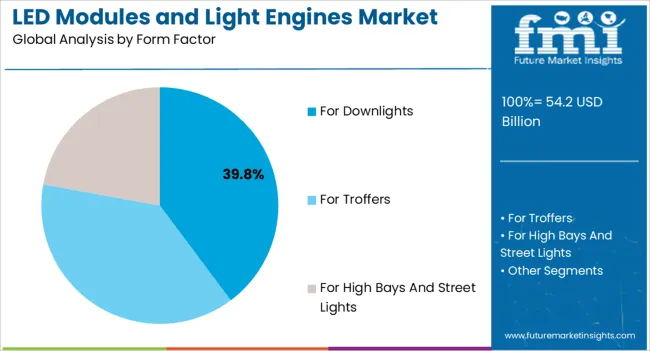
By Form Factor:

  • For Downlights
  • For Troffers
  • For High Bays and Street Lights

By Region:

  • North America
  • Latin America
  • Europe
  • Asia Pacific
  • Middle East & Africa

Frequently Asked Questions

How Big is the LED Modules and Light Engines Market?

The market is valued at US$ 43.7 billion in 2023.

Who are the Key Market Players?

Philips, Lumileds, and Cree are the key market players.

How is the Historical Performance of the Market?

The market registered a CAGR of 10.2% between 2018 and 2022.

What Opportunities Await the Market Players?

Rising adoption of smart/connected lighting to boost growth.

How big will the LED Modules and Light Engines Market by 2033?

The market is expected to be worth US$ 127.9 billion in 2033.

Table of Content
1. Executive Summary
    1.1. Global Market Outlook
    1.2. Demand-side Trends
    1.3. Supply-side Trends
    1.4. Technology Roadmap Analysis
    1.5. Analysis and Recommendations
2. Market Overview
    2.1. Market Coverage / Taxonomy
    2.2. Market Definition / Scope / Limitations
3. Market Background
    3.1. Market Dynamics
        3.1.1. Drivers
        3.1.2. Restraints
        3.1.3. Opportunity
        3.1.4. Trends
    3.2. Scenario Forecast
        3.2.1. Demand in Optimistic Scenario
        3.2.2. Demand in Likely Scenario
        3.2.3. Demand in Conservative Scenario
    3.3. Opportunity Map Analysis
    3.4. Product Life Cycle Analysis
    3.5. Supply Chain Analysis
        3.5.1. Supply Side Participants and their Roles
            3.5.1.1. Producers
            3.5.1.2. Mid-Level Participants (Traders/ Agents/ Brokers)
            3.5.1.3. Wholesalers and Distributors
        3.5.2. Value Added and Value Created at Node in the Supply Chain
        3.5.3. List of Raw Material Suppliers
        3.5.4. List of Existing and Potential Buyer’s
    3.6. Investment Feasibility Matrix
    3.7. Value Chain Analysis
        3.7.1. Profit Margin Analysis
        3.7.2. Wholesalers and Distributors
        3.7.3. Retailers
    3.8. PESTLE and Porter’s Analysis
    3.9. Regulatory Landscape
        3.9.1. By Key Regions
        3.9.2. By Key Countries
    3.10. Regional Parent Market Outlook
    3.11. Production and Consumption Statistics
    3.12. Import and Export Statistics
4. Global Market Analysis 2018 to 2022 and Forecast, 2023 to 2033
    4.1. Historical Market Size Value (US$ Million) & Volume (Units) Analysis, 2018 to 2022
    4.2. Current and Future Market Size Value (US$ Million) & Volume (Units) Projections, 2023 to 2033
        4.2.1. Y-o-Y Growth Trend Analysis
        4.2.2. Absolute $ Opportunity Analysis
5. Global Market Analysis 2018 to 2022 and Forecast 2023 to 2033, By Application
    5.1. Introduction / Key Findings
    5.2. Historical Market Size Value (US$ Million) & Volume (Units) Analysis By Application, 2018 to 2022
    5.3. Current and Future Market Size Value (US$ Million) & Volume (Units) Analysis and Forecast By Application, 2023 to 2033
        5.3.1. for Commercial Applications
        5.3.2. for Residential Applications
        5.3.3. for Industrial Applications
    5.4. Y-o-Y Growth Trend Analysis By Application, 2018 to 2022
    5.5. Absolute $ Opportunity Analysis By Application, 2023 to 2033
6. Global Market Analysis 2018 to 2022 and Forecast 2023 to 2033, By Form Factor
    6.1. Introduction / Key Findings
    6.2. Historical Market Size Value (US$ Million) & Volume (Units) Analysis By Form Factor, 2018 to 2022
    6.3. Current and Future Market Size Value (US$ Million) & Volume (Units) Analysis and Forecast By Form Factor, 2023 to 2033
        6.3.1. LED Modules and Engines for Downlights
        6.3.2. LED Modules and Engines for Troffers
        6.3.3. LED Modules and Engines for High Bays and Street Lights
    6.4. Y-o-Y Growth Trend Analysis By Form Factor, 2018 to 2022
    6.5. Absolute $ Opportunity Analysis By Form Factor, 2023 to 2033
7. Global Market Analysis 2018 to 2022 and Forecast 2023 to 2033, By Region
    7.1. Introduction
    7.2. Historical Market Size Value (US$ Million) & Volume (Units) Analysis By Region, 2018 to 2022
    7.3. Current Market Size Value (US$ Million) & Volume (Units) Analysis and Forecast By Region, 2023 to 2033
        7.3.1. North America
        7.3.2. Latin America
        7.3.3. Western Europe
        7.3.4. Eastern Europe
        7.3.5. South Asia and Pacific
        7.3.6. East Asia
        7.3.7. Middle East and Africa
    7.4. Market Attractiveness Analysis By Region
8. North America Market Analysis 2018 to 2022 and Forecast 2023 to 2033, By Country
    8.1. Historical Market Size Value (US$ Million) & Volume (Units) Trend Analysis By Market Taxonomy, 2018 to 2022
    8.2. Market Size Value (US$ Million) & Volume (Units) Forecast By Market Taxonomy, 2023 to 2033
        8.2.1. By Country
            8.2.1.1. USA
            8.2.1.2. Canada
        8.2.2. By Application
        8.2.3. By Form Factor
    8.3. Market Attractiveness Analysis
        8.3.1. By Country
        8.3.2. By Application
        8.3.3. By Form Factor
    8.4. Key Takeaways
9. Latin America Market Analysis 2018 to 2022 and Forecast 2023 to 2033, By Country
    9.1. Historical Market Size Value (US$ Million) & Volume (Units) Trend Analysis By Market Taxonomy, 2018 to 2022
    9.2. Market Size Value (US$ Million) & Volume (Units) Forecast By Market Taxonomy, 2023 to 2033
        9.2.1. By Country
            9.2.1.1. Brazil
            9.2.1.2. Mexico
            9.2.1.3. Rest of Latin America
        9.2.2. By Application
        9.2.3. By Form Factor
    9.3. Market Attractiveness Analysis
        9.3.1. By Country
        9.3.2. By Application
        9.3.3. By Form Factor
    9.4. Key Takeaways
10. Western Europe Market Analysis 2018 to 2022 and Forecast 2023 to 2033, By Country
    10.1. Historical Market Size Value (US$ Million) & Volume (Units) Trend Analysis By Market Taxonomy, 2018 to 2022
    10.2. Market Size Value (US$ Million) & Volume (Units) Forecast By Market Taxonomy, 2023 to 2033
        10.2.1. By Country
            10.2.1.1. Germany
            10.2.1.2. UK
            10.2.1.3. France
            10.2.1.4. Spain
            10.2.1.5. Italy
            10.2.1.6. Rest of Western Europe
        10.2.2. By Application
        10.2.3. By Form Factor
    10.3. Market Attractiveness Analysis
        10.3.1. By Country
        10.3.2. By Application
        10.3.3. By Form Factor
    10.4. Key Takeaways
11. Eastern Europe Market Analysis 2018 to 2022 and Forecast 2023 to 2033, By Country
    11.1. Historical Market Size Value (US$ Million) & Volume (Units) Trend Analysis By Market Taxonomy, 2018 to 2022
    11.2. Market Size Value (US$ Million) & Volume (Units) Forecast By Market Taxonomy, 2023 to 2033
        11.2.1. By Country
            11.2.1.1. Poland
            11.2.1.2. Russia
            11.2.1.3. Czech Republic
            11.2.1.4. Romania
            11.2.1.5. Rest of Eastern Europe
        11.2.2. By Application
        11.2.3. By Form Factor
    11.3. Market Attractiveness Analysis
        11.3.1. By Country
        11.3.2. By Application
        11.3.3. By Form Factor
    11.4. Key Takeaways
12. South Asia and Pacific Market Analysis 2018 to 2022 and Forecast 2023 to 2033, By Country
    12.1. Historical Market Size Value (US$ Million) & Volume (Units) Trend Analysis By Market Taxonomy, 2018 to 2022
    12.2. Market Size Value (US$ Million) & Volume (Units) Forecast By Market Taxonomy, 2023 to 2033
        12.2.1. By Country
            12.2.1.1. India
            12.2.1.2. Bangladesh
            12.2.1.3. Australia
            12.2.1.4. New Zealand
            12.2.1.5. Rest of South Asia and Pacific
        12.2.2. By Application
        12.2.3. By Form Factor
    12.3. Market Attractiveness Analysis
        12.3.1. By Country
        12.3.2. By Application
        12.3.3. By Form Factor
    12.4. Key Takeaways
13. East Asia Market Analysis 2018 to 2022 and Forecast 2023 to 2033, By Country
    13.1. Historical Market Size Value (US$ Million) & Volume (Units) Trend Analysis By Market Taxonomy, 2018 to 2022
    13.2. Market Size Value (US$ Million) & Volume (Units) Forecast By Market Taxonomy, 2023 to 2033
        13.2.1. By Country
            13.2.1.1. China
            13.2.1.2. Japan
            13.2.1.3. South Korea
        13.2.2. By Application
        13.2.3. By Form Factor
    13.3. Market Attractiveness Analysis
        13.3.1. By Country
        13.3.2. By Application
        13.3.3. By Form Factor
    13.4. Key Takeaways
14. Middle East and Africa Market Analysis 2018 to 2022 and Forecast 2023 to 2033, By Country
    14.1. Historical Market Size Value (US$ Million) & Volume (Units) Trend Analysis By Market Taxonomy, 2018 to 2022
    14.2. Market Size Value (US$ Million) & Volume (Units) Forecast By Market Taxonomy, 2023 to 2033
        14.2.1. By Country
            14.2.1.1. GCC Countries
            14.2.1.2. South Africa
            14.2.1.3. Israel
            14.2.1.4. Rest of MEA
        14.2.2. By Application
        14.2.3. By Form Factor
    14.3. Market Attractiveness Analysis
        14.3.1. By Country
        14.3.2. By Application
        14.3.3. By Form Factor
    14.4. Key Takeaways
15. Key Countries Market Analysis
    15.1. USA
        15.1.1. Pricing Analysis
        15.1.2. Market Share Analysis, 2022
            15.1.2.1. By Application
            15.1.2.2. By Form Factor
    15.2. Canada
        15.2.1. Pricing Analysis
        15.2.2. Market Share Analysis, 2022
            15.2.2.1. By Application
            15.2.2.2. By Form Factor
    15.3. Brazil
        15.3.1. Pricing Analysis
        15.3.2. Market Share Analysis, 2022
            15.3.2.1. By Application
            15.3.2.2. By Form Factor
    15.4. Mexico
        15.4.1. Pricing Analysis
        15.4.2. Market Share Analysis, 2022
            15.4.2.1. By Application
            15.4.2.2. By Form Factor
    15.5. Germany
        15.5.1. Pricing Analysis
        15.5.2. Market Share Analysis, 2022
            15.5.2.1. By Application
            15.5.2.2. By Form Factor
    15.6. UK
        15.6.1. Pricing Analysis
        15.6.2. Market Share Analysis, 2022
            15.6.2.1. By Application
            15.6.2.2. By Form Factor
    15.7. France
        15.7.1. Pricing Analysis
        15.7.2. Market Share Analysis, 2022
            15.7.2.1. By Application
            15.7.2.2. By Form Factor
    15.8. Spain
        15.8.1. Pricing Analysis
        15.8.2. Market Share Analysis, 2022
            15.8.2.1. By Application
            15.8.2.2. By Form Factor
    15.9. Italy
        15.9.1. Pricing Analysis
        15.9.2. Market Share Analysis, 2022
            15.9.2.1. By Application
            15.9.2.2. By Form Factor
    15.10. Poland
        15.10.1. Pricing Analysis
        15.10.2. Market Share Analysis, 2022
            15.10.2.1. By Application
            15.10.2.2. By Form Factor
    15.11. Russia
        15.11.1. Pricing Analysis
        15.11.2. Market Share Analysis, 2022
            15.11.2.1. By Application
            15.11.2.2. By Form Factor
    15.12. Czech Republic
        15.12.1. Pricing Analysis
        15.12.2. Market Share Analysis, 2022
            15.12.2.1. By Application
            15.12.2.2. By Form Factor
    15.13. Romania
        15.13.1. Pricing Analysis
        15.13.2. Market Share Analysis, 2022
            15.13.2.1. By Application
            15.13.2.2. By Form Factor
    15.14. India
        15.14.1. Pricing Analysis
        15.14.2. Market Share Analysis, 2022
            15.14.2.1. By Application
            15.14.2.2. By Form Factor
    15.15. Bangladesh
        15.15.1. Pricing Analysis
        15.15.2. Market Share Analysis, 2022
            15.15.2.1. By Application
            15.15.2.2. By Form Factor
    15.16. Australia
        15.16.1. Pricing Analysis
        15.16.2. Market Share Analysis, 2022
            15.16.2.1. By Application
            15.16.2.2. By Form Factor
    15.17. New Zealand
        15.17.1. Pricing Analysis
        15.17.2. Market Share Analysis, 2022
            15.17.2.1. By Application
            15.17.2.2. By Form Factor
    15.18. China
        15.18.1. Pricing Analysis
        15.18.2. Market Share Analysis, 2022
            15.18.2.1. By Application
            15.18.2.2. By Form Factor
    15.19. Japan
        15.19.1. Pricing Analysis
        15.19.2. Market Share Analysis, 2022
            15.19.2.1. By Application
            15.19.2.2. By Form Factor
    15.20. South Korea
        15.20.1. Pricing Analysis
        15.20.2. Market Share Analysis, 2022
            15.20.2.1. By Application
            15.20.2.2. By Form Factor
    15.21. GCC Countries
        15.21.1. Pricing Analysis
        15.21.2. Market Share Analysis, 2022
            15.21.2.1. By Application
            15.21.2.2. By Form Factor
    15.22. South Africa
        15.22.1. Pricing Analysis
        15.22.2. Market Share Analysis, 2022
            15.22.2.1. By Application
            15.22.2.2. By Form Factor
    15.23. Israel
        15.23.1. Pricing Analysis
        15.23.2. Market Share Analysis, 2022
            15.23.2.1. By Application
            15.23.2.2. By Form Factor
16. Market Structure Analysis
    16.1. Competition Dashboard
    16.2. Competition Benchmarking
    16.3. Market Share Analysis of Top Players
        16.3.1. By Regional
        16.3.2. By Application
        16.3.3. By Form Factor
17. Competition Analysis
    17.1. Competition Deep Dive
        17.1.1. Philips
            17.1.1.1. Overview
            17.1.1.2. Product Portfolio
            17.1.1.3. Profitability by Market Segments
            17.1.1.4. Sales Footprint
            17.1.1.5. Strategy Overview
                17.1.1.5.1. Marketing Strategy
                17.1.1.5.2. Product Strategy
                17.1.1.5.3. Channel Strategy
        17.1.2. Lumileds
            17.1.2.1. Overview
            17.1.2.2. Product Portfolio
            17.1.2.3. Profitability by Market Segments
            17.1.2.4. Sales Footprint
            17.1.2.5. Strategy Overview
                17.1.2.5.1. Marketing Strategy
                17.1.2.5.2. Product Strategy
                17.1.2.5.3. Channel Strategy
        17.1.3. Cree
            17.1.3.1. Overview
            17.1.3.2. Product Portfolio
            17.1.3.3. Profitability by Market Segments
            17.1.3.4. Sales Footprint
            17.1.3.5. Strategy Overview
                17.1.3.5.1. Marketing Strategy
                17.1.3.5.2. Product Strategy
                17.1.3.5.3. Channel Strategy
        17.1.4. Osram Opto
            17.1.4.1. Overview
            17.1.4.2. Product Portfolio
            17.1.4.3. Profitability by Market Segments
            17.1.4.4. Sales Footprint
            17.1.4.5. Strategy Overview
                17.1.4.5.1. Marketing Strategy
                17.1.4.5.2. Product Strategy
                17.1.4.5.3. Channel Strategy
        17.1.5. General Electric Company
            17.1.5.1. Overview
            17.1.5.2. Product Portfolio
            17.1.5.3. Profitability by Market Segments
            17.1.5.4. Sales Footprint
            17.1.5.5. Strategy Overview
                17.1.5.5.1. Marketing Strategy
                17.1.5.5.2. Product Strategy
                17.1.5.5.3. Channel Strategy
        17.1.6. Everlight
            17.1.6.1. Overview
            17.1.6.2. Product Portfolio
            17.1.6.3. Profitability by Market Segments
            17.1.6.4. Sales Footprint
            17.1.6.5. Strategy Overview
                17.1.6.5.1. Marketing Strategy
                17.1.6.5.2. Product Strategy
                17.1.6.5.3. Channel Strategy
        17.1.7. Nichia
            17.1.7.1. Overview
            17.1.7.2. Product Portfolio
            17.1.7.3. Profitability by Market Segments
            17.1.7.4. Sales Footprint
            17.1.7.5. Strategy Overview
                17.1.7.5.1. Marketing Strategy
                17.1.7.5.2. Product Strategy
                17.1.7.5.3. Channel Strategy
        17.1.8. Sharp Corporation
            17.1.8.1. Overview
            17.1.8.2. Product Portfolio
            17.1.8.3. Profitability by Market Segments
            17.1.8.4. Sales Footprint
            17.1.8.5. Strategy Overview
                17.1.8.5.1. Marketing Strategy
                17.1.8.5.2. Product Strategy
                17.1.8.5.3. Channel Strategy
        17.1.9. Toyoda Gosei
            17.1.9.1. Overview
            17.1.9.2. Product Portfolio
            17.1.9.3. Profitability by Market Segments
            17.1.9.4. Sales Footprint
            17.1.9.5. Strategy Overview
                17.1.9.5.1. Marketing Strategy
                17.1.9.5.2. Product Strategy
                17.1.9.5.3. Channel Strategy
        17.1.10. Samsung LED
            17.1.10.1. Overview
            17.1.10.2. Product Portfolio
            17.1.10.3. Profitability by Market Segments
            17.1.10.4. Sales Footprint
            17.1.10.5. Strategy Overview
                17.1.10.5.1. Marketing Strategy
                17.1.10.5.2. Product Strategy
                17.1.10.5.3. Channel Strategy
        17.1.11. Seoul Semiconductor
            17.1.11.1. Overview
            17.1.11.2. Product Portfolio
            17.1.11.3. Profitability by Market Segments
            17.1.11.4. Sales Footprint
            17.1.11.5. Strategy Overview
                17.1.11.5.1. Marketing Strategy
                17.1.11.5.2. Product Strategy
                17.1.11.5.3. Channel Strategy
        17.1.12. LG Innotek
            17.1.12.1. Overview
            17.1.12.2. Product Portfolio
            17.1.12.3. Profitability by Market Segments
            17.1.12.4. Sales Footprint
            17.1.12.5. Strategy Overview
                17.1.12.5.1. Marketing Strategy
                17.1.12.5.2. Product Strategy
                17.1.12.5.3. Channel Strategy
18. Assumptions & Acronyms Used
19. Research Methodology
Recommendations

Technology

LED and OLED lighting Products and Display Market

August 2024

REP-EU-1253

194 pages

Industrial Automation

Heat Resistant LED Lights Market

July 2023

REP-GB-17590

250 pages

Explore Technology Insights

View Reports
Future Market Insights

LED Modules and Light Engines Market

Schedule a Call