Reports

- Global Locations -

Headquarters

Future Market Insights, Inc.

Christiana Corporate, 200
Continental Drive, Suite 401,
Newark, Delaware - 19713,
United States

T: +1-845-579-5705

Americas

Future Market Insights, Inc.

616 Corporate Way, Suite 2-9018,
Valley Cottage, NY 10989, United States

T: +1-347-918-3531

MEA

Future Market Insights

1602-6 Jumeirah Bay X2 Tower, Plot No: JLT-PH2-X2A,
Jumeirah Lakes Towers, Dubai,
United Arab Emirates

Europe

Future Market Insights

3rd Floor, 207 Regent Street,
W1B 3HH London
United Kingdom

T: + 44 (0) 20 8123 9659
D: +44 (0) 20 3287 4268

Asia Pacific

Future Market Insights

IndiaLand Global Tech Park, Unit UG-1, Behind Grand HighStreet, Phase 1, Hinjawadi, MH, Pune – 411057, India

LED Control Unit Market Outlook (2023 to 2033)

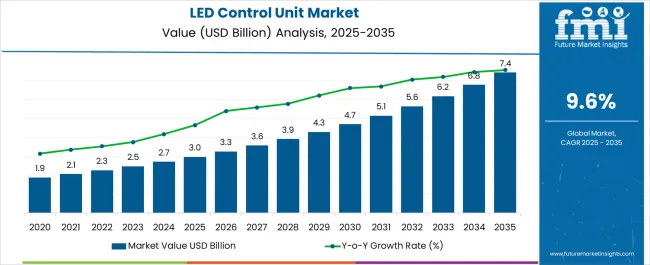
According to our lead research consultant for the technology domain at Future Market Insights, the global LED control unit market is projected to thrive at a striking CAGR of 10.1% from 2023 to 2033. The LED control unit market size is estimated to surpass US$ 2,659.7 million by 2023 and reach US$ 6,982.4 million by 2033.

The increasing focus on aesthetics, LED automation, connectivity advancements, LiDAR integration, IoT lighting control, and health and well-being concerns are projected to offer lucrative growth avenues in the coming years.

The increased global emphasis on energy efficiency and sustainability is one of the key factors propelling the growth of the LED control unit market. LED lighting systems use less energy than conventional lighting technologies like incandescent or fluorescent bulbs. Control units maximize efficiency by reducing energy usage by enabling users to change the duration and intensity of LED lighting. The aesthetics of lighting fixtures are becoming an increasingly important market trend as LED lighting technology develops. Control units are designed to provide a wide range of lighting effects, colors, and moods, allowing users to create visually pleasing surroundings.

LED control applications are expanding due to the rising incorporation of advanced technologies and proliferating market expansion. For instance, by incorporating AI algorithms into LED control units, illumination may be automatically adjusted based on user behavior, occupancy, and the time of day. Automation improves user convenience and energy savings. Likewise, accurate occupancy detection and spatial awareness are made possible by integrating LiDAR sensors into LED control units. With the use of real-time occupancy data, this technology can be used in smart buildings, retail, and hospitality to optimize lighting for energy savings and better user experiences.

Attribute Details
LED Control Unit Market Share (2022) US$ 2,451.3 million
LED Control Unit Market Share (2023) US$ 2,659.7 million
LED Control Unit Market Share (2033) US$ 6,982.4 million
LED Control Unit Market Share (2023 to 2033) 10.1%

Don't pay for what you don't need

Customize your report by selecting specific countries or regions and save 30%!

Other Factors Amplifying LED Control Unit Market Growth

  • Growing global initiatives to promote energy efficiency and environmental conservation through incentives and regulations.
  • The proliferation of smart cities and smart home ecosystems is surging the demand for compatible devices.
  • Increasing advancements in connectivity and the growth of wireless communication technologies like Wi-Fi, Zigbee, and Bluetooth.
  • Rising adoption in industrial settings to optimize lighting conditions for safety and energy efficiency fosters market development.
  • Decreasing costs and rising availability of LED control units prominently drive market growth.

Challenges for Companies/Manufacturers of LED Control Units

  • Several manufacturers are offering LED lighting and control solutions in this competitive market. Price wars and dwindling business margins could result from fierce competition.
  • Concerns regarding cybersecurity weaknesses and potential breaches are brought up by the integration of LED control units with IoT and smart systems.
  • Complex control algorithms and Li-Fi integration are two examples of emerging technologies that may provide technical challenges to manufacturers and impede the creation of new products.
  • It can be difficult for producers and users to ensure seamless compatibility across various brands and types of LED control units and different IoT systems.
Sudip Saha
Sudip Saha

Principal Consultant

Talk to Analyst

Find your sweet spots for generating winning opportunities in this market.

Opportunities in the Global LED Control Unit Market Map

  • The shift towards human-centric lighting and its potential health advantages is creating opportunities for LED control unit applications in healthcare, workplace settings, and residential spaces.
  • The development of more advanced and accessible LED control units is expected to be fueled by ongoing developments in wireless connectivity, data analytics, AI, and sensor technology.
  • LED control devices can be used in facilities for the elderly to mimic natural lighting, helping to preserve regular sleep cycles and fostering a comfortable living environment.
  • LED control units may serve as a key component of smart city programs by providing adaptive street lighting, lowering energy usage, and advancing overall city sustainability goals.

LED Control Unit Market Historical Analysis (2018 to 2022) Vs. Forecast Outlook (2023 to 2033)

The global LED control unit market size developed at a CAGR of 8.0% from 2018 to 2022. In 2018, the global market size stood at US$ 1,798.5 million. The market witnessed remarkable growth in the following years, accounting for US$ 2,451.3 million in 2022.

As LED component costs have continuously dropped over time, LED lighting has become more accessible. Higher adoption rates stemmed from the increased availability of LED control units due to lower costs for consumers and enterprises. More effective and adaptable LED control units have been created through LED technology, microcontrollers, and wireless connectivity developments. Consumers and organizations find these devices more appealing since they can provide dynamic lighting effects, color modifications, and interaction with smart systems.

Future technical advancements in the LED control unit market are projected to produce lighting solutions that are more intelligent and efficient. The capabilities of LED control units will be improved by developments in wireless connection, sensor technologies, data analytics, and AI, making them even more adaptable and user-friendly. More sophisticated LED control units will lead to the development of new applications. These might include Li-Fi connectivity, sophisticated horticultural lighting for vertical farming, and more interactive lighting experiences at shows and other events.

Historical CAGR (2018 to 2022) 8.0%
Projected CAGR (2023 to 2033) 10.1%

Get the data you need at a Fraction of the cost

Personalize your report by choosing insights you need
and save 40%!

Category-wise Insights

Indication Function to Acquire Swift Growth Due to Rising Automation and Robotics Adoption

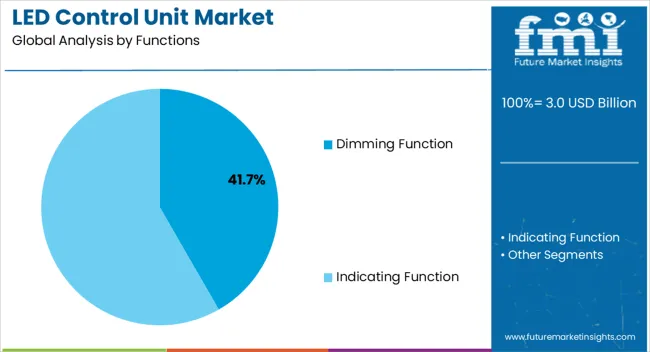
According to our lead research consultant at FMI, the dimming function segment acquired 63.4% of the global market share in 2022. In a variety of settings, an LED dimming system helps create the desired atmosphere and environment. Brighter lighting is appropriate for work demanding concentration and focus, whereas soft and subtle lighting can promote a relaxing atmosphere. This adaptability is widely valued in applications for residences, companies, and hospitality businesses.

On the other hand, due to the increased usage of Industry 4.0, automation, and robotics, the indication function is anticipated to have substantial expansion throughout the projection period. LED indicators are used in automation and robotics to signal the status of equipment, robots, and manufacturing lines. They assist engineers and operators in quickly identifying problems, minimizing downtime, and boosting productivity.

High Beam LED Control Unit to Hold the Lion’s Share

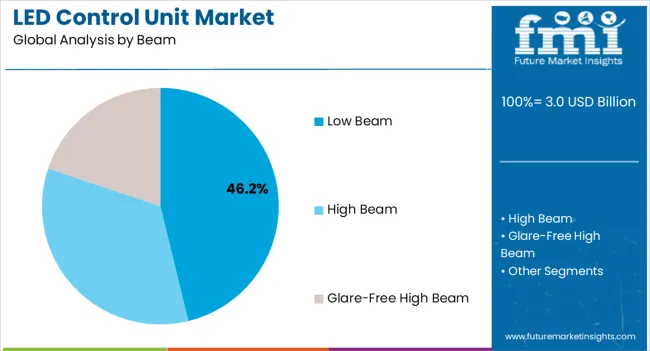
According to our lead research consultant at FMI, the high beam LED control unit segment captured nearly 43.2% of the global market share in 2022. In the automotive industry, adaptive lighting systems frequently include high beam LED control units. Based on variables like as oncoming traffic, road curvature, and weather conditions, these systems are capable of automatically adjusting the high beam's strength and direction. With this adaptive feature, visibility is improved while glare for other drivers is reduced. Dynamic management of individual LED segments is possible with modern high beam LED control modules. This makes it possible to design "smart" lighting patterns that adapt to the design of the road, the flow of traffic, and the surroundings, enhancing overall driving safety and comfort.

Segment Dimming Function
Value Share in Global Market (2022) 63.4%
Segment High Beam LED Control Units
Value Share in Global Market (2022) 43.2%

Comparative View of Adjacent LED Control Unit Market

LED Control Unit Market:

Attributes LED Control Unit Market
CAGR (2023 to 2033) 10.1%
Market Value (2023) US$ 2,659.7 million
Growth Factors
  • Increasing adoption of wireless LED control systems.
  • Rising demand for smart LED control and LED remote management solutions in smart city infrastructures.
  • Growing demand for data-driven insights derived from LED control units with sensors and data analytics capabilities.
Future Opportunities Advancements in LED control algorithms.
Market Trends Rising automation adoption in households and industries.

LED Driver IC Market:

Attributes LED Driver IC Market
CAGR (2023 to 2033) 14.4%
Market Value (2023) US$ 2,814.1 million
Growth Factors
  • Growing miniaturization trend.
  • Proliferation of IoT and connected lighting systems.
  • Growth of smart buildings and homes.
Future Opportunities Development of energy-efficient products.
Market Trends Rising demand for consumer electronics.

LED Driver for Lighting Market:

Attributes LED Driver for Lighting Market
CAGR (2023 to 2033) 19.4%
Market Value (2023) US$ 25.7 billion
Growth Factors
  • Rising adoption of compact LEDs.
  • Rising demand for energy-efficient lighting technology and programmable LED drivers.
  • Surging awareness for carbon footprint reduction and environmental sustainability.
Future Opportunities Advancements in LED technology for improved lifespan and efficiency.
Market Trends Declining prices of LED drivers.

Country-wise Insights

India’s LED Control Unit Market to Witness Swifter Growth than Others

According to our lead research consultant at FMI, India captured a gigantic 16.5% of the market share for LED control units in 2022. Numerous programs, like the "Make in India" campaign and the "Unnat Jyoti by Affordable LEDs for All" (UJALA) program, have been created by the Indian government to promote energy efficiency and sustainability. These programs include financial aid, tax breaks, and other measures that promote the use of LED lighting, which in turn increases the demand for LED control units. India has one of the top rates of urbanization in the world. The need for effective and environmentally friendly lighting solutions, such as LED control units for smart infrastructure and public places, is increasing as cities grow.

China’s Manufacturing Hub Supremacy to Amplify Market Expansion Significantly

In 2022, the LED control unit market in China occupied 13.2% of the global market shares. China has established itself as an important vendor of electronics and technological goods, such as LED lighting and control systems. Due to the nation's strong manufacturing capacities, economical production methods, and supply chain infrastructure, LED control units are widely available and priced competitively. LED research and development have seen substantial funding from China, which is speeding up technological development. These developments pave the way for more advanced LED control units with attributes like wireless connectivity, smart controls, and Internet of Things integration.

Germany’s Focus on Quality and Precision Extends to LED Control Units

In 2022, Germany acquired 9.2% of the global LED control unit market shares. Germany is renowned for its steadfast dedication to sustainability and energy efficiency. The country's objectives of cutting energy use, and carbon emissions, and encouraging eco-friendly technology are compatible with LED lighting and control devices. Germany is famous for having very strong manufacturing and quality control requirements. Consumers respect items that offer dependability, longevity, and constant performance, which reputation extends to LED control units.

Countries CAGR (2022)
India 16.5%
China 13.2%
Germany 9.2%

Startups Bring a New Dawn of Illumination

Startups in this industry are utilizing cutting-edge technologies to develop ground-breaking solutions that offer increased efficiency, personalization, and integration with intelligent systems. They are working to create LED control systems that are fully compatible with smart home ecosystems. With the help of voice assistants, home automation platforms, and mobile apps, these devices may be operated to change the lighting remotely and produce custom lighting situations.

With LED control units made specifically for those industries' particular needs, startups are targeting niche market segments including agricultural, automotive, and retail. For example, an LED monitoring system made for indoor agriculture can offer customized light spectra for the best plant growth.
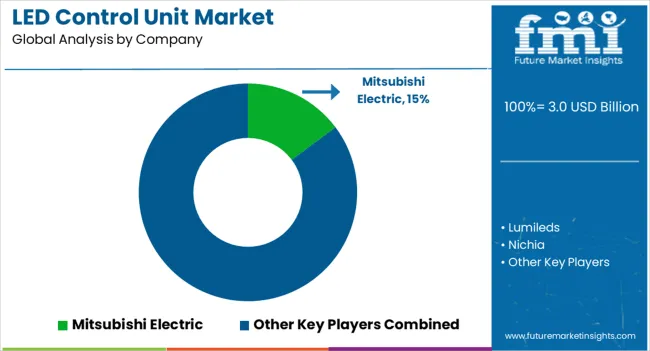
Competitive Landscape

Technology Giants Strive to Enable New Capabilities in LED Control Units

The LED control unit market has a dynamic and varied competitive environment, with a mix of well-established businesses, new startups, and technology innovators contending for market dominance. The landscape is influenced by aspects including technology advancement, product offers, global reach, clientele, and strategic alliances. Companies that create cutting-edge components, including sophisticated sensors or wireless communication technologies, improve the competitive environment by giving LED control units access to new possibilities.

Recent Developments Observed by FMI:

Company Fulham
Month and Year of Development May 2023
Details
  • Announced the release of four substantially upgraded LED driver families: WorkHorseTM, ThoroLEDTM, PONYTM, and SugarCubeTM.
  • These product lines' strong new drivers fill a critical need in the market for environmentally responsible and energy-efficient lighting solutions.
Company Casambi
Month and Year of Development April 2023
Details
  • Unveiled the CBM-003, a new chip that enables additional radio modes and longer ranges up to about 200 meters (650 ft) in practical applications.
  • This module, which is based on Nordic Semiconductor's nRF52840 SoC, provides lower energy consumption, more RAM and Flash memory, and support for Bluetooth 5.
Company Mineglow
Month and Year of Development September 2022
Details
  • Launched em-Control, an interoperable emergency lighting system, to enhance miner safety and prepare them for emergency evacuations.
  • With multi-directional light pulses and colors, em-Control provides intelligent, network-based warnings and directions to underground workers.
  • In high-stress, dangerous environments, they provide high illumination to promote safety, dissipate panic, and ensure high comfort for underground workers.
Company Berghaus Verkehrstechnik
Month and Year of Development September 2022
Details
  • Launched a bright, flexible, and safe LED mobile lighting system to the market.
  • Two high-intensity LED streetlights (each 9,800 lumens) are included in the mobile crosswalk lighting and a control unit for DC or AC operation.
  • The control unit also has a twilight switch that can be set over Bluetooth via a twilight timer.

Key Takeaways:

  • India occupied the dominant share of the market in 2022.
  • The United States stood second in terms of market share acquired in 2022.
  • The high beam LED control unit segment leads the market.
  • The dimming function is highly demanded by several end-users.

Report Scope

Attribute Details
Growth Rate CAGR of 10.1% from 2023 to 2033
Market Value in 2023 US$ 2,659.7 million
Market Value in 2033 US$ 6,982.4 million
Base Year for Estimation 2022
Historical Data 2018 to 2022
Forecast Period 2023 to 2033
Quantitative Units Revenue in US$ million and CAGR from 2023 to 2033
Report Coverage Revenue Forecast, Company Ranking, Competitive Landscape, Growth Factors, Trends, and Pricing Analysis
Segments Covered
  • By Functions
  • By Beam
  • By Light Type
  • By End-user
  • By Region
Regions Covered
  • North America
  • Latin America
  • Europe
  • Asia Pacific
  • Middle East and Africa
Key Countries Profiled
  • United States
  • Canada
  • Brazil
  • Mexico
  • Germany
  • United Kingdom
  • France
  • Spain
  • Italy
  • China
  • Japan
  • South Korea
  • Malaysia
  • Singapore
  • Australia
  • New Zealand
  • GCC Countries
  • South Africa
  • Israel
Key Companies Profiled
  • Mitsubishi Electric
  • Lumileds
  • Nichia
  • Samsung Electronics
  • Seoul Semiconductor
  • Photonic Corporation
  • Continental Company
  • CCS Inc.
  • Sesaly Company
  • APL Machinery Pvt. Ltd.
Customization Available Upon Request

Key Segments Profiled in the LED Control Unit Industry Survey

By Functions:

  • Dimming Function
  • Indicating Function

By Beam:

  • Low Beam
  • High Beam
  • Glare-free High Beam

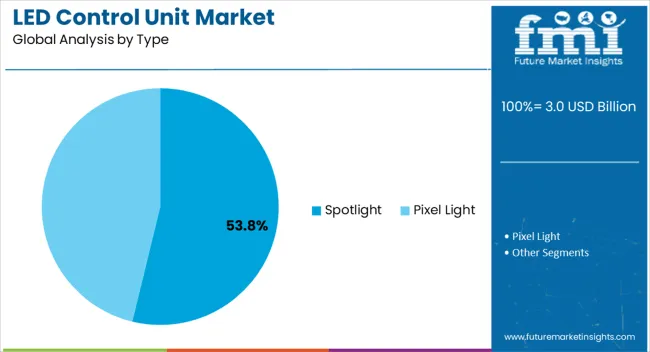
By Type:

  • Spotlight
  • Pixel light

By End-user:

  • Commercial Lights
  • Industrial Lights

By Region:

  • North America
  • Latin America
  • Europe
  • Asia Pacific
  • Middle East and Africa

Frequently Asked Questions

How is the Forecasted Growth Trajectory for the Global LED Control Unit Market?

The global sales of LED control units is forecasted to rise at 10.1% CAGR through 2033.

What will be the Total Valuation of the Global LED Control Unit Market by 2033?

The total valuation of the market is expected to close up at US$ 6,982.4 million by 2033.

Which is the Prominent Function Segment in the Global LED Control Unit Market?

The dimming function segment leads with 63.4% global market share in 2022.

What is the Market Outlook for the High Beam LED Control Unit Segment?

Higher demand for high beam lights resulted in 43.2% of the global market share in 2022.

Which Region holds Higher Growth Potential for the Sales of LED Control Units?

Accelerating industrialization is poised to propel the electronics market in India rapidly.

Table of Content

1. Executive Summary

    1.1. Global Market Outlook

    1.2. Demand-side Trends

    1.3. Supply-side Trends

    1.4. Technology Roadmap Analysis

    1.5. Analysis and Recommendations

2. Market Overview

    2.1. Market Coverage / Taxonomy

    2.2. Market Definition / Scope / Limitations

3. Market Background

    3.1. Market Dynamics

        3.1.1. Drivers

        3.1.2. Restraints

        3.1.3. Opportunity

        3.1.4. Trends

    3.2. Scenario Forecast

        3.2.1. Demand in Optimistic Scenario

        3.2.2. Demand in Likely Scenario

        3.2.3. Demand in Conservative Scenario

    3.3. Opportunity Map Analysis

    3.4. Product Life Cycle Analysis

    3.5. Supply Chain Analysis

        3.5.1. Supply Side Participants and their Roles

            3.5.1.1. Producers

            3.5.1.2. Mid-Level Participants (Traders/ Agents/ Brokers)

            3.5.1.3. Wholesalers and Distributors

        3.5.2. Value Added and Value Created at Node in the Supply Chain

        3.5.3. List of Raw Material Suppliers

        3.5.4. List of Existing and Potential Buyer’s

    3.6. Investment Feasibility Matrix

    3.7. Value Chain Analysis

        3.7.1. Profit Margin Analysis

        3.7.2. Wholesalers and Distributors

        3.7.3. Retailers

    3.8. PESTLE and Porter’s Analysis

    3.9. Regulatory Landscape

        3.9.1. By Key Regions

        3.9.2. By Key Countries

    3.10. Regional Parent Market Outlook

    3.11. Production and Consumption Statistics

    3.12. Import and Export Statistics

4. Global Market Analysis 2018 to 2022 and Forecast, 2023 to 2033

    4.1. Historical Market Size Value (US$ Million) & Volume (Units) Analysis, 2018 to 2022

    4.2. Current and Future Market Size Value (US$ Million) & Volume (Units) Projections, 2023 to 2033

        4.2.1. Y-o-Y Growth Trend Analysis

        4.2.2. Absolute $ Opportunity Analysis

5. Global Market Analysis 2018 to 2022 and Forecast 2023 to 2033, By Functions

    5.1. Introduction / Key Findings

    5.2. Historical Market Size Value (US$ Million) & Volume (Units) Analysis By Functions, 2018 to 2022

    5.3. Current and Future Market Size Value (US$ Million) & Volume (Units) Analysis and Forecast By Functions, 2023 to 2033

        5.3.1. Dimming Function

        5.3.2. Indicating Function

    5.4. Y-o-Y Growth Trend Analysis By Functions, 2018 to 2022

    5.5. Absolute $ Opportunity Analysis By Functions, 2023 to 2033

6. Global Market Analysis 2018 to 2022 and Forecast 2023 to 2033, By Beam

    6.1. Introduction / Key Findings

    6.2. Historical Market Size Value (US$ Million) & Volume (Units) Analysis By Beam, 2018 to 2022

    6.3. Current and Future Market Size Value (US$ Million) & Volume (Units) Analysis and Forecast By Beam, 2023 to 2033

        6.3.1. Low Beam LED Control Value (US$ Million) & Volume (Units)

        6.3.2. High Beam LED Control Value (US$ Million) & Volume (Units)

        6.3.3. Glare-free High Beam LED Control Value (US$ Million) & Volume (Units)

    6.4. Y-o-Y Growth Trend Analysis By Beam, 2018 to 2022

    6.5. Absolute $ Opportunity Analysis By Beam, 2023 to 2033

7. Global Market Analysis 2018 to 2022 and Forecast 2023 to 2033, By Light Type

    7.1. Introduction / Key Findings

    7.2. Historical Market Size Value (US$ Million) & Volume (Units) Analysis By Light Type, 2018 to 2022

    7.3. Current and Future Market Size Value (US$ Million) & Volume (Units) Analysis and Forecast By Light Type, 2023 to 2033

        7.3.1. Spotlight LED Control Value (US$ Million) & Volume (Units)

        7.3.2. Pixel light LED Control Value (US$ Million) & Volume (Units)

    7.4. Y-o-Y Growth Trend Analysis By Light Type, 2018 to 2022

    7.5. Absolute $ Opportunity Analysis By Light Type, 2023 to 2033

8. Global Market Analysis 2018 to 2022 and Forecast 2023 to 2033, By End Use

    8.1. Introduction / Key Findings

    8.2. Historical Market Size Value (US$ Million) & Volume (Units) Analysis By End Use, 2018 to 2022

    8.3. Current and Future Market Size Value (US$ Million) & Volume (Units) Analysis and Forecast By End Use, 2023 to 2033

        8.3.1. LED Control Value (US$ Million) & Volume (Units)s for Commercial Lights

        8.3.2. LED Control Value (US$ Million) & Volume (Units)s for Industrial Lights

    8.4. Y-o-Y Growth Trend Analysis By End Use, 2018 to 2022

    8.5. Absolute $ Opportunity Analysis By End Use, 2023 to 2033

9. Global Market Analysis 2018 to 2022 and Forecast 2023 to 2033, By Region

    9.1. Introduction

    9.2. Historical Market Size Value (US$ Million) & Volume (Units) Analysis By Region, 2018 to 2022

    9.3. Current Market Size Value (US$ Million) & Volume (Units) Analysis and Forecast By Region, 2023 to 2033

        9.3.1. North America

        9.3.2. Latin America

        9.3.3. Western Europe

        9.3.4. Eastern Europe

        9.3.5. South Asia and Pacific

        9.3.6. East Asia

        9.3.7. Middle East and Africa

    9.4. Market Attractiveness Analysis By Region

10. North America Market Analysis 2018 to 2022 and Forecast 2023 to 2033, By Country

    10.1. Historical Market Size Value (US$ Million) & Volume (Units) Trend Analysis By Market Taxonomy, 2018 to 2022

    10.2. Market Size Value (US$ Million) & Volume (Units) Forecast By Market Taxonomy, 2023 to 2033

        10.2.1. By Country

            10.2.1.1. The USA

            10.2.1.2. Canada

        10.2.2. By Functions

        10.2.3. By Beam

        10.2.4. By Light Type

        10.2.5. By End Use

    10.3. Market Attractiveness Analysis

        10.3.1. By Country

        10.3.2. By Functions

        10.3.3. By Beam

        10.3.4. By Light Type

        10.3.5. By End Use

    10.4. Key Takeaways

11. Latin America Market Analysis 2018 to 2022 and Forecast 2023 to 2033, By Country

    11.1. Historical Market Size Value (US$ Million) & Volume (Units) Trend Analysis By Market Taxonomy, 2018 to 2022

    11.2. Market Size Value (US$ Million) & Volume (Units) Forecast By Market Taxonomy, 2023 to 2033

        11.2.1. By Country

            11.2.1.1. Brazil

            11.2.1.2. Mexico

            11.2.1.3. Rest of Latin America

        11.2.2. By Functions

        11.2.3. By Beam

        11.2.4. By Light Type

        11.2.5. By End Use

    11.3. Market Attractiveness Analysis

        11.3.1. By Country

        11.3.2. By Functions

        11.3.3. By Beam

        11.3.4. By Light Type

        11.3.5. By End Use

    11.4. Key Takeaways

12. Western Europe Market Analysis 2018 to 2022 and Forecast 2023 to 2033, By Country

    12.1. Historical Market Size Value (US$ Million) & Volume (Units) Trend Analysis By Market Taxonomy, 2018 to 2022

    12.2. Market Size Value (US$ Million) & Volume (Units) Forecast By Market Taxonomy, 2023 to 2033

        12.2.1. By Country

            12.2.1.1. Germany

            12.2.1.2. United Kingdom

            12.2.1.3. France

            12.2.1.4. Spain

            12.2.1.5. Italy

            12.2.1.6. Rest of Western Europe

        12.2.2. By Functions

        12.2.3. By Beam

        12.2.4. By Light Type

        12.2.5. By End Use

    12.3. Market Attractiveness Analysis

        12.3.1. By Country

        12.3.2. By Functions

        12.3.3. By Beam

        12.3.4. By Light Type

        12.3.5. By End Use

    12.4. Key Takeaways

13. Eastern Europe Market Analysis 2018 to 2022 and Forecast 2023 to 2033, By Country

    13.1. Historical Market Size Value (US$ Million) & Volume (Units) Trend Analysis By Market Taxonomy, 2018 to 2022

    13.2. Market Size Value (US$ Million) & Volume (Units) Forecast By Market Taxonomy, 2023 to 2033

        13.2.1. By Country

            13.2.1.1. Poland

            13.2.1.2. Russia

            13.2.1.3. Czech Republic

            13.2.1.4. Romania

            13.2.1.5. Rest of Eastern Europe

        13.2.2. By Functions

        13.2.3. By Beam

        13.2.4. By Light Type

        13.2.5. By End Use

    13.3. Market Attractiveness Analysis

        13.3.1. By Country

        13.3.2. By Functions

        13.3.3. By Beam

        13.3.4. By Light Type

        13.3.5. By End Use

    13.4. Key Takeaways

14. South Asia and Pacific Market Analysis 2018 to 2022 and Forecast 2023 to 2033, By Country

    14.1. Historical Market Size Value (US$ Million) & Volume (Units) Trend Analysis By Market Taxonomy, 2018 to 2022

    14.2. Market Size Value (US$ Million) & Volume (Units) Forecast By Market Taxonomy, 2023 to 2033

        14.2.1. By Country

            14.2.1.1. India

            14.2.1.2. Bangladesh

            14.2.1.3. Australia

            14.2.1.4. New Zealand

            14.2.1.5. Rest of South Asia and Pacific

        14.2.2. By Functions

        14.2.3. By Beam

        14.2.4. By Light Type

        14.2.5. By End Use

    14.3. Market Attractiveness Analysis

        14.3.1. By Country

        14.3.2. By Functions

        14.3.3. By Beam

        14.3.4. By Light Type

        14.3.5. By End Use

    14.4. Key Takeaways

15. East Asia Market Analysis 2018 to 2022 and Forecast 2023 to 2033, By Country

    15.1. Historical Market Size Value (US$ Million) & Volume (Units) Trend Analysis By Market Taxonomy, 2018 to 2022

    15.2. Market Size Value (US$ Million) & Volume (Units) Forecast By Market Taxonomy, 2023 to 2033

        15.2.1. By Country

            15.2.1.1. China

            15.2.1.2. Japan

            15.2.1.3. South Korea

        15.2.2. By Functions

        15.2.3. By Beam

        15.2.4. By Light Type

        15.2.5. By End Use

    15.3. Market Attractiveness Analysis

        15.3.1. By Country

        15.3.2. By Functions

        15.3.3. By Beam

        15.3.4. By Light Type

        15.3.5. By End Use

    15.4. Key Takeaways

16. Middle East and Africa Market Analysis 2018 to 2022 and Forecast 2023 to 2033, By Country

    16.1. Historical Market Size Value (US$ Million) & Volume (Units) Trend Analysis By Market Taxonomy, 2018 to 2022

    16.2. Market Size Value (US$ Million) & Volume (Units) Forecast By Market Taxonomy, 2023 to 2033

        16.2.1. By Country

            16.2.1.1. GCC Countries

            16.2.1.2. South Africa

            16.2.1.3. Israel

            16.2.1.4. Rest of MEA

        16.2.2. By Functions

        16.2.3. By Beam

        16.2.4. By Light Type

        16.2.5. By End Use

    16.3. Market Attractiveness Analysis

        16.3.1. By Country

        16.3.2. By Functions

        16.3.3. By Beam

        16.3.4. By Light Type

        16.3.5. By End Use

    16.4. Key Takeaways

17. Key Countries Market Analysis

    17.1. USA

        17.1.1. Pricing Analysis

        17.1.2. Market Share Analysis, 2022

            17.1.2.1. By Functions

            17.1.2.2. By Beam

            17.1.2.3. By Light Type

            17.1.2.4. By End Use

    17.2. Canada

        17.2.1. Pricing Analysis

        17.2.2. Market Share Analysis, 2022

            17.2.2.1. By Functions

            17.2.2.2. By Beam

            17.2.2.3. By Light Type

            17.2.2.4. By End Use

    17.3. Brazil

        17.3.1. Pricing Analysis

        17.3.2. Market Share Analysis, 2022

            17.3.2.1. By Functions

            17.3.2.2. By Beam

            17.3.2.3. By Light Type

            17.3.2.4. By End Use

    17.4. Mexico

        17.4.1. Pricing Analysis

        17.4.2. Market Share Analysis, 2022

            17.4.2.1. By Functions

            17.4.2.2. By Beam

            17.4.2.3. By Light Type

            17.4.2.4. By End Use

    17.5. Germany

        17.5.1. Pricing Analysis

        17.5.2. Market Share Analysis, 2022

            17.5.2.1. By Functions

            17.5.2.2. By Beam

            17.5.2.3. By Light Type

            17.5.2.4. By End Use

    17.6. United Kingdom

        17.6.1. Pricing Analysis

        17.6.2. Market Share Analysis, 2022

            17.6.2.1. By Functions

            17.6.2.2. By Beam

            17.6.2.3. By Light Type

            17.6.2.4. By End Use

    17.7. France

        17.7.1. Pricing Analysis

        17.7.2. Market Share Analysis, 2022

            17.7.2.1. By Functions

            17.7.2.2. By Beam

            17.7.2.3. By Light Type

            17.7.2.4. By End Use

    17.8. Spain

        17.8.1. Pricing Analysis

        17.8.2. Market Share Analysis, 2022

            17.8.2.1. By Functions

            17.8.2.2. By Beam

            17.8.2.3. By Light Type

            17.8.2.4. By End Use

    17.9. Italy

        17.9.1. Pricing Analysis

        17.9.2. Market Share Analysis, 2022

            17.9.2.1. By Functions

            17.9.2.2. By Beam

            17.9.2.3. By Light Type

            17.9.2.4. By End Use

    17.10. Poland

        17.10.1. Pricing Analysis

        17.10.2. Market Share Analysis, 2022

            17.10.2.1. By Functions

            17.10.2.2. By Beam

            17.10.2.3. By Light Type

            17.10.2.4. By End Use

    17.11. Russia

        17.11.1. Pricing Analysis

        17.11.2. Market Share Analysis, 2022

            17.11.2.1. By Functions

            17.11.2.2. By Beam

            17.11.2.3. By Light Type

            17.11.2.4. By End Use

    17.12. Czech Republic

        17.12.1. Pricing Analysis

        17.12.2. Market Share Analysis, 2022

            17.12.2.1. By Functions

            17.12.2.2. By Beam

            17.12.2.3. By Light Type

            17.12.2.4. By End Use

    17.13. Romania

        17.13.1. Pricing Analysis

        17.13.2. Market Share Analysis, 2022

            17.13.2.1. By Functions

            17.13.2.2. By Beam

            17.13.2.3. By Light Type

            17.13.2.4. By End Use

    17.14. India

        17.14.1. Pricing Analysis

        17.14.2. Market Share Analysis, 2022

            17.14.2.1. By Functions

            17.14.2.2. By Beam

            17.14.2.3. By Light Type

            17.14.2.4. By End Use

    17.15. Bangladesh

        17.15.1. Pricing Analysis

        17.15.2. Market Share Analysis, 2022

            17.15.2.1. By Functions

            17.15.2.2. By Beam

            17.15.2.3. By Light Type

            17.15.2.4. By End Use

    17.16. Australia

        17.16.1. Pricing Analysis

        17.16.2. Market Share Analysis, 2022

            17.16.2.1. By Functions

            17.16.2.2. By Beam

            17.16.2.3. By Light Type

            17.16.2.4. By End Use

    17.17. New Zealand

        17.17.1. Pricing Analysis

        17.17.2. Market Share Analysis, 2022

            17.17.2.1. By Functions

            17.17.2.2. By Beam

            17.17.2.3. By Light Type

            17.17.2.4. By End Use

    17.18. China

        17.18.1. Pricing Analysis

        17.18.2. Market Share Analysis, 2022

            17.18.2.1. By Functions

            17.18.2.2. By Beam

            17.18.2.3. By Light Type

            17.18.2.4. By End Use

    17.19. Japan

        17.19.1. Pricing Analysis

        17.19.2. Market Share Analysis, 2022

            17.19.2.1. By Functions

            17.19.2.2. By Beam

            17.19.2.3. By Light Type

            17.19.2.4. By End Use

    17.20. South Korea

        17.20.1. Pricing Analysis

        17.20.2. Market Share Analysis, 2022

            17.20.2.1. By Functions

            17.20.2.2. By Beam

            17.20.2.3. By Light Type

            17.20.2.4. By End Use

    17.21. GCC Countries

        17.21.1. Pricing Analysis

        17.21.2. Market Share Analysis, 2022

            17.21.2.1. By Functions

            17.21.2.2. By Beam

            17.21.2.3. By Light Type

            17.21.2.4. By End Use

    17.22. South Africa

        17.22.1. Pricing Analysis

        17.22.2. Market Share Analysis, 2022

            17.22.2.1. By Functions

            17.22.2.2. By Beam

            17.22.2.3. By Light Type

            17.22.2.4. By End Use

    17.23. Israel

        17.23.1. Pricing Analysis

        17.23.2. Market Share Analysis, 2022

            17.23.2.1. By Functions

            17.23.2.2. By Beam

            17.23.2.3. By Light Type

            17.23.2.4. By End Use

18. Market Structure Analysis

    18.1. Competition Dashboard

    18.2. Competition Benchmarking

    18.3. Market Share Analysis of Top Players

        18.3.1. By Regional

        18.3.2. By Functions

        18.3.3. By Beam

        18.3.4. By Light Type

        18.3.5. By End Use

19. Competition Analysis

    19.1. Competition Deep Dive

        19.1.1. Mitsubishi Electric

            19.1.1.1. Overview

            19.1.1.2. Product Portfolio

            19.1.1.3. Profitability by Market Segments

            19.1.1.4. Sales Footprint

            19.1.1.5. Strategy Overview

                19.1.1.5.1. Marketing Strategy

                19.1.1.5.2. Product Strategy

                19.1.1.5.3. Channel Strategy

        19.1.2. Lumileds

            19.1.2.1. Overview

            19.1.2.2. Product Portfolio

            19.1.2.3. Profitability by Market Segments

            19.1.2.4. Sales Footprint

            19.1.2.5. Strategy Overview

                19.1.2.5.1. Marketing Strategy

                19.1.2.5.2. Product Strategy

                19.1.2.5.3. Channel Strategy

        19.1.3. Nichia

            19.1.3.1. Overview

            19.1.3.2. Product Portfolio

            19.1.3.3. Profitability by Market Segments

            19.1.3.4. Sales Footprint

            19.1.3.5. Strategy Overview

                19.1.3.5.1. Marketing Strategy

                19.1.3.5.2. Product Strategy

                19.1.3.5.3. Channel Strategy

        19.1.4. Samsung Electronics

            19.1.4.1. Overview

            19.1.4.2. Product Portfolio

            19.1.4.3. Profitability by Market Segments

            19.1.4.4. Sales Footprint

            19.1.4.5. Strategy Overview

                19.1.4.5.1. Marketing Strategy

                19.1.4.5.2. Product Strategy

                19.1.4.5.3. Channel Strategy

        19.1.5. Seoul Semiconductor

            19.1.5.1. Overview

            19.1.5.2. Product Portfolio

            19.1.5.3. Profitability by Market Segments

            19.1.5.4. Sales Footprint

            19.1.5.5. Strategy Overview

                19.1.5.5.1. Marketing Strategy

                19.1.5.5.2. Product Strategy

                19.1.5.5.3. Channel Strategy

        19.1.6. Photonic Corporation

            19.1.6.1. Overview

            19.1.6.2. Product Portfolio

            19.1.6.3. Profitability by Market Segments

            19.1.6.4. Sales Footprint

            19.1.6.5. Strategy Overview

                19.1.6.5.1. Marketing Strategy

                19.1.6.5.2. Product Strategy

                19.1.6.5.3. Channel Strategy

        19.1.7. Continental Company

            19.1.7.1. Overview

            19.1.7.2. Product Portfolio

            19.1.7.3. Profitability by Market Segments

            19.1.7.4. Sales Footprint

            19.1.7.5. Strategy Overview

                19.1.7.5.1. Marketing Strategy

                19.1.7.5.2. Product Strategy

                19.1.7.5.3. Channel Strategy

        19.1.8. CCS Inc.

            19.1.8.1. Overview

            19.1.8.2. Product Portfolio

            19.1.8.3. Profitability by Market Segments

            19.1.8.4. Sales Footprint

            19.1.8.5. Strategy Overview

                19.1.8.5.1. Marketing Strategy

                19.1.8.5.2. Product Strategy

                19.1.8.5.3. Channel Strategy

        19.1.9. Sesaly Company

            19.1.9.1. Overview

            19.1.9.2. Product Portfolio

            19.1.9.3. Profitability by Market Segments

            19.1.9.4. Sales Footprint

            19.1.9.5. Strategy Overview

                19.1.9.5.1. Marketing Strategy

                19.1.9.5.2. Product Strategy

                19.1.9.5.3. Channel Strategy

        19.1.10. APL Machinery Pvt. Ltd.

            19.1.10.1. Overview

            19.1.10.2. Product Portfolio

            19.1.10.3. Profitability by Market Segments

            19.1.10.4. Sales Footprint

            19.1.10.5. Strategy Overview

                19.1.10.5.1. Marketing Strategy

                19.1.10.5.2. Product Strategy

                19.1.10.5.3. Channel Strategy

20. Assumptions & Acronyms Used

21. Research Methodology

List of Tables

Table 1: Global Market Value (US$ Million) Forecast by Region, 2018 to 2033

Table 2: Global Market Volume (Units) Forecast by Region, 2018 to 2033

Table 3: Global Market Value (US$ Million) Forecast by Functions, 2018 to 2033

Table 4: Global Market Volume (Units) Forecast by Functions, 2018 to 2033

Table 5: Global Market Value (US$ Million) Forecast by Beam, 2018 to 2033

Table 6: Global Market Volume (Units) Forecast by Beam, 2018 to 2033

Table 7: Global Market Value (US$ Million) Forecast by Light Type, 2018 to 2033

Table 8: Global Market Volume (Units) Forecast by Light Type, 2018 to 2033

Table 9: Global Market Value (US$ Million) Forecast by End Use, 2018 to 2033

Table 10: Global Market Volume (Units) Forecast by End Use, 2018 to 2033

Table 11: North America Market Value (US$ Million) Forecast by Country, 2018 to 2033

Table 12: North America Market Volume (Units) Forecast by Country, 2018 to 2033

Table 13: North America Market Value (US$ Million) Forecast by Functions, 2018 to 2033

Table 14: North America Market Volume (Units) Forecast by Functions, 2018 to 2033

Table 15: North America Market Value (US$ Million) Forecast by Beam, 2018 to 2033

Table 16: North America Market Volume (Units) Forecast by Beam, 2018 to 2033

Table 17: North America Market Value (US$ Million) Forecast by Light Type, 2018 to 2033

Table 18: North America Market Volume (Units) Forecast by Light Type, 2018 to 2033

Table 19: North America Market Value (US$ Million) Forecast by End Use, 2018 to 2033

Table 20: North America Market Volume (Units) Forecast by End Use, 2018 to 2033

Table 21: Latin America Market Value (US$ Million) Forecast by Country, 2018 to 2033

Table 22: Latin America Market Volume (Units) Forecast by Country, 2018 to 2033

Table 23: Latin America Market Value (US$ Million) Forecast by Functions, 2018 to 2033

Table 24: Latin America Market Volume (Units) Forecast by Functions, 2018 to 2033

Table 25: Latin America Market Value (US$ Million) Forecast by Beam, 2018 to 2033

Table 26: Latin America Market Volume (Units) Forecast by Beam, 2018 to 2033

Table 27: Latin America Market Value (US$ Million) Forecast by Light Type, 2018 to 2033

Table 28: Latin America Market Volume (Units) Forecast by Light Type, 2018 to 2033

Table 29: Latin America Market Value (US$ Million) Forecast by End Use, 2018 to 2033

Table 30: Latin America Market Volume (Units) Forecast by End Use, 2018 to 2033

Table 31: Western Europe Market Value (US$ Million) Forecast by Country, 2018 to 2033

Table 32: Western Europe Market Volume (Units) Forecast by Country, 2018 to 2033

Table 33: Western Europe Market Value (US$ Million) Forecast by Functions, 2018 to 2033

Table 34: Western Europe Market Volume (Units) Forecast by Functions, 2018 to 2033

Table 35: Western Europe Market Value (US$ Million) Forecast by Beam, 2018 to 2033

Table 36: Western Europe Market Volume (Units) Forecast by Beam, 2018 to 2033

Table 37: Western Europe Market Value (US$ Million) Forecast by Light Type, 2018 to 2033

Table 38: Western Europe Market Volume (Units) Forecast by Light Type, 2018 to 2033

Table 39: Western Europe Market Value (US$ Million) Forecast by End Use, 2018 to 2033

Table 40: Western Europe Market Volume (Units) Forecast by End Use, 2018 to 2033

Table 41: Eastern Europe Market Value (US$ Million) Forecast by Country, 2018 to 2033

Table 42: Eastern Europe Market Volume (Units) Forecast by Country, 2018 to 2033

Table 43: Eastern Europe Market Value (US$ Million) Forecast by Functions, 2018 to 2033

Table 44: Eastern Europe Market Volume (Units) Forecast by Functions, 2018 to 2033

Table 45: Eastern Europe Market Value (US$ Million) Forecast by Beam, 2018 to 2033

Table 46: Eastern Europe Market Volume (Units) Forecast by Beam, 2018 to 2033

Table 47: Eastern Europe Market Value (US$ Million) Forecast by Light Type, 2018 to 2033

Table 48: Eastern Europe Market Volume (Units) Forecast by Light Type, 2018 to 2033

Table 49: Eastern Europe Market Value (US$ Million) Forecast by End Use, 2018 to 2033

Table 50: Eastern Europe Market Volume (Units) Forecast by End Use, 2018 to 2033

Table 51: South Asia and Pacific Market Value (US$ Million) Forecast by Country, 2018 to 2033

Table 52: South Asia and Pacific Market Volume (Units) Forecast by Country, 2018 to 2033

Table 53: South Asia and Pacific Market Value (US$ Million) Forecast by Functions, 2018 to 2033

Table 54: South Asia and Pacific Market Volume (Units) Forecast by Functions, 2018 to 2033

Table 55: South Asia and Pacific Market Value (US$ Million) Forecast by Beam, 2018 to 2033

Table 56: South Asia and Pacific Market Volume (Units) Forecast by Beam, 2018 to 2033

Table 57: South Asia and Pacific Market Value (US$ Million) Forecast by Light Type, 2018 to 2033

Table 58: South Asia and Pacific Market Volume (Units) Forecast by Light Type, 2018 to 2033

Table 59: South Asia and Pacific Market Value (US$ Million) Forecast by End Use, 2018 to 2033

Table 60: South Asia and Pacific Market Volume (Units) Forecast by End Use, 2018 to 2033

Table 61: East Asia Market Value (US$ Million) Forecast by Country, 2018 to 2033

Table 62: East Asia Market Volume (Units) Forecast by Country, 2018 to 2033

Table 63: East Asia Market Value (US$ Million) Forecast by Functions, 2018 to 2033

Table 64: East Asia Market Volume (Units) Forecast by Functions, 2018 to 2033

Table 65: East Asia Market Value (US$ Million) Forecast by Beam, 2018 to 2033

Table 66: East Asia Market Volume (Units) Forecast by Beam, 2018 to 2033

Table 67: East Asia Market Value (US$ Million) Forecast by Light Type, 2018 to 2033

Table 68: East Asia Market Volume (Units) Forecast by Light Type, 2018 to 2033

Table 69: East Asia Market Value (US$ Million) Forecast by End Use, 2018 to 2033

Table 70: East Asia Market Volume (Units) Forecast by End Use, 2018 to 2033

Table 71: Middle East and Africa Market Value (US$ Million) Forecast by Country, 2018 to 2033

Table 72: Middle East and Africa Market Volume (Units) Forecast by Country, 2018 to 2033

Table 73: Middle East and Africa Market Value (US$ Million) Forecast by Functions, 2018 to 2033

Table 74: Middle East and Africa Market Volume (Units) Forecast by Functions, 2018 to 2033

Table 75: Middle East and Africa Market Value (US$ Million) Forecast by Beam, 2018 to 2033

Table 76: Middle East and Africa Market Volume (Units) Forecast by Beam, 2018 to 2033

Table 77: Middle East and Africa Market Value (US$ Million) Forecast by Light Type, 2018 to 2033

Table 78: Middle East and Africa Market Volume (Units) Forecast by Light Type, 2018 to 2033

Table 79: Middle East and Africa Market Value (US$ Million) Forecast by End Use, 2018 to 2033

Table 80: Middle East and Africa Market Volume (Units) Forecast by End Use, 2018 to 2033

List of Charts

Figure 1: Global Market Value (US$ Million) by Functions, 2023 to 2033

Figure 2: Global Market Value (US$ Million) by Beam, 2023 to 2033

Figure 3: Global Market Value (US$ Million) by Light Type, 2023 to 2033

Figure 4: Global Market Value (US$ Million) by End Use, 2023 to 2033

Figure 5: Global Market Value (US$ Million) by Region, 2023 to 2033

Figure 6: Global Market Value (US$ Million) Analysis by Region, 2018 to 2033

Figure 7: Global Market Volume (Units) Analysis by Region, 2018 to 2033

Figure 8: Global Market Value Share (%) and BPS Analysis by Region, 2023 to 2033

Figure 9: Global Market Y-o-Y Growth (%) Projections by Region, 2023 to 2033

Figure 10: Global Market Value (US$ Million) Analysis by Functions, 2018 to 2033

Figure 11: Global Market Volume (Units) Analysis by Functions, 2018 to 2033

Figure 12: Global Market Value Share (%) and BPS Analysis by Functions, 2023 to 2033

Figure 13: Global Market Y-o-Y Growth (%) Projections by Functions, 2023 to 2033

Figure 14: Global Market Value (US$ Million) Analysis by Beam, 2018 to 2033

Figure 15: Global Market Volume (Units) Analysis by Beam, 2018 to 2033

Figure 16: Global Market Value Share (%) and BPS Analysis by Beam, 2023 to 2033

Figure 17: Global Market Y-o-Y Growth (%) Projections by Beam, 2023 to 2033

Figure 18: Global Market Value (US$ Million) Analysis by Light Type, 2018 to 2033

Figure 19: Global Market Volume (Units) Analysis by Light Type, 2018 to 2033

Figure 20: Global Market Value Share (%) and BPS Analysis by Light Type, 2023 to 2033

Figure 21: Global Market Y-o-Y Growth (%) Projections by Light Type, 2023 to 2033

Figure 22: Global Market Value (US$ Million) Analysis by End Use, 2018 to 2033

Figure 23: Global Market Volume (Units) Analysis by End Use, 2018 to 2033

Figure 24: Global Market Value Share (%) and BPS Analysis by End Use, 2023 to 2033

Figure 25: Global Market Y-o-Y Growth (%) Projections by End Use, 2023 to 2033

Figure 26: Global Market Attractiveness by Functions, 2023 to 2033

Figure 27: Global Market Attractiveness by Beam, 2023 to 2033

Figure 28: Global Market Attractiveness by Light Type, 2023 to 2033

Figure 29: Global Market Attractiveness by End Use, 2023 to 2033

Figure 30: Global Market Attractiveness by Region, 2023 to 2033

Figure 31: North America Market Value (US$ Million) by Functions, 2023 to 2033

Figure 32: North America Market Value (US$ Million) by Beam, 2023 to 2033

Figure 33: North America Market Value (US$ Million) by Light Type, 2023 to 2033

Figure 34: North America Market Value (US$ Million) by End Use, 2023 to 2033

Figure 35: North America Market Value (US$ Million) by Country, 2023 to 2033

Figure 36: North America Market Value (US$ Million) Analysis by Country, 2018 to 2033

Figure 37: North America Market Volume (Units) Analysis by Country, 2018 to 2033

Figure 38: North America Market Value Share (%) and BPS Analysis by Country, 2023 to 2033

Figure 39: North America Market Y-o-Y Growth (%) Projections by Country, 2023 to 2033

Figure 40: North America Market Value (US$ Million) Analysis by Functions, 2018 to 2033

Figure 41: North America Market Volume (Units) Analysis by Functions, 2018 to 2033

Figure 42: North America Market Value Share (%) and BPS Analysis by Functions, 2023 to 2033

Figure 43: North America Market Y-o-Y Growth (%) Projections by Functions, 2023 to 2033

Figure 44: North America Market Value (US$ Million) Analysis by Beam, 2018 to 2033

Figure 45: North America Market Volume (Units) Analysis by Beam, 2018 to 2033

Figure 46: North America Market Value Share (%) and BPS Analysis by Beam, 2023 to 2033

Figure 47: North America Market Y-o-Y Growth (%) Projections by Beam, 2023 to 2033

Figure 48: North America Market Value (US$ Million) Analysis by Light Type, 2018 to 2033

Figure 49: North America Market Volume (Units) Analysis by Light Type, 2018 to 2033

Figure 50: North America Market Value Share (%) and BPS Analysis by Light Type, 2023 to 2033

Figure 51: North America Market Y-o-Y Growth (%) Projections by Light Type, 2023 to 2033

Figure 52: North America Market Value (US$ Million) Analysis by End Use, 2018 to 2033

Figure 53: North America Market Volume (Units) Analysis by End Use, 2018 to 2033

Figure 54: North America Market Value Share (%) and BPS Analysis by End Use, 2023 to 2033

Figure 55: North America Market Y-o-Y Growth (%) Projections by End Use, 2023 to 2033

Figure 56: North America Market Attractiveness by Functions, 2023 to 2033

Figure 57: North America Market Attractiveness by Beam, 2023 to 2033

Figure 58: North America Market Attractiveness by Light Type, 2023 to 2033

Figure 59: North America Market Attractiveness by End Use, 2023 to 2033

Figure 60: North America Market Attractiveness by Country, 2023 to 2033

Figure 61: Latin America Market Value (US$ Million) by Functions, 2023 to 2033

Figure 62: Latin America Market Value (US$ Million) by Beam, 2023 to 2033

Figure 63: Latin America Market Value (US$ Million) by Light Type, 2023 to 2033

Figure 64: Latin America Market Value (US$ Million) by End Use, 2023 to 2033

Figure 65: Latin America Market Value (US$ Million) by Country, 2023 to 2033

Figure 66: Latin America Market Value (US$ Million) Analysis by Country, 2018 to 2033

Figure 67: Latin America Market Volume (Units) Analysis by Country, 2018 to 2033

Figure 68: Latin America Market Value Share (%) and BPS Analysis by Country, 2023 to 2033

Figure 69: Latin America Market Y-o-Y Growth (%) Projections by Country, 2023 to 2033

Figure 70: Latin America Market Value (US$ Million) Analysis by Functions, 2018 to 2033

Figure 71: Latin America Market Volume (Units) Analysis by Functions, 2018 to 2033

Figure 72: Latin America Market Value Share (%) and BPS Analysis by Functions, 2023 to 2033

Figure 73: Latin America Market Y-o-Y Growth (%) Projections by Functions, 2023 to 2033

Figure 74: Latin America Market Value (US$ Million) Analysis by Beam, 2018 to 2033

Figure 75: Latin America Market Volume (Units) Analysis by Beam, 2018 to 2033

Figure 76: Latin America Market Value Share (%) and BPS Analysis by Beam, 2023 to 2033

Figure 77: Latin America Market Y-o-Y Growth (%) Projections by Beam, 2023 to 2033

Figure 78: Latin America Market Value (US$ Million) Analysis by Light Type, 2018 to 2033

Figure 79: Latin America Market Volume (Units) Analysis by Light Type, 2018 to 2033

Figure 80: Latin America Market Value Share (%) and BPS Analysis by Light Type, 2023 to 2033

Figure 81: Latin America Market Y-o-Y Growth (%) Projections by Light Type, 2023 to 2033

Figure 82: Latin America Market Value (US$ Million) Analysis by End Use, 2018 to 2033

Figure 83: Latin America Market Volume (Units) Analysis by End Use, 2018 to 2033

Figure 84: Latin America Market Value Share (%) and BPS Analysis by End Use, 2023 to 2033

Figure 85: Latin America Market Y-o-Y Growth (%) Projections by End Use, 2023 to 2033

Figure 86: Latin America Market Attractiveness by Functions, 2023 to 2033

Figure 87: Latin America Market Attractiveness by Beam, 2023 to 2033

Figure 88: Latin America Market Attractiveness by Light Type, 2023 to 2033

Figure 89: Latin America Market Attractiveness by End Use, 2023 to 2033

Figure 90: Latin America Market Attractiveness by Country, 2023 to 2033

Figure 91: Western Europe Market Value (US$ Million) by Functions, 2023 to 2033

Figure 92: Western Europe Market Value (US$ Million) by Beam, 2023 to 2033

Figure 93: Western Europe Market Value (US$ Million) by Light Type, 2023 to 2033

Figure 94: Western Europe Market Value (US$ Million) by End Use, 2023 to 2033

Figure 95: Western Europe Market Value (US$ Million) by Country, 2023 to 2033

Figure 96: Western Europe Market Value (US$ Million) Analysis by Country, 2018 to 2033

Figure 97: Western Europe Market Volume (Units) Analysis by Country, 2018 to 2033

Figure 98: Western Europe Market Value Share (%) and BPS Analysis by Country, 2023 to 2033

Figure 99: Western Europe Market Y-o-Y Growth (%) Projections by Country, 2023 to 2033

Figure 100: Western Europe Market Value (US$ Million) Analysis by Functions, 2018 to 2033

Figure 101: Western Europe Market Volume (Units) Analysis by Functions, 2018 to 2033

Figure 102: Western Europe Market Value Share (%) and BPS Analysis by Functions, 2023 to 2033

Figure 103: Western Europe Market Y-o-Y Growth (%) Projections by Functions, 2023 to 2033

Figure 104: Western Europe Market Value (US$ Million) Analysis by Beam, 2018 to 2033

Figure 105: Western Europe Market Volume (Units) Analysis by Beam, 2018 to 2033

Figure 106: Western Europe Market Value Share (%) and BPS Analysis by Beam, 2023 to 2033

Figure 107: Western Europe Market Y-o-Y Growth (%) Projections by Beam, 2023 to 2033

Figure 108: Western Europe Market Value (US$ Million) Analysis by Light Type, 2018 to 2033

Figure 109: Western Europe Market Volume (Units) Analysis by Light Type, 2018 to 2033

Figure 110: Western Europe Market Value Share (%) and BPS Analysis by Light Type, 2023 to 2033

Figure 111: Western Europe Market Y-o-Y Growth (%) Projections by Light Type, 2023 to 2033

Figure 112: Western Europe Market Value (US$ Million) Analysis by End Use, 2018 to 2033

Figure 113: Western Europe Market Volume (Units) Analysis by End Use, 2018 to 2033

Figure 114: Western Europe Market Value Share (%) and BPS Analysis by End Use, 2023 to 2033

Figure 115: Western Europe Market Y-o-Y Growth (%) Projections by End Use, 2023 to 2033

Figure 116: Western Europe Market Attractiveness by Functions, 2023 to 2033

Figure 117: Western Europe Market Attractiveness by Beam, 2023 to 2033

Figure 118: Western Europe Market Attractiveness by Light Type, 2023 to 2033

Figure 119: Western Europe Market Attractiveness by End Use, 2023 to 2033

Figure 120: Western Europe Market Attractiveness by Country, 2023 to 2033

Figure 121: Eastern Europe Market Value (US$ Million) by Functions, 2023 to 2033

Figure 122: Eastern Europe Market Value (US$ Million) by Beam, 2023 to 2033

Figure 123: Eastern Europe Market Value (US$ Million) by Light Type, 2023 to 2033

Figure 124: Eastern Europe Market Value (US$ Million) by End Use, 2023 to 2033

Figure 125: Eastern Europe Market Value (US$ Million) by Country, 2023 to 2033

Figure 126: Eastern Europe Market Value (US$ Million) Analysis by Country, 2018 to 2033

Figure 127: Eastern Europe Market Volume (Units) Analysis by Country, 2018 to 2033

Figure 128: Eastern Europe Market Value Share (%) and BPS Analysis by Country, 2023 to 2033

Figure 129: Eastern Europe Market Y-o-Y Growth (%) Projections by Country, 2023 to 2033

Figure 130: Eastern Europe Market Value (US$ Million) Analysis by Functions, 2018 to 2033

Figure 131: Eastern Europe Market Volume (Units) Analysis by Functions, 2018 to 2033

Figure 132: Eastern Europe Market Value Share (%) and BPS Analysis by Functions, 2023 to 2033

Figure 133: Eastern Europe Market Y-o-Y Growth (%) Projections by Functions, 2023 to 2033

Figure 134: Eastern Europe Market Value (US$ Million) Analysis by Beam, 2018 to 2033

Figure 135: Eastern Europe Market Volume (Units) Analysis by Beam, 2018 to 2033

Figure 136: Eastern Europe Market Value Share (%) and BPS Analysis by Beam, 2023 to 2033

Figure 137: Eastern Europe Market Y-o-Y Growth (%) Projections by Beam, 2023 to 2033

Figure 138: Eastern Europe Market Value (US$ Million) Analysis by Light Type, 2018 to 2033

Figure 139: Eastern Europe Market Volume (Units) Analysis by Light Type, 2018 to 2033

Figure 140: Eastern Europe Market Value Share (%) and BPS Analysis by Light Type, 2023 to 2033

Figure 141: Eastern Europe Market Y-o-Y Growth (%) Projections by Light Type, 2023 to 2033

Figure 142: Eastern Europe Market Value (US$ Million) Analysis by End Use, 2018 to 2033

Figure 143: Eastern Europe Market Volume (Units) Analysis by End Use, 2018 to 2033

Figure 144: Eastern Europe Market Value Share (%) and BPS Analysis by End Use, 2023 to 2033

Figure 145: Eastern Europe Market Y-o-Y Growth (%) Projections by End Use, 2023 to 2033

Figure 146: Eastern Europe Market Attractiveness by Functions, 2023 to 2033

Figure 147: Eastern Europe Market Attractiveness by Beam, 2023 to 2033

Figure 148: Eastern Europe Market Attractiveness by Light Type, 2023 to 2033

Figure 149: Eastern Europe Market Attractiveness by End Use, 2023 to 2033

Figure 150: Eastern Europe Market Attractiveness by Country, 2023 to 2033

Figure 151: South Asia and Pacific Market Value (US$ Million) by Functions, 2023 to 2033

Figure 152: South Asia and Pacific Market Value (US$ Million) by Beam, 2023 to 2033

Figure 153: South Asia and Pacific Market Value (US$ Million) by Light Type, 2023 to 2033

Figure 154: South Asia and Pacific Market Value (US$ Million) by End Use, 2023 to 2033

Figure 155: South Asia and Pacific Market Value (US$ Million) by Country, 2023 to 2033

Figure 156: South Asia and Pacific Market Value (US$ Million) Analysis by Country, 2018 to 2033

Figure 157: South Asia and Pacific Market Volume (Units) Analysis by Country, 2018 to 2033

Figure 158: South Asia and Pacific Market Value Share (%) and BPS Analysis by Country, 2023 to 2033

Figure 159: South Asia and Pacific Market Y-o-Y Growth (%) Projections by Country, 2023 to 2033

Figure 160: South Asia and Pacific Market Value (US$ Million) Analysis by Functions, 2018 to 2033

Figure 161: South Asia and Pacific Market Volume (Units) Analysis by Functions, 2018 to 2033

Figure 162: South Asia and Pacific Market Value Share (%) and BPS Analysis by Functions, 2023 to 2033

Figure 163: South Asia and Pacific Market Y-o-Y Growth (%) Projections by Functions, 2023 to 2033

Figure 164: South Asia and Pacific Market Value (US$ Million) Analysis by Beam, 2018 to 2033

Figure 165: South Asia and Pacific Market Volume (Units) Analysis by Beam, 2018 to 2033

Figure 166: South Asia and Pacific Market Value Share (%) and BPS Analysis by Beam, 2023 to 2033

Figure 167: South Asia and Pacific Market Y-o-Y Growth (%) Projections by Beam, 2023 to 2033

Figure 168: South Asia and Pacific Market Value (US$ Million) Analysis by Light Type, 2018 to 2033

Figure 169: South Asia and Pacific Market Volume (Units) Analysis by Light Type, 2018 to 2033

Figure 170: South Asia and Pacific Market Value Share (%) and BPS Analysis by Light Type, 2023 to 2033

Figure 171: South Asia and Pacific Market Y-o-Y Growth (%) Projections by Light Type, 2023 to 2033

Figure 172: South Asia and Pacific Market Value (US$ Million) Analysis by End Use, 2018 to 2033

Figure 173: South Asia and Pacific Market Volume (Units) Analysis by End Use, 2018 to 2033

Figure 174: South Asia and Pacific Market Value Share (%) and BPS Analysis by End Use, 2023 to 2033

Figure 175: South Asia and Pacific Market Y-o-Y Growth (%) Projections by End Use, 2023 to 2033

Figure 176: South Asia and Pacific Market Attractiveness by Functions, 2023 to 2033

Figure 177: South Asia and Pacific Market Attractiveness by Beam, 2023 to 2033

Figure 178: South Asia and Pacific Market Attractiveness by Light Type, 2023 to 2033

Figure 179: South Asia and Pacific Market Attractiveness by End Use, 2023 to 2033

Figure 180: South Asia and Pacific Market Attractiveness by Country, 2023 to 2033

Figure 181: East Asia Market Value (US$ Million) by Functions, 2023 to 2033

Figure 182: East Asia Market Value (US$ Million) by Beam, 2023 to 2033

Figure 183: East Asia Market Value (US$ Million) by Light Type, 2023 to 2033

Figure 184: East Asia Market Value (US$ Million) by End Use, 2023 to 2033

Figure 185: East Asia Market Value (US$ Million) by Country, 2023 to 2033

Figure 186: East Asia Market Value (US$ Million) Analysis by Country, 2018 to 2033

Figure 187: East Asia Market Volume (Units) Analysis by Country, 2018 to 2033

Figure 188: East Asia Market Value Share (%) and BPS Analysis by Country, 2023 to 2033

Figure 189: East Asia Market Y-o-Y Growth (%) Projections by Country, 2023 to 2033

Figure 190: East Asia Market Value (US$ Million) Analysis by Functions, 2018 to 2033

Figure 191: East Asia Market Volume (Units) Analysis by Functions, 2018 to 2033

Figure 192: East Asia Market Value Share (%) and BPS Analysis by Functions, 2023 to 2033

Figure 193: East Asia Market Y-o-Y Growth (%) Projections by Functions, 2023 to 2033

Figure 194: East Asia Market Value (US$ Million) Analysis by Beam, 2018 to 2033

Figure 195: East Asia Market Volume (Units) Analysis by Beam, 2018 to 2033

Figure 196: East Asia Market Value Share (%) and BPS Analysis by Beam, 2023 to 2033

Figure 197: East Asia Market Y-o-Y Growth (%) Projections by Beam, 2023 to 2033

Figure 198: East Asia Market Value (US$ Million) Analysis by Light Type, 2018 to 2033

Figure 199: East Asia Market Volume (Units) Analysis by Light Type, 2018 to 2033

Figure 200: East Asia Market Value Share (%) and BPS Analysis by Light Type, 2023 to 2033

Figure 201: East Asia Market Y-o-Y Growth (%) Projections by Light Type, 2023 to 2033

Figure 202: East Asia Market Value (US$ Million) Analysis by End Use, 2018 to 2033

Figure 203: East Asia Market Volume (Units) Analysis by End Use, 2018 to 2033

Figure 204: East Asia Market Value Share (%) and BPS Analysis by End Use, 2023 to 2033

Figure 205: East Asia Market Y-o-Y Growth (%) Projections by End Use, 2023 to 2033

Figure 206: East Asia Market Attractiveness by Functions, 2023 to 2033

Figure 207: East Asia Market Attractiveness by Beam, 2023 to 2033

Figure 208: East Asia Market Attractiveness by Light Type, 2023 to 2033

Figure 209: East Asia Market Attractiveness by End Use, 2023 to 2033

Figure 210: East Asia Market Attractiveness by Country, 2023 to 2033

Figure 211: Middle East and Africa Market Value (US$ Million) by Functions, 2023 to 2033

Figure 212: Middle East and Africa Market Value (US$ Million) by Beam, 2023 to 2033

Figure 213: Middle East and Africa Market Value (US$ Million) by Light Type, 2023 to 2033

Figure 214: Middle East and Africa Market Value (US$ Million) by End Use, 2023 to 2033

Figure 215: Middle East and Africa Market Value (US$ Million) by Country, 2023 to 2033

Figure 216: Middle East and Africa Market Value (US$ Million) Analysis by Country, 2018 to 2033

Figure 217: Middle East and Africa Market Volume (Units) Analysis by Country, 2018 to 2033

Figure 218: Middle East and Africa Market Value Share (%) and BPS Analysis by Country, 2023 to 2033

Figure 219: Middle East and Africa Market Y-o-Y Growth (%) Projections by Country, 2023 to 2033

Figure 220: Middle East and Africa Market Value (US$ Million) Analysis by Functions, 2018 to 2033

Figure 221: Middle East and Africa Market Volume (Units) Analysis by Functions, 2018 to 2033

Figure 222: Middle East and Africa Market Value Share (%) and BPS Analysis by Functions, 2023 to 2033

Figure 223: Middle East and Africa Market Y-o-Y Growth (%) Projections by Functions, 2023 to 2033

Figure 224: Middle East and Africa Market Value (US$ Million) Analysis by Beam, 2018 to 2033

Figure 225: Middle East and Africa Market Volume (Units) Analysis by Beam, 2018 to 2033

Figure 226: Middle East and Africa Market Value Share (%) and BPS Analysis by Beam, 2023 to 2033

Figure 227: Middle East and Africa Market Y-o-Y Growth (%) Projections by Beam, 2023 to 2033

Figure 228: Middle East and Africa Market Value (US$ Million) Analysis by Light Type, 2018 to 2033

Figure 229: Middle East and Africa Market Volume (Units) Analysis by Light Type, 2018 to 2033

Figure 230: Middle East and Africa Market Value Share (%) and BPS Analysis by Light Type, 2023 to 2033

Figure 231: Middle East and Africa Market Y-o-Y Growth (%) Projections by Light Type, 2023 to 2033

Figure 232: Middle East and Africa Market Value (US$ Million) Analysis by End Use, 2018 to 2033

Figure 233: Middle East and Africa Market Volume (Units) Analysis by End Use, 2018 to 2033

Figure 234: Middle East and Africa Market Value Share (%) and BPS Analysis by End Use, 2023 to 2033

Figure 235: Middle East and Africa Market Y-o-Y Growth (%) Projections by End Use, 2023 to 2033

Figure 236: Middle East and Africa Market Attractiveness by Functions, 2023 to 2033

Figure 237: Middle East and Africa Market Attractiveness by Beam, 2023 to 2033

Figure 238: Middle East and Africa Market Attractiveness by Light Type, 2023 to 2033

Figure 239: Middle East and Africa Market Attractiveness by End Use, 2023 to 2033

Figure 240: Middle East and Africa Market Attractiveness by Country, 2023 to 2033

Recommendations

Technology

LED Modules and Light Engines Market

Published : August 2023

Explore Technology Insights

View Reports