The LED driver IC market is projected to be valued at USD 6.7 billion in 2025 and is anticipated to reach USD 29.2 billion by 2035, registering a compound annual growth rate (CAGR) of 15.9% over the forecast period.
LED driver ICs, essential components in regulating the current and voltage supplied to LEDs, are increasingly in demand due to the growing adoption of energy-efficient lighting solutions across residential, commercial, and industrial sectors. The market's growth is driven by the global transition toward LED lighting, driven by the need for energy savings and longer-lasting, environmentally friendly alternatives to traditional lighting technologies.
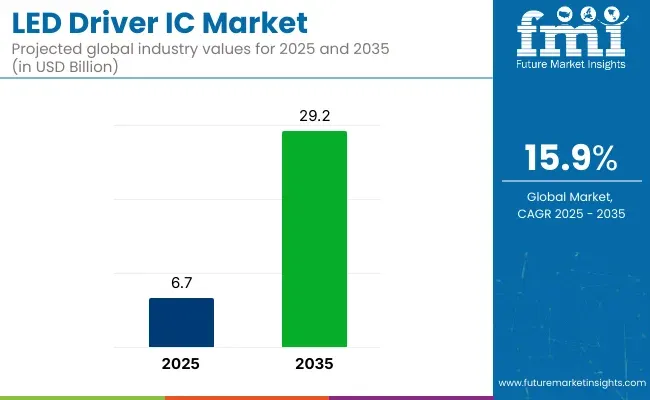
| Attribute | Value |
|---|---|
| Market Size in 2025 | USD 6.7 billion |
| Market Size in 2035 | USD 29.2 billion |
| CAGR (2025 to 2035) | 15.9% |
A major driver for this market’s growth is the rising focus on energy efficiency and sustainable practices. Governments worldwide are setting stringent regulations for reducing energy consumption and promoting the use of low-energy lighting solutions.
LED drivers, being integral to LED lighting systems, are seeing increased adoption as businesses and consumers replace incandescent and fluorescent lights with more efficient LED alternatives. Additionally, the increasing use of LEDs in automotive lighting, displays, and backlighting for electronic devices is further expanding the demand for high-performance LED driver ICs.
Recent developments in the LED driver IC market include innovations in smart driver ICs that offer enhanced functionality such as dimming, remote control, and color tuning capabilities. These advanced features are becoming increasingly important in modern lighting applications, particularly in smart homes and smart cities.
On April 15, 2025, Analog Devices unveiled the LT3755EMSE-2, a versatile LED driver IC supporting buck, boost, and SEPIC topologies. This device offers high-side current sensing, enabling efficient LED dimming with up to 3000:1 PWM control. It's designed for applications requiring flexible voltage regulation and compact form factors. This was officially announced in the company's press release
As the LED driver IC market continues to expand, ongoing technological advancements and growing adoption of energy-efficient lighting solutions will drive sustained growth over the coming years.
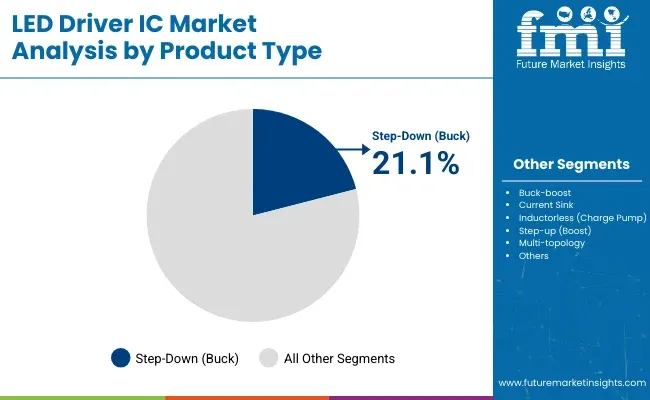
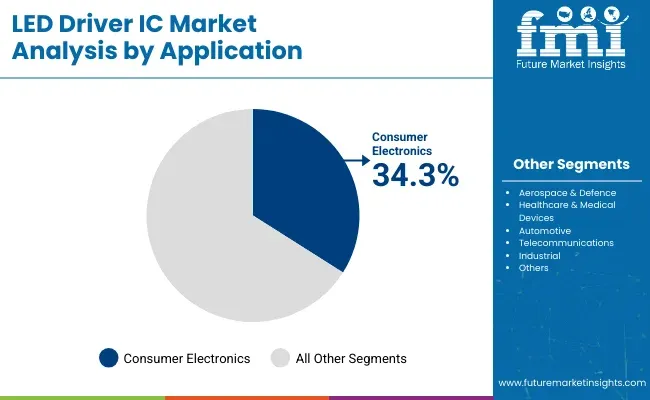
The global LED driver IC market is projected to grow steadily through 2035, fueled by rising demand for energy-efficient lighting and advanced electronic devices. In 2025, step-down (buck) driver ICs are expected to hold 21.1% of the product type market share, while the consumer electronics segment is projected to capture 34.3% of the application segment. Key players include Texas Instruments, ON Semiconductor, and Infineon Technologies.
The step-down (buck) driver ICs segment is projected to capture 21.1% of the product type market share in 2025. These ICs are preferred for their high efficiency in converting voltage to power LEDs, minimizing energy loss and heat generation. They are widely used in various LED lighting applications, including residential, automotive, and display backlighting.
Manufacturers like Texas Instruments and ON Semiconductor are developing buck driver ICs with integrated protection features and compact designs to support miniaturization trends. The increasing focus on sustainable energy consumption and LED adoption in smart lighting systems is further accelerating growth in this segment.
The consumer electronics segment is expected to hold 34.3% of the application market share in 2025. This segment encompasses devices such as smartphones, tablets, televisions, and wearable gadgets that integrate LED displays and indicators requiring efficient driver ICs.
Companies like Infineon Technologies and Texas Instruments are supplying driver ICs optimized for low power consumption, thermal management, and flicker-free operation, crucial for enhancing user experience. The rapid pace of innovation in consumer electronics, including foldable displays and IoT devices, is driving demand for advanced LED driver solutions. As consumers increasingly seek energy-efficient and high-performance electronics, this segment will remain a key growth area.
The global market is growing with the increasing use of energy-efficient lighting solutions across various industries. Consumer electronics focus on small, power-efficient driver ICs to boost display performance in smartphones, TVs, and laptops.
Automotive usage emphasizes high-power ICs to power advanced headlamps, taillamps, and interior lighting systems with increased robustness. Industrial lighting requires rugged and heat-tolerant drivers to maintain efficiency in factories and warehouses.
Commercial buildings require economical and dimmable LED drivers to reduce energy usage. Street lighting solutions are enhanced by high-reliability LED drivers that ensure long operation life and reduced maintenance costs.
The push for smart lighting, IoT-interconnected controls, and high-power LED applications is generating innovation. Complimentary support for energy efficiency standards (IEC, Energy Star, RoHS) and high-voltage, constant current, PWM-controlled driver requirements are driving purchase decisions.
| Company/Entity | Contract Value (USD Million) |
|---|---|
| Texas Instruments | Approximately USD 80 |
| ON Semiconductor | Approximately USD 65 |
| Infineon Technologies | Approximately USD 90 |
| NXP Semiconductors | Approximately USD 70 |
In 2024 and early 2025, there has been substantial growth driven by strategic partnerships and technological advancements. Texas Instruments' collaboration with an automotive manufacturer to supply advanced ICs for electric vehicles underscores the critical role of energy-efficient components in the evolving automotive industry.
Similarly, ON Semiconductor's contract with a global smartphone manufacturer highlights the demand for improved display technologies and extended battery life in consumer electronics. Infineon Technologies partnership to develop customized ICs for industrial lighting applications reflects the industry's shift towards smart factory solutions that enhance operational efficiency.
Additionally, NXP Semiconductors' integration of these ICs into smart home lighting systems showcases the growing consumer interest in connected and controllable home environments. These developments indicate a robust and evolving LED Driver IC market, poised to support advancements across various sectors.
The industry faces several risks. They are technological, economic, and regulatory challenges. Environmental compliance and control of hazardous substances in the production of Integrated Circuits (ICs) are also some of the challenges.
There are issues in the supply chain. This industry is strongly dependent on semiconductor parts, which are historically vulnerable to shortages, geopolitical issues, and raw material price variations. Production delays and extra costs result from wafer fabrication or chip manufacturing disruptions. CNC cuts also depend on all these machining errors, as well as many other accompanying problems.
Governments worldwide set stringent energy efficiency and safety standards for LED lighting. The manufacturers need to prove that their ICs are compliant with changing standards such as RoHS (Restriction of Hazardous Substances), and Energy Star certifications. Otherwise, they face penalties and get banned.
Competition is also a problem, as a number of companies are constantly in the race regarding cost, effectiveness, and integration features. Low-class manufacturers especially from Asia are aggressive about pricing which creates a very big issue. This makes other leading brands not to enjoy the profits they should get.
The last concern to be discussed is about the life span of the product. Over the years LED technology has made a tremendous transformation which has greatly affected the customers who now want longer lifetimes and better efficiency. The concern is that companies must find the balance between cost-effective production and long-run durability and reliability, or else they will reroute their share to the more superior choices.
Tier 1 Texas Instruments, STMicroelectronics, and ON Semiconductor are the Tier 1 companies. These industry leaders have established a significant global presence, offering comprehensive portfolios of LED driver ICs catering to various applications, including automotive, industrial, and consumer electronics. Their extensive research and development capabilities enable them to innovate and adapt to emerging trends, such as smart lighting and energy-efficient solutions.
Additionally, their robust distribution networks and strategic partnerships with major OEMs ensure widespread adoption of their products across diverse industries. Their financial strength and brand recognition further solidify their positions as top-tier companies in the industry.
Tier 2 Analog Devices, NXP Semiconductors, and Infineon Technologies fall into the Tier 2 category. These companies maintain strong positions and offer a wide range of ICs, focusing on specific applications and regional markets. They invest considerably in R&D to enhance their product offerings and address niche industry needs, such as automotive lighting and industrial automation.
While they may not have the same industry share as Tier 1 companies, their specialized expertise and targeted strategies allow them to compete effectively. Their collaborations with regional distributors and system integrators enable them to penetrate emerging markets and expand their customer base.
Tier 3 Maxim Integrated, ROHM Semiconductor, Toshiba, and Microchip Technology are classified as Tier 3 companies. These firms typically focus on specific segments or regions, offering specialized IC solutions tailored to particular applications, such as consumer electronics or specialized industrial equipment. Their presence is more localized, and they may have limited global reach compared to higher-tier companies.
However, their agility and ability to cater to specific customer requirements provide them with competitive advantages in their chosen niches. By concentrating on specialized industries and leveraging their technical expertise, these companies maintain relevance and profitability within the LED Driver IC industry.
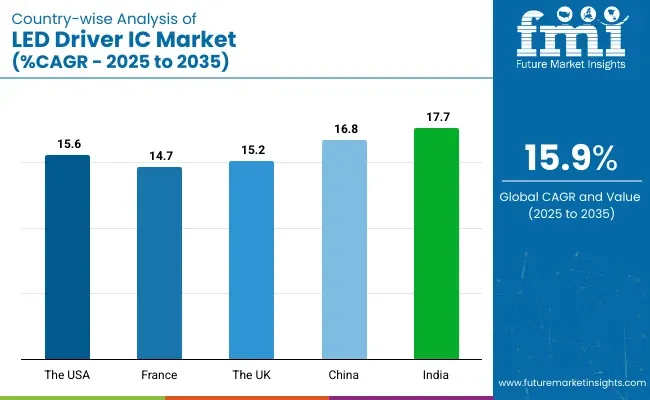
| Countries | CAGR (2025 to 2035) |
|---|---|
| The USA | 15.6% |
| France | 14.7% |
| The UK | 15.2% |
| China | 16.8% |
| India | 17.7% |
The USA is a leading country with widespread adoption of smart lighting solutions in residential, commercial, and industrial markets. Government policies towards energy efficiency, such as ENERGY STAR and Department of Energy (DOE) regulations, are driving the use of LEDs. Leadership by major semiconductor firms such as Texas Instruments, ON Semiconductor, and Analog Devices forms the market.
The increasing use of networked lighting in smart buildings, IoT-connected infrastructure, and automotive systems further boosts the demand for advanced ICs. Stringent green regulations and emphasis on renewable energy solutions ensure continuous investments in LED technology.
FMI is of the opinion that the USA market is slated to grow at 15.6% CAGR during the study period.
Growth Factors in the USA
| Key Drivers | Details |
|---|---|
| Government Policies | ENERGY STAR and DOE policies favor energy efficiency and the adoption of LEDs. |
| Smart Lighting Growth | Increased usage in smart buildings, industrial automation, and IoT-based infrastructure. |
| Semiconductor Industry | The leadership of leading semiconductor players ensures supply chain stability and innovation. |
| Environmental Regulations | Good sustainability practices encourage the adoption of LEDs. |
China boasts the largest market share because of its vast number of semiconductor players and government policies that support energy-efficient lighting. China is the biggest manufacturer of LED components, with an in-built supply chain, low-cost production, and enormous R&D investments.
Government initiatives like the National Green Lighting Program drive incandescent-LED substitution. Additional applications of LED technology in smart cities, industrial automation, and electric vehicles drive growth. With increasing advancements toward semiconductor independence and local consumption, China continues to be a giant in the industry.
FMI is of the opinion that China is slated to grow at 16.8% CAGR during the study period.
Growth Factors in China
| Key Drivers | Details |
|---|---|
| Industry Leadership | China is the world's largest producer of LED components, facilitated by low production costs. |
| Government Policies | National Green Lighting Program encourages energy-efficient lighting. |
| Smart City Development | Large-scale use of LED lights in smart city developments. |
| Electric Vehicle Expansion | Increasing demand for LED usage in the auto sector. |
India is expanding by leaps and bounds due to urban growth, infrastructure growth, and government energy efficiency initiatives. Initiatives like UJALA (Unnat Jyoti by Affordable LEDs for All) and Make in India have encouraged the application of LEDs for domestic, commercial, and industrial purposes.
The demand for energy-efficient and economical lighting products, particularly in rural areas, is driving the demand for economical ICs. Smart city development and increasing penetration of IoT-enabled lighting solutions are key drivers for growth. With a growing middle class and rising electricity costs, India presents a good prospect for manufacturers.
FMI is of the opinion that India is slated to grow at 17.7% CAGR during the study period.
Growth Factors in India
| Key Drivers | Details |
|---|---|
| Government Initiatives | UJALA and Make in India encourage the use of LEDs in domestic manufacturing. |
| Urbanization Development | Increased application in LED lighting for smart cities and infrastructure. |
| Low-Cost Solutions | Low-cost driver ICs for low-cost markets. |
| IoT Penetration | Growing application in internet-based light solutions. |
France is witnessing steady growth because of strict energy efficiency regulations and green policies. France's initiatives to reduce carbon emissions have seen an increase in LEDs being used in commercial and public property markets.
France's established automotive industry also uses LED technology in energy-efficient products. Government subsidies and incentives for electricity installation using LEDs for residential and industrial applications also fuel growth. Smart city initiatives and IoT-based LED lighting solutions increase the demand for ICs.
FMI is of the opinion that France is slated to grow at 14.7% CAGR during the study period.
Growth Factors in France
| Key Drivers | Details |
|---|---|
| Energy Efficiency Policies | Government policies drive the adoption of LEDs in the public and private sectors. |
| Automotive Integration | LED technology is used extensively in energy-efficient automotive applications. |
| Smart City Projects | Growth in IoT-based LED lighting adoption. |
| Sustainability Goals | France is seeking to reduce carbon emissions via LED solutions. |
The UK is witnessing growth due to the demand for smart lighting and green energy schemes. Energy-efficient building government policies have compelled governments to adopt LEDs in residential and commercial structures.
IoT-based lighting and developing smart city infrastructure fuel the demand for advanced ICs. In an effort to reduce energy consumption and carbon footprint, the UK continues to invest in green light technology.
FMI is of the opinion that the UK is slated to grow at 15.2% CAGR during the study period.
Growth Factors in the UK
| Key Drivers | Details |
|---|---|
| Energy Efficiency Regulations | Regulations encouraging the adoption of LED lighting for new development. |
| Smart City Infrastructure | Extensive utilization of smart lighting and IoT-based solutions. |
| Renewable Energy Integration | Increased utilization of LED technology within solar and wind energy schemes. |
| Government Incentives | Economic incentives to use LED lighting for residential and commercial purposes. |
The LED Driver IC market section expands with time owing to the need for more energy-efficient lighting, intelligent lighting solutions, and automotive LED applications. Industries such as consumer electronics, industrial automation, and IoT-enabled lighting are the forebearers of market momentum with superior miniaturized high-efficiency driver ICs.
Currently, Texas Instruments, STMicroelectronics, ON Semiconductor, Analog Devices, and Infineon Technologies offer integrated, high-performance, power-efficient LED driver solutions. Yet there are several mid-tier companies like Maxim Integrated, ROHM Semiconductor, Toshiba, and Microchip Technology that concentrate on special applications, including automobile, industrial, and high-brightness LED lighting.
Market development is enhanced with the advancement of dimmable, programmable, wireless-controlled LED drivers, which are incorporated into smart lighting and the IoT ecosystem. Asia-Pacific, with China, Japan, and South Korea, is one of the world's top manufacturing regions, as companies across the globe invest in regional expansions and strategic alliances. The strategic elements for the competition include energy efficiency and cost-effectiveness, as well as adherence to national and international regulatory efficiencies in lighting.
Recent Developments
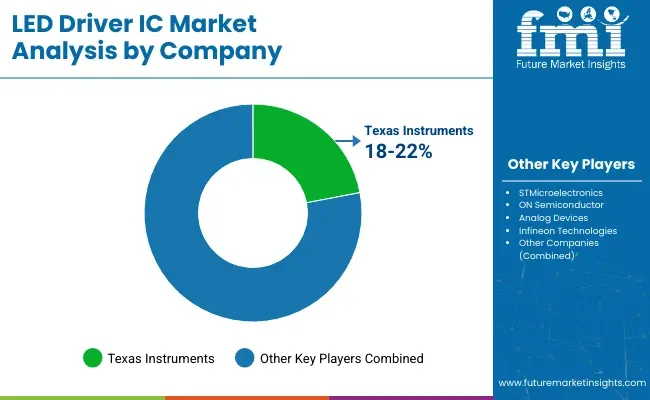
Texas Instruments (18-22%)
Its performance LED driver ICs offer intelligent power management for commercial, automotive, and industrial applications.
STMicroelectronics (14-18%)
One of the leading innovation companies when it comes to automotive LED lighting applications, especially adaptive driving beam technology, energy-efficient industrial applications were taken into consideration.
ON Semiconductor (12-16%)
Strong presence in lighting applications for consumers and general lighting, especially providing power-efficient and thermally optimized LED drivers.
Analog Devices (10-14%)
Its high-precision LED drivers lead in very specialized applications like medical and high-performance industrial lighting.
Infineon Technologies (8-12%)
the pioneer in IoT-enabled LED driver ICs that integrate wireless control, energy management, and smart home lighting solutions.
Other Key Players (25-35% Combined)
| Report Attributes | Details |
|---|---|
| Current Total Market Size (2025) | USD 6.7 billion |
| Projected Market Size (2035) | USD 29.2 billion |
| CAGR (2025 to 2035) | 15.9% |
| Base Year for Estimation | 2024 |
| Historical Period | 2020 to 2024 |
| Projections Period | 2025 to 2035 |
| Quantitative Units | USD billion for dollar sales |
| Product Types Analyzed (Segment 1) | Buck-boost, Current Sink, Inductorless (Charge Pump), Step-down (Buck), Step-up (Boost), Multi-topology, Others |
| Applications Analyzed (Segment 2) | Consumer Electronics, Aerospace & Defence, Healthcare & Medical Devices, Automotive, Telecommunications, Industrial, Others |
| Regions Covered | North America, Latin America, Western Europe, Eastern Europe, East Asia, South Asia & Pacific, Middle East and Africa (MEA) |
| Countries Covered | United States, Canada, Mexico, Brazil, Argentina, Germany, France, United Kingdom, Italy, Spain, Netherlands, China, India, Japan, South Korea, ANZ, GCC Countries, South Africa |
| Key Players influencing the LED Driver IC Market | Texas Instruments, STMicroelectronics, ON Semiconductor, Analog Devices, NXP Semiconductors, Infineon Technologies, Maxim Integrated, ROHM Semiconductor, Toshiba, Microchip Technology |
| Additional Attributes | dollar sales, CAGR trends, product type segmentation, application distribution, competitor dollar sales & market share, regional growth patterns |
In terms of Product Type, the segment is categorized into Buck-boost, Current Sink, Inductorless (Charge Pump), Step-down (Buck), Step-up (Boost), Multi-topology, and Others.
In terms of Application, the segment is classified into Consumer Electronics, Aerospace & Defence, Healthcare & Medical Devices, Automotive, Telecommunications, Industrial, and Others.
Key countries of North America, Latin America, Western Europe, Eastern Europe, East Asia, South Asia & Pacific, Middle East and Africa (MEA) have been covered in the report.
The global LED Driver IC industry is projected to witness CAGR of 15.9% between 2025 and 2035.
The global LED Driver IC industry is at USD 6.7 billion in 2025.
The global LED Driver IC industry is anticipated to reach USD 29.2 billion by 2035 end.
South Asia & Pacific is set to record the highest CAGR of 16.5% in the assessment period.
The key players operating in the global LED Driver IC industry include Texas Instruments, STMicroelectronics, ON Semiconductor, Analog Devices, NXP Semiconductors and others.


Full Research Suite comprises of:
Market outlook & trends analysis
Interviews & case studies
Strategic recommendations
Vendor profiles & capabilities analysis
5-year forecasts
8 regions and 60+ country-level data splits
Market segment data splits
12 months of continuous data updates
DELIVERED AS:
PDF EXCEL ONLINE
LED Backlight Display Driver ICs Market – Growth & Forecast 2025 to 2035
LED Light Market Size and Share Forecast Outlook 2025 to 2035
LED Loading Dock Light Market Size and Share Forecast Outlook 2025 to 2035
LED Modules and Light Engines Market Size and Share Forecast Outlook 2025 to 2035
LED Control Unit Market Size and Share Forecast Outlook 2025 to 2035
LED Lamp Market Size and Share Forecast Outlook 2025 to 2035
LED Light Tower Market Size and Share Forecast Outlook 2025 to 2035
LED Displays, Lighting and Fixtures Market Size and Share Forecast Outlook 2025 to 2035
LED Tube Market Size and Share Forecast Outlook 2025 to 2035
LEDPackaging Market Size and Share Forecast Outlook 2025 to 2035
LED Neon Lights Market Size and Share Forecast Outlook 2025 to 2035
LED Grow Lights Market Analysis by Product, Installation Type, Application and Region Through 2035
LED Light Bar Market Analysis - Trends, Growth & Forecast 2025 to 2035
LED and OLED lighting Products and Display Market – Growth & Forecast 2034
LED Phosphor Material Market
LED Modular Display Market
LED Tester Market
LED Cable Market
LED Lighting Controllers Market
LED Driver for Lighting Market Analysis – Growth & Forecast 2025 to 2035

Thank you!
You will receive an email from our Business Development Manager. Please be sure to check your SPAM/JUNK folder too.
Chat With
MaRIA