Reports

- Global Locations -

Headquarters

Future Market Insights, Inc.

Christiana Corporate, 200
Continental Drive, Suite 401,
Newark, Delaware - 19713,
United States

T: +1-845-579-5705

Americas

Future Market Insights, Inc.

616 Corporate Way, Suite 2-9018,
Valley Cottage, NY 10989, United States

T: +1-347-918-3531

MEA

Future Market Insights

1602-6 Jumeirah Bay X2 Tower, Plot No: JLT-PH2-X2A,
Jumeirah Lakes Towers, Dubai,
United Arab Emirates

Europe

Future Market Insights

3rd Floor, 207 Regent Street,
W1B 3HH London
United Kingdom

T: + 44 (0) 20 8123 9659
D: +44 (0) 20 3287 4268

Asia Pacific

Future Market Insights

IndiaLand Global Tech Park, Unit UG-1, Behind Grand HighStreet, Phase 1, Hinjawadi, MH, Pune – 411057, India

Industrial Automation Market Outlook

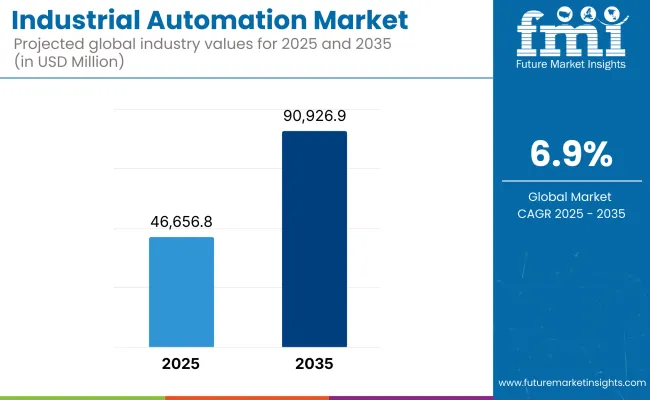
The industrial automation market is anticipated to capture a valuation of US$ 40.6 billion in 2023 and is rising to US$ 81.4 billion by 2033. The market is estimated at a CAGR of 7.2% during the forecast period. The following factors influencing the market growth are:

Industrial Automation Market - Driving Factors

  • The growing demand for manufacturing costs, enhanced quality, and high productivity increase the demand for industrial automation.
  • The adoption of industrial automation is rising to enhance process control and limit lead times surging the market growth.
  • Growing AR and digital technologies are increasing the demand for industrial automation for manufacturing products.
  • The rising investment companies, the Internet of Things, presence of manufacturers with innovation skills are driving the market opportunities.
  • Manufacturers developing real-time data plants for better visibility, efficiency and maintenance are increasing the demand for industrial automation.
  • End-use industries such as food & beverages, oil & gas, defense, aerospace, and automotive are expanding the market size during the forecast period.
  • The adoption of industrial automation technologies, including monitoring production processes and HMI, is boosting operational efficiency are advancing market growth.

Don't pay for what you don't need

Customize your report by selecting specific countries or regions and save 30%!

A Few of the Challenges Faced in the Industrial Automation Market

The latest manufacturing plants acquire cutting-edge automation technologies for their installation. Huge software, technologies, equipment, and training investments are difficult for new marketers. Therefore, these factors may limit the market expansion during the forecast period.

The high equipment cost and advanced systems lack market growth. Several companies and organizations can't put back their existing system is another factor that declines the market growth. Growing modernization and inappropriateness to handle advanced technologies may limit the market size.

Growing Demand for Safety Automation Solutions Drive the Market Opportunities

Manufacturers are developing advanced safety measures for industrial automation to prevent workplace accidents, uplifting market opportunities. The increasing demand for safety automation products lowers the risk of any uncertainty propelling the market size.

Electrotechnical Commission and the ISO (International Standard Organization) are the leading international authorities that assure machinery's safety, standard quality, and technical services. These technology standards and protocols integrated with the automation system increase market opportunities. The vendors advancing industrial devices and equipment to expand production efficiency are bolstering the market size.

Attributes Details
Market CAGR (2023 to 2033) 7.2%
Market Valuation (2023) US$ 40.6 billion
Market Valuation (2033) US$ 81.4 billion
Nikhil Kaitwade
Nikhil Kaitwade

Principal Consultant

Talk to Analyst

Find your sweet spots for generating winning opportunities in this market.

Industrial Automation Market, 2017 to 2022 Historical Sales, Compared to 2023 to 2033 Future Outlook

According to Future Market Insights, the global industrial automation market is predicted at a healthy 7.2% CAGR during the forecast period. Historically, the market registered a CAGR of 12.0% between 2017 and 2022.

The growing adoption of industrial automation in various end-use sectors such as pharmaceuticals, chemicals, oil & gas, and others is expanding the market growth. The key companies are managing to innovate the machinery by adding several technical features such as robotics, sensors, and other driving market opportunities.

This advanced inbuilt system reduced labor force, and errors and operated work faster, consequently growing better opportunities in the market during the forecast period. Rising awareness and technological improvements are fueling the demand for industrial automation. The growing smart, secure, safe, and consistent operative manufacturing increases the adoption of industrial automation.

  • Short Term (2023 to 2026): Rising demand for high productivity, reduced cost, and fast operation are driving market growth.
  • Medium Term (2026 to 2029): The increasing adoption of industrial automation due to growing advanced AR (Augmented Reality) technology.
  • Long Term (2029 to 2033): Rising investment, key companies, government initiatives, and innovations are expanding the market opportunities.

Comparative Analysis of Adjacent Markets

Industrial Automation Market:

Attributes Industrial Automation Market
CAGR (2023 to 2033) 7.2%
Value (2023) US$ 40.6 billion
Value (2033) US$ 81.4 billion
Trends The increasing adoption of industrial automation is due to growing advanced AR technology.
Opportunities The increasing demand for safety automation products lowers the risk of any uncertainty propelling the market size.

Industrial PC Market:

Attributes Industrial PC Market
CAGR (2023 to 2033) 7%
Value (2023) US$ 5.06 billion
Value (2033) US$ 9.95 billion
Trends Rising demand for advanced automation and focus on 5G and the Internet of Things.
Opportunities Governments initiatives, skilled players, and the availability of innovative technologies

Industrial 3D Printing Market:

Attributes Industrial 3D Printing Market
CAGR (2023 to 2033) 20%
Value (2023) US$ 2.85 billion
Value (2033) US$ 17.64 billion
Trends Increasing investment and decline in the cost of 3D printers.
Opportunities Availability of the latest technology and graphic design.

Get the data you need at a Fraction of the cost

Personalize your report by choosing insights you need
and save 40%!

Top Two Segments in the Market

Segment Deployment
Top Category Industrial Sensors
Historic CAGR 11.8%
Forecast CAGR 7.0%
Segment Component
Top Category Plant Asset Management
Historic CAGR 11.4%
Forecast CAGR 6.8%

Which Deployment Segment Leading the Global Market?

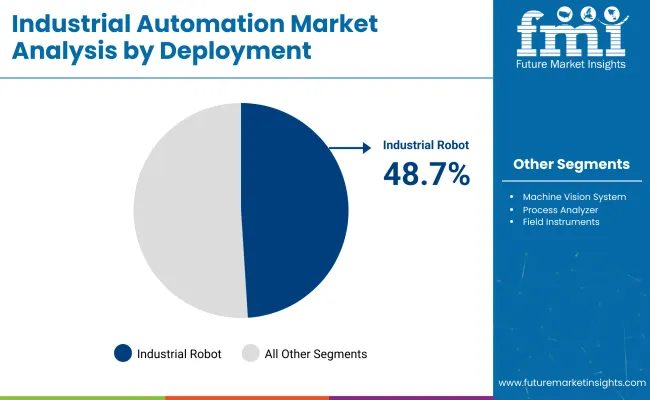
Based on deployment, industrial sensors are leading the global market by securing a CAGR of 7.0% during the forecast period. The rising adoption of the Internet of Things, 4.0 technology, and wireless technology are the factors increasing the demand for industrial sensors. The manufacturing industries are further boosting the demand for industrial sensors to deploy with machines to provide certain alert and sound systems. These sensors collect information on a real-time basis and are estimated to surge the market growth. The industrial sensors captured a CAGR of 11.8% in the historic period between 2017 and 2022.

Plant Assets Management Dominates the Component Segment

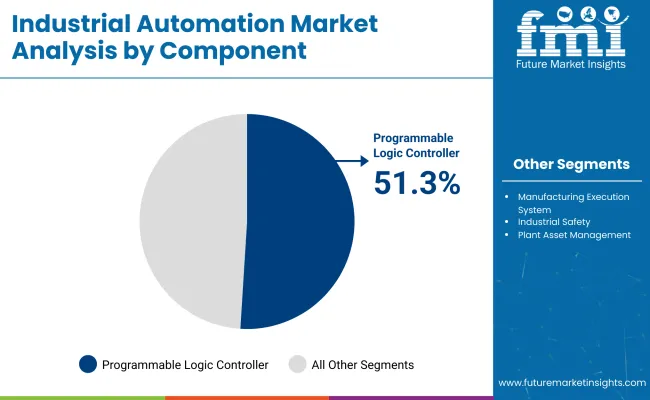
Plant assets management dominates the global market by occupying a CAGR of 6.8% during the forecast period. The adoption of built-in industrial automation to assess correctly drives the demand for plant asset management. Industrial manufacturers enhance plant asset management by tracking errors and avoiding breakdowns.

Manufacturers are collecting data in real time and managing the quality, which in turn increases the demand for industrial automation. Adoption of plant assets management identifies the problem before production and provides certain actions driving the market growth. Industrial automation assets secured a CAGR of 11.4% in the historic period between 2017 and 2020.

Which End-use Industry Influences the Global Market?

Based on the end-use industry, the mining & metals industry is leading the global market by capturing a significant CAGR during the forecast period. The significantly growing mining and metal industry increased the adoption of industrial automation to solve related problems and manage the work. The growing demand for metal processing equipment to provide accurate and effective results, reduce expenses and increase reliability are driving the market opportunities.

Top Countries Data Table Mentioned Below:

Country United States
CAGR (2017 to 2022) 11.7%
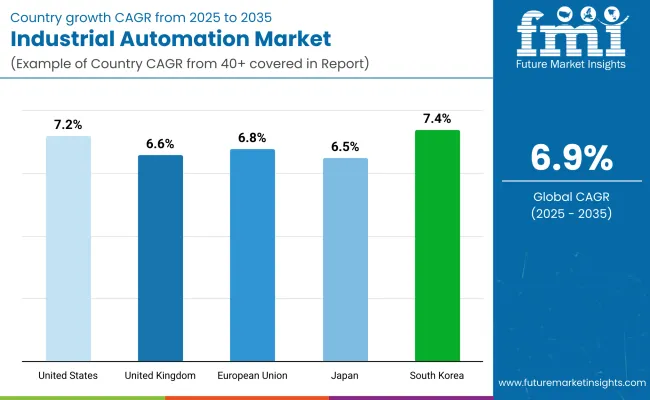
CAGR (2023 to 2033) 7%
Valuation (2023 to 2033) US$ 28.8 billion
Country United Kingdom
CAGR (2017 to 2022) 10.7%
CAGR (2023 to 2033) 6.3%
Valuation (2023 to 2033) US$ 3.4 billion
Country China
CAGR (2017 to 2022) 11.3%
CAGR (2023 to 2033) 6.6%
Valuation (2023 to 2033) US$ 5.8 billion
Country Japan
CAGR (2017 to 2022) 10.1%
CAGR (2023 to 2033) 5.7%
Valuation (2023 to 2033) US$ 4.8 billion
Country South Korea
CAGR (2017 to 2022) 8.8%
CAGR (2023 to 2033) 5.0%
Valuation (2023 to 2033) US$ 2.8 billion

Growing Deployment of Internet of Things Software Surges the United States Market

The United States dominates the global market by registering a CAGR of 7% with a valuation of US$ 28.8 billion during the foreseen time. The United States market is continuously growing with the technology-driven economy. The innovation of the Internet of Things with software programs and a rising number of end-use industries are propelling the United States industrial automation market.

Adopting advanced industrial automation technology in the food & beverages sector, such as automated material handling, is driving the market. Several key marketers are implementing various strategies to fuel market growth in the coming period.

The oil & gas sector accounts for the maximum revenue in the market by increasing the adoption of industrial automation in the United States. In September 2022, ABB Ltd expanded the industrial automation sector by manufacturing the latest EV charger stations all around the United States. These sufficiently fulfill the requirement for electric vehicles across the United States. The United States secured a CAGR of 11.7% in the historic period between 2017 and 2022.

Robotic Industrial Automation Drives the United Kingdom Market

The United Kingdom is capturing a significant CAGR of 6.3% with a valuation of US$ 3.4 billion during the forecast period. The increasing demand for automatic and advanced machinery to reduce labor workload drives the United Kingdom's industrial automation market. Growing investment in the advanced and latest Artificial Intelligence industrial automation are fueling the market opportunities in the United Kingdom.

The rising demand for robotic and automation products for manufacturing companies is expected to drive market growth. With growing digital transformation, rapid urbanization, and increasing production, the adoption of industrial automation is booming in the United Kingdom market. The United Kingdom captured a CAGR of 10.7% between 2017 and 2022 in the historical period

Emerging Economies and Smart Production Boost China Market

China is one of the significant growing countries in the Asia Pacific region. China is securing a CAGR of 6.6% with a valuation of US$ 5.8 billion during the forecast period. The rising key companies, emerging economies, and present market players are fueling China industrial automation market. The increasing demand for advanced industrial plants and smart manufacturing production is also playing a key role.

Implementing advanced technology and growing end-use industries such as pharmaceuticals, food & beverages, and automotive are expected to flourish the market in China. China captured a CAGR of 11.3% between 2017 and 2022 in the historical period.

Competitive Landscape

The present key players are introducing new advanced products and services in the market all around the globe. These players reduce the work of labor by improving mass production through innovative technologies.

Several automation service vendors invest millions of dollars in research and development activities to develop better marketing skills. The essential players focus on expanding the market by adopting various marketing tactics, including mergers, acquisitions, partnerships, and product launches.

Key Players working in the Industrial Automation Market are:

  • Schneider Electric (France)
  • Emerson Electric Co. (USA)
  • ABB (Switzerland)
  • General Electric (USA)
  • Honeywell International (USA)
  • Mitsubishi Electric (Japan)
  • FANUC (Japan)
  • Rockwell Automation (USA)
  • Siemens (Germany)
  • Yokogawa Electric (Japan)

Recent Developments:

  • In February 2021, ABB announced its new cobot range automation robots- GoFa and SWIFT. These robots improve performance through payload and fast work mobility.
  • In January 2021, Omron announced its new i4 series robot- SCARA, to fast automate speed, transportation, and high-precision assembly. This new series robot includes high performance and light-weighted compact.
  • In November 2020, Rockwell Automation developed a better version of assets management software. The software provides the latest update and recovers the automation devices.
  • In June 2022, Siemens and NVIDIA signed an agreement of partnership to bring industrial automation to the next level by adopting Artificial Intelligence and digital twin technology.
  • In May 2022, Emerson Electric Company announced its new launch- TopWorX DX Partial Stoke Test. This automation solution enhances safety and provides an emergency valve.
  • In April 2021, Accenture completed its acquisition with Pollux. This acquisition expands the experiences and technical expertise of Pollux in automation solutions.

Scope of Report

Attribute Details
Forecast Period 2023 to 2033
Historical Data Available for 2017 to 2022
Market Analysis US$ billion for Value
Key Countries Covered Unite States, Canada, Germany, United Kingdom, France, Italy, Spain, Russia, China, Japan, South Korea, India, Thailand, Malaysia, Indonesia, Australia, New Zealand, GCC Countries, Northern Africa, South Africa, and Türkiye
Key Segments Covered
  • Deployment
  • Component
  • End-use Industry
  • Region
Key Companies Profiled
  • Schneider Electric (France)
  • Emerson Electric Co. (USA)
  • ABB (Switzerland)
  • General Electric (USA)
  • Honeywell International (USA)
  • Mitsubishi Electric (Japan)
  • FANUC (Japan)
  • Rockwell Automation (USA)
  • Siemens (Germany)
  • Yokogawa Electric (Japan)
Report Coverage Market Forecast, Company Share Analysis, Competition Intelligence, DROT Analysis, Market Dynamics and Challenges, and Strategic Growth Initiatives
Customization & Pricing Available upon Request

Industrial Automation Market by Category

By Deployment:

  • Industrial Robots
  • Machine Vision System
  • Process Analyzer
  • Field Instruments
  • Human Machine Interface
  • Industrial PC
  • Industrial Sensors
  • Industrial 3D Printing
  • Vibration Monitoring

By Component:

  • Supervisory Control and Data Acquisition
  • Programmable Logic Controller
  • Distributed Control System
  • Manufacturing Execution System
  • Industrial Safety
  • Plant Asset Management

By End-use Industry:

  • Oil & Gas, Chemicals
  • Pharmaceuticals & Medical Devices
  • Food & Beverages
  • Energy & Power
  • Automotive
  • Machine Manufacturing
  • Water & Wastewater Treatment
  • Electronics & Semiconductors
  • Metals & Mining
  • Others

By Region:

  • North America
  • Latin America
  • Europe
  • South Asia & Pacific
  • East Asia
  • The Middle East & Africa (MEA)

Frequently Asked Questions

What is the Expected Value of the Industrial Automation Market in 2023?

The industrial automation market is valued at US$ 40.6 billion in 2023.

What is the CAGR for the Global Industrial Automation Market from 2023 to 2033?

The industrial automation market’s CAGR from 2023 to 2033 will be 7.2%.

What is the Top 3 Countries’ Value in the Industrial Automation Market?

The top 3 countries’ value in the industrial automation market is US$ 37.2 billion.

What is the Expected CAGR of China’s Industrial Automation Market until 2033?

China’s industrial automation market is estimated to surge at a CAGR of 6.6% through 2033.

Which is the Key Segment by Deployment Value in the Industrial Automation market?

Industrial Sensors are likely to remain preferred in the market.

Table of Content

1. Executive Summary | Industrial Automation Market 

    1.1. Global Market Outlook

    1.2. Demand-side Trends

    1.3. Supply-side Trends

    1.4. Technology Roadmap Analysis

    1.5. Analysis and Recommendations

2. Market Overview

    2.1. Market Coverage / Taxonomy

    2.2. Market Definition / Scope / Limitations

3. Market Background

    3.1. Market Dynamics

        3.1.1. Drivers

        3.1.2. Restraints

        3.1.3. Opportunity

        3.1.4. Trends

    3.2. Scenario Forecast

        3.2.1. Demand in Optimistic Scenario

        3.2.2. Demand in Likely Scenario

        3.2.3. Demand in Conservative Scenario

    3.3. Opportunity Map Analysis

    3.4. Investment Feasibility Matrix

    3.5. PESTLE and Porter’s Analysis

    3.6. Regulatory Landscape

        3.6.1. By Key Regions

        3.6.2. By Key Countries

    3.7. Regional Parent Market Outlook

4. Global Market Analysis 2017 to 2022 and Forecast, 2023 to 2033

    4.1. Historical Market Size Value (US$ Million) Analysis, 2017 to 2022

    4.2. Current and Future Market Size Value (US$ Million) Projections, 2023 to 2033

        4.2.1. Y-o-Y Growth Trend Analysis

        4.2.2. Absolute $ Opportunity Analysis

5. Global Market Analysis 2017 to 2022 and Forecast 2023 to 2033, By Deployment

    5.1. Introduction / Key Findings

    5.2. Historical Market Size Value (US$ Million) Analysis By Deployment, 2017 to 2022

    5.3. Current and Future Market Size Value (US$ Million) Analysis and Forecast By Deployment, 2023 to 2033

        5.3.1. Industrial Robots

        5.3.2. Machine Vision System

        5.3.3. Process Analyzer

        5.3.4. Field Instruments

        5.3.5. Human Machine Interface

        5.3.6. Industrial PC

        5.3.7. Industrial Sensors

        5.3.8. Industrial 3D Printing

        5.3.9. Vibration Monitoring

    5.4. Y-o-Y Growth Trend Analysis By Deployment, 2017 to 2022

    5.5. Absolute $ Opportunity Analysis By Deployment, 2023 to 2033

6. Global Market Analysis 2017 to 2022 and Forecast 2023 to 2033, By Component

    6.1. Introduction / Key Findings

    6.2. Historical Market Size Value (US$ Million) Analysis By Component, 2017 to 2022

    6.3. Current and Future Market Size Value (US$ Million) Analysis and Forecast By Component, 2023 to 2033

        6.3.1. Supervisory Control And Data Acquisition

        6.3.2. Programmable Logic Controller

        6.3.3. Distributed Control System

        6.3.4. Manufacturing Execution System

        6.3.5. Industrial Safety

        6.3.6. Plant Asset Management

    6.4. Y-o-Y Growth Trend Analysis By Component, 2017 to 2022

    6.5. Absolute $ Opportunity Analysis By Component, 2023 to 2033

7. Global Market Analysis 2017 to 2022 and Forecast 2023 to 2033, By End-use Industry

    7.1. Introduction / Key Findings

    7.2. Historical Market Size Value (US$ Million) Analysis By End-use Industry , 2017 to 2022

    7.3. Current and Future Market Size Value (US$ Million) Analysis and Forecast By End-use Industry , 2023 to 2033

        7.3.1. Oil & Gas

        7.3.2. Chemicals

        7.3.3. Pharmaceuticals & Medical Devices

        7.3.4. Food & Beverages

        7.3.5. Energy & Power

        7.3.6. Automotive

        7.3.7. Machine Manufacturing

        7.3.8. Water & Wastewater Treatment

        7.3.9. Electronics & Semiconductors

        7.3.10. Metals & Mining

        7.3.11. Others

    7.4. Y-o-Y Growth Trend Analysis By End-use Industry , 2017 to 2022

    7.5. Absolute $ Opportunity Analysis By End-use Industry , 2023 to 2033

8. Global Market Analysis 2017 to 2022 and Forecast 2023 to 2033, By Region

    8.1. Introduction

    8.2. Historical Market Size Value (US$ Million) Analysis By Region, 2017 to 2022

    8.3. Current Market Size Value (US$ Million) Analysis and Forecast By Region, 2023 to 2033

        8.3.1. North America

        8.3.2. Latin America

        8.3.3. Europe

        8.3.4. Asia Pacific

        8.3.5. Middle East and Africa

    8.4. Market Attractiveness Analysis By Region

9. North America Market Analysis 2017 to 2022 and Forecast 2023 to 2033, By Country

    9.1. Historical Market Size Value (US$ Million) Trend Analysis By Market Taxonomy, 2017 to 2022

    9.2. Market Size Value (US$ Million) Forecast By Market Taxonomy, 2023 to 2033

        9.2.1. By Country

            9.2.1.1. The USA

            9.2.1.2. Canada

        9.2.2. By Deployment

        9.2.3. By Component

        9.2.4. By End-use Industry

    9.3. Market Attractiveness Analysis

        9.3.1. By Country

        9.3.2. By Deployment

        9.3.3. By Component

        9.3.4. By End-use Industry

    9.4. Key Takeaways

10. Latin America Market Analysis 2017 to 2022 and Forecast 2023 to 2033, By Country

    10.1. Historical Market Size Value (US$ Million) Trend Analysis By Market Taxonomy, 2017 to 2022

    10.2. Market Size Value (US$ Million) Forecast By Market Taxonomy, 2023 to 2033

        10.2.1. By Country

            10.2.1.1. Brazil

            10.2.1.2. Mexico

            10.2.1.3. Rest of Latin America

        10.2.2. By Deployment

        10.2.3. By Component

        10.2.4. By End-use Industry

    10.3. Market Attractiveness Analysis

        10.3.1. By Country

        10.3.2. By Deployment

        10.3.3. By Component

        10.3.4. By End-use Industry

    10.4. Key Takeaways

11. Europe Market Analysis 2017 to 2022 and Forecast 2023 to 2033, By Country

    11.1. Historical Market Size Value (US$ Million) Trend Analysis By Market Taxonomy, 2017 to 2022

    11.2. Market Size Value (US$ Million) Forecast By Market Taxonomy, 2023 to 2033

        11.2.1. By Country

            11.2.1.1. Germany

            11.2.1.2. United Kingdom (UK)

            11.2.1.3. France

            11.2.1.4. Spain

            11.2.1.5. Italy

            11.2.1.6. Rest of Europe

        11.2.2. By Deployment

        11.2.3. By Component

        11.2.4. By End-use Industry

    11.3. Market Attractiveness Analysis

        11.3.1. By Country

        11.3.2. By Deployment

        11.3.3. By Component

        11.3.4. By End-use Industry

    11.4. Key Takeaways

12. Asia Pacific Market Analysis 2017 to 2022 and Forecast 2023 to 2033, By Country

    12.1. Historical Market Size Value (US$ Million) Trend Analysis By Market Taxonomy, 2017 to 2022

    12.2. Market Size Value (US$ Million) Forecast By Market Taxonomy, 2023 to 2033

        12.2.1. By Country

            12.2.1.1. China

            12.2.1.2. Japan

            12.2.1.3. India

            12.2.1.4. Thailand

            12.2.1.5. Singapore

            12.2.1.6. Australia

            12.2.1.7. Rest of Asia Pacific

        12.2.2. By Deployment

        12.2.3. By Component

        12.2.4. By End-use Industry

    12.3. Market Attractiveness Analysis

        12.3.1. By Country

        12.3.2. By Deployment

        12.3.3. By Component

        12.3.4. By End-use Industry

    12.4. Key Takeaways

13. Middle East and Africa Market Analysis 2017 to 2022 and Forecast 2023 to 2033, By Country

    13.1. Historical Market Size Value (US$ Million) Trend Analysis By Market Taxonomy, 2017 to 2022

    13.2. Market Size Value (US$ Million) Forecast By Market Taxonomy, 2023 to 2033

        13.2.1. By Country

            13.2.1.1. GCC Countries

            13.2.1.2. South Africa

            13.2.1.3. Israel

            13.2.1.4. Rest of Middle East and Africa

        13.2.2. By Deployment

        13.2.3. By Component

        13.2.4. By End-use Industry

    13.3. Market Attractiveness Analysis

        13.3.1. By Country

        13.3.2. By Deployment

        13.3.3. By Component

        13.3.4. By End-use Industry

    13.4. Key Takeaways

14. Key Countries Market Analysis

    14.1. USA

        14.1.1. Pricing Analysis

        14.1.2. Market Share Analysis, 2022

            14.1.2.1. By Deployment

            14.1.2.2. By Component

            14.1.2.3. By End-use Industry

    14.2. Canada

        14.2.1. Pricing Analysis

        14.2.2. Market Share Analysis, 2022

            14.2.2.1. By Deployment

            14.2.2.2. By Component

            14.2.2.3. By End-use Industry

    14.3. Brazil

        14.3.1. Pricing Analysis

        14.3.2. Market Share Analysis, 2022

            14.3.2.1. By Deployment

            14.3.2.2. By Component

            14.3.2.3. By End-use Industry

    14.4. Mexico

        14.4.1. Pricing Analysis

        14.4.2. Market Share Analysis, 2022

            14.4.2.1. By Deployment

            14.4.2.2. By Component

            14.4.2.3. By End-use Industry

    14.5. Germany

        14.5.1. Pricing Analysis

        14.5.2. Market Share Analysis, 2022

            14.5.2.1. By Deployment

            14.5.2.2. By Component

            14.5.2.3. By End-use Industry

    14.6. UK

        14.6.1. Pricing Analysis

        14.6.2. Market Share Analysis, 2022

            14.6.2.1. By Deployment

            14.6.2.2. By Component

            14.6.2.3. By End-use Industry

    14.7. France

        14.7.1. Pricing Analysis

        14.7.2. Market Share Analysis, 2022

            14.7.2.1. By Deployment

            14.7.2.2. By Component

            14.7.2.3. By End-use Industry

    14.8. Spain

        14.8.1. Pricing Analysis

        14.8.2. Market Share Analysis, 2022

            14.8.2.1. By Deployment

            14.8.2.2. By Component

            14.8.2.3. By End-use Industry

    14.9. Italy

        14.9.1. Pricing Analysis

        14.9.2. Market Share Analysis, 2022

            14.9.2.1. By Deployment

            14.9.2.2. By Component

            14.9.2.3. By End-use Industry

    14.10. China

        14.10.1. Pricing Analysis

        14.10.2. Market Share Analysis, 2022

            14.10.2.1. By Deployment

            14.10.2.2. By Component

            14.10.2.3. By End-use Industry

    14.11. Japan

        14.11.1. Pricing Analysis

        14.11.2. Market Share Analysis, 2022

            14.11.2.1. By Deployment

            14.11.2.2. By Component

            14.11.2.3. By End-use Industry

    14.12. South Korea

        14.12.1. Pricing Analysis

        14.12.2. Market Share Analysis, 2022

            14.12.2.1. By Deployment

            14.12.2.2. By Component

            14.12.2.3. By End-use Industry

    14.13. Thailand

        14.13.1. Pricing Analysis

        14.13.2. Market Share Analysis, 2022

            14.13.2.1. By Deployment

            14.13.2.2. By Component

            14.13.2.3. By End-use Industry

    14.14. Singapore

        14.14.1. Pricing Analysis

        14.14.2. Market Share Analysis, 2022

            14.14.2.1. By Deployment

            14.14.2.2. By Component

            14.14.2.3. By End-use Industry

    14.15. Australia

        14.15.1. Pricing Analysis

        14.15.2. Market Share Analysis, 2022

            14.15.2.1. By Deployment

            14.15.2.2. By Component

            14.15.2.3. By End-use Industry

    14.16. GCC Countries

        14.16.1. Pricing Analysis

        14.16.2. Market Share Analysis, 2022

            14.16.2.1. By Deployment

            14.16.2.2. By Component

            14.16.2.3. By End-use Industry

    14.17. South Africa

        14.17.1. Pricing Analysis

        14.17.2. Market Share Analysis, 2022

            14.17.2.1. By Deployment

            14.17.2.2. By Component

            14.17.2.3. By End-use Industry

    14.18. Israel

        14.18.1. Pricing Analysis

        14.18.2. Market Share Analysis, 2022

            14.18.2.1. By Deployment

            14.18.2.2. By Component

            14.18.2.3. By End-use Industry

15. Market Structure Analysis

    15.1. Competition Dashboard

    15.2. Competition Benchmarking

    15.3. Market Share Analysis of Top Players

        15.3.1. By Regional

        15.3.2. By Deployment

        15.3.3. By Component

        15.3.4. By End-use Industry

16. Competition Analysis

    16.1. Competition Deep Dive

        16.1.1. ABB

            16.1.1.1. Overview

            16.1.1.2. Product Portfolio

            16.1.1.3. Profitability by Market Segments

            16.1.1.4. Sales Footprint

            16.1.1.5. Strategy Overview

                16.1.1.5.1. Marketing Strategy

        16.1.2. Emerson Electric Co.

            16.1.2.1. Overview

            16.1.2.2. Product Portfolio

            16.1.2.3. Profitability by Market Segments

            16.1.2.4. Sales Footprint

            16.1.2.5. Strategy Overview

                16.1.2.5.1. Marketing Strategy

        16.1.3. FANUC

            16.1.3.1. Overview

            16.1.3.2. Product Portfolio

            16.1.3.3. Profitability by Market Segments

            16.1.3.4. Sales Footprint

            16.1.3.5. Strategy Overview

                16.1.3.5.1. Marketing Strategy

        16.1.4. General Electric

            16.1.4.1. Overview

            16.1.4.2. Product Portfolio

            16.1.4.3. Profitability by Market Segments

            16.1.4.4. Sales Footprint

            16.1.4.5. Strategy Overview

                16.1.4.5.1. Marketing Strategy

        16.1.5. Honeywell International

            16.1.5.1. Overview

            16.1.5.2. Product Portfolio

            16.1.5.3. Profitability by Market Segments

            16.1.5.4. Sales Footprint

            16.1.5.5. Strategy Overview

                16.1.5.5.1. Marketing Strategy

        16.1.6. Mitsubishi Electric

            16.1.6.1. Overview

            16.1.6.2. Product Portfolio

            16.1.6.3. Profitability by Market Segments

            16.1.6.4. Sales Footprint

            16.1.6.5. Strategy Overview

                16.1.6.5.1. Marketing Strategy

        16.1.7. Rockwell Automation

            16.1.7.1. Overview

            16.1.7.2. Product Portfolio

            16.1.7.3. Profitability by Market Segments

            16.1.7.4. Sales Footprint

            16.1.7.5. Strategy Overview

                16.1.7.5.1. Marketing Strategy

        16.1.8. Schneider Electric

            16.1.8.1. Overview

            16.1.8.2. Product Portfolio

            16.1.8.3. Profitability by Market Segments

            16.1.8.4. Sales Footprint

            16.1.8.5. Strategy Overview

                16.1.8.5.1. Marketing Strategy

        16.1.9. Siemens 

            16.1.9.1. Overview

            16.1.9.2. Product Portfolio

            16.1.9.3. Profitability by Market Segments

            16.1.9.4. Sales Footprint

            16.1.9.5. Strategy Overview

                16.1.9.5.1. Marketing Strategy

        16.1.10. Yokogawa Electric

            16.1.10.1. Overview

            16.1.10.2. Product Portfolio

            16.1.10.3. Profitability by Market Segments

            16.1.10.4. Sales Footprint

            16.1.10.5. Strategy Overview

                16.1.10.5.1. Marketing Strategy

17. Assumptions & Acronyms Used

18. Research Methodology

Don't pay for what you don't need

Customize your report by selecting specific countries or regions and save 30%!

List of Tables

Table 1: Global Market Value (US$ Million) Forecast by Region, 2017 to 2033

Table 2: Global Market Value (US$ Million) Forecast by Deployment, 2017 to 2033

Table 3: Global Market Value (US$ Million) Forecast by Component, 2017 to 2033

Table 4: Global Market Value (US$ Million) Forecast by End-use Industry , 2017 to 2033

Table 5: North America Market Value (US$ Million) Forecast by Country, 2017 to 2033

Table 6: North America Market Value (US$ Million) Forecast by Deployment, 2017 to 2033

Table 7: North America Market Value (US$ Million) Forecast by Component, 2017 to 2033

Table 8: North America Market Value (US$ Million) Forecast by End-use Industry , 2017 to 2033

Table 9: Latin America Market Value (US$ Million) Forecast by Country, 2017 to 2033

Table 10: Latin America Market Value (US$ Million) Forecast by Deployment, 2017 to 2033

Table 11: Latin America Market Value (US$ Million) Forecast by Component, 2017 to 2033

Table 12: Latin America Market Value (US$ Million) Forecast by End-use Industry , 2017 to 2033

Table 13: Europe Market Value (US$ Million) Forecast by Country, 2017 to 2033

Table 14: Europe Market Value (US$ Million) Forecast by Deployment, 2017 to 2033

Table 15: Europe Market Value (US$ Million) Forecast by Component, 2017 to 2033

Table 16: Europe Market Value (US$ Million) Forecast by End-use Industry , 2017 to 2033

Table 17: Asia Pacific Market Value (US$ Million) Forecast by Country, 2017 to 2033

Table 18: Asia Pacific Market Value (US$ Million) Forecast by Deployment, 2017 to 2033

Table 19: Asia Pacific Market Value (US$ Million) Forecast by Component, 2017 to 2033

Table 20: Asia Pacific Market Value (US$ Million) Forecast by End-use Industry , 2017 to 2033

Table 21: Middle East and Africa Market Value (US$ Million) Forecast by Country, 2017 to 2033

Table 22: Middle East and Africa Market Value (US$ Million) Forecast by Deployment, 2017 to 2033

Table 23: Middle East and Africa Market Value (US$ Million) Forecast by Component, 2017 to 2033

Table 24: Middle East and Africa Market Value (US$ Million) Forecast by End-use Industry , 2017 to 2033
Nikhil Kaitwade
Nikhil Kaitwade

Principal Consultant

Talk to Analyst

Find your sweet spots for generating winning opportunities in this market.

List of Charts

Figure 1: Global Market Value (US$ Million) by Deployment, 2023 to 2033

Figure 2: Global Market Value (US$ Million) by Component, 2023 to 2033

Figure 3: Global Market Value (US$ Million) by End-use Industry , 2023 to 2033

Figure 4: Global Market Value (US$ Million) by Region, 2023 to 2033

Figure 5: Global Market Value (US$ Million) Analysis by Region, 2017 to 2033

Figure 6: Global Market Value Share (%) and BPS Analysis by Region, 2023 to 2033

Figure 7: Global Market Y-o-Y Growth (%) Projections by Region, 2023 to 2033

Figure 8: Global Market Value (US$ Million) Analysis by Deployment, 2017 to 2033

Figure 9: Global Market Value Share (%) and BPS Analysis by Deployment, 2023 to 2033

Figure 10: Global Market Y-o-Y Growth (%) Projections by Deployment, 2023 to 2033

Figure 11: Global Market Value (US$ Million) Analysis by Component, 2017 to 2033

Figure 12: Global Market Value Share (%) and BPS Analysis by Component, 2023 to 2033

Figure 13: Global Market Y-o-Y Growth (%) Projections by Component, 2023 to 2033

Figure 14: Global Market Value (US$ Million) Analysis by End-use Industry , 2017 to 2033

Figure 15: Global Market Value Share (%) and BPS Analysis by End-use Industry , 2023 to 2033

Figure 16: Global Market Y-o-Y Growth (%) Projections by End-use Industry , 2023 to 2033

Figure 17: Global Market Attractiveness by Deployment, 2023 to 2033

Figure 18: Global Market Attractiveness by Component, 2023 to 2033

Figure 19: Global Market Attractiveness by End-use Industry , 2023 to 2033

Figure 20: Global Market Attractiveness by Region, 2023 to 2033

Figure 21: North America Market Value (US$ Million) by Deployment, 2023 to 2033

Figure 22: North America Market Value (US$ Million) by Component, 2023 to 2033

Figure 23: North America Market Value (US$ Million) by End-use Industry , 2023 to 2033

Figure 24: North America Market Value (US$ Million) by Country, 2023 to 2033

Figure 25: North America Market Value (US$ Million) Analysis by Country, 2017 to 2033

Figure 26: North America Market Value Share (%) and BPS Analysis by Country, 2023 to 2033

Figure 27: North America Market Y-o-Y Growth (%) Projections by Country, 2023 to 2033

Figure 28: North America Market Value (US$ Million) Analysis by Deployment, 2017 to 2033

Figure 29: North America Market Value Share (%) and BPS Analysis by Deployment, 2023 to 2033

Figure 30: North America Market Y-o-Y Growth (%) Projections by Deployment, 2023 to 2033

Figure 31: North America Market Value (US$ Million) Analysis by Component, 2017 to 2033

Figure 32: North America Market Value Share (%) and BPS Analysis by Component, 2023 to 2033

Figure 33: North America Market Y-o-Y Growth (%) Projections by Component, 2023 to 2033

Figure 34: North America Market Value (US$ Million) Analysis by End-use Industry , 2017 to 2033

Figure 35: North America Market Value Share (%) and BPS Analysis by End-use Industry , 2023 to 2033

Figure 36: North America Market Y-o-Y Growth (%) Projections by End-use Industry , 2023 to 2033

Figure 37: North America Market Attractiveness by Deployment, 2023 to 2033

Figure 38: North America Market Attractiveness by Component, 2023 to 2033

Figure 39: North America Market Attractiveness by End-use Industry , 2023 to 2033

Figure 40: North America Market Attractiveness by Country, 2023 to 2033

Figure 41: Latin America Market Value (US$ Million) by Deployment, 2023 to 2033

Figure 42: Latin America Market Value (US$ Million) by Component, 2023 to 2033

Figure 43: Latin America Market Value (US$ Million) by End-use Industry , 2023 to 2033

Figure 44: Latin America Market Value (US$ Million) by Country, 2023 to 2033

Figure 45: Latin America Market Value (US$ Million) Analysis by Country, 2017 to 2033

Figure 46: Latin America Market Value Share (%) and BPS Analysis by Country, 2023 to 2033

Figure 47: Latin America Market Y-o-Y Growth (%) Projections by Country, 2023 to 2033

Figure 48: Latin America Market Value (US$ Million) Analysis by Deployment, 2017 to 2033

Figure 49: Latin America Market Value Share (%) and BPS Analysis by Deployment, 2023 to 2033

Figure 50: Latin America Market Y-o-Y Growth (%) Projections by Deployment, 2023 to 2033

Figure 51: Latin America Market Value (US$ Million) Analysis by Component, 2017 to 2033

Figure 52: Latin America Market Value Share (%) and BPS Analysis by Component, 2023 to 2033

Figure 53: Latin America Market Y-o-Y Growth (%) Projections by Component, 2023 to 2033

Figure 54: Latin America Market Value (US$ Million) Analysis by End-use Industry , 2017 to 2033

Figure 55: Latin America Market Value Share (%) and BPS Analysis by End-use Industry , 2023 to 2033

Figure 56: Latin America Market Y-o-Y Growth (%) Projections by End-use Industry , 2023 to 2033

Figure 57: Latin America Market Attractiveness by Deployment, 2023 to 2033

Figure 58: Latin America Market Attractiveness by Component, 2023 to 2033

Figure 59: Latin America Market Attractiveness by End-use Industry , 2023 to 2033

Figure 60: Latin America Market Attractiveness by Country, 2023 to 2033

Figure 61: Europe Market Value (US$ Million) by Deployment, 2023 to 2033

Figure 62: Europe Market Value (US$ Million) by Component, 2023 to 2033

Figure 63: Europe Market Value (US$ Million) by End-use Industry , 2023 to 2033

Figure 64: Europe Market Value (US$ Million) by Country, 2023 to 2033

Figure 65: Europe Market Value (US$ Million) Analysis by Country, 2017 to 2033

Figure 66: Europe Market Value Share (%) and BPS Analysis by Country, 2023 to 2033

Figure 67: Europe Market Y-o-Y Growth (%) Projections by Country, 2023 to 2033

Figure 68: Europe Market Value (US$ Million) Analysis by Deployment, 2017 to 2033

Figure 69: Europe Market Value Share (%) and BPS Analysis by Deployment, 2023 to 2033

Figure 70: Europe Market Y-o-Y Growth (%) Projections by Deployment, 2023 to 2033

Figure 71: Europe Market Value (US$ Million) Analysis by Component, 2017 to 2033

Figure 72: Europe Market Value Share (%) and BPS Analysis by Component, 2023 to 2033

Figure 73: Europe Market Y-o-Y Growth (%) Projections by Component, 2023 to 2033

Figure 74: Europe Market Value (US$ Million) Analysis by End-use Industry , 2017 to 2033

Figure 75: Europe Market Value Share (%) and BPS Analysis by End-use Industry , 2023 to 2033

Figure 76: Europe Market Y-o-Y Growth (%) Projections by End-use Industry , 2023 to 2033

Figure 77: Europe Market Attractiveness by Deployment, 2023 to 2033

Figure 78: Europe Market Attractiveness by Component, 2023 to 2033

Figure 79: Europe Market Attractiveness by End-use Industry , 2023 to 2033

Figure 80: Europe Market Attractiveness by Country, 2023 to 2033

Figure 81: Asia Pacific Market Value (US$ Million) by Deployment, 2023 to 2033

Figure 82: Asia Pacific Market Value (US$ Million) by Component, 2023 to 2033

Figure 83: Asia Pacific Market Value (US$ Million) by End-use Industry , 2023 to 2033

Figure 84: Asia Pacific Market Value (US$ Million) by Country, 2023 to 2033

Figure 85: Asia Pacific Market Value (US$ Million) Analysis by Country, 2017 to 2033

Figure 86: Asia Pacific Market Value Share (%) and BPS Analysis by Country, 2023 to 2033

Figure 87: Asia Pacific Market Y-o-Y Growth (%) Projections by Country, 2023 to 2033

Figure 88: Asia Pacific Market Value (US$ Million) Analysis by Deployment, 2017 to 2033

Figure 89: Asia Pacific Market Value Share (%) and BPS Analysis by Deployment, 2023 to 2033

Figure 90: Asia Pacific Market Y-o-Y Growth (%) Projections by Deployment, 2023 to 2033

Figure 91: Asia Pacific Market Value (US$ Million) Analysis by Component, 2017 to 2033

Figure 92: Asia Pacific Market Value Share (%) and BPS Analysis by Component, 2023 to 2033

Figure 93: Asia Pacific Market Y-o-Y Growth (%) Projections by Component, 2023 to 2033

Figure 94: Asia Pacific Market Value (US$ Million) Analysis by End-use Industry , 2017 to 2033

Figure 95: Asia Pacific Market Value Share (%) and BPS Analysis by End-use Industry , 2023 to 2033

Figure 96: Asia Pacific Market Y-o-Y Growth (%) Projections by End-use Industry , 2023 to 2033

Figure 97: Asia Pacific Market Attractiveness by Deployment, 2023 to 2033

Figure 98: Asia Pacific Market Attractiveness by Component, 2023 to 2033

Figure 99: Asia Pacific Market Attractiveness by End-use Industry , 2023 to 2033

Figure 100: Asia Pacific Market Attractiveness by Country, 2023 to 2033

Figure 101: Middle East and Africa Market Value (US$ Million) by Deployment, 2023 to 2033

Figure 102: Middle East and Africa Market Value (US$ Million) by Component, 2023 to 2033

Figure 103: Middle East and Africa Market Value (US$ Million) by End-use Industry , 2023 to 2033

Figure 104: Middle East and Africa Market Value (US$ Million) by Country, 2023 to 2033

Figure 105: Middle East and Africa Market Value (US$ Million) Analysis by Country, 2017 to 2033

Figure 106: Middle East and Africa Market Value Share (%) and BPS Analysis by Country, 2023 to 2033

Figure 107: Middle East and Africa Market Y-o-Y Growth (%) Projections by Country, 2023 to 2033

Figure 108: Middle East and Africa Market Value (US$ Million) Analysis by Deployment, 2017 to 2033

Figure 109: Middle East and Africa Market Value Share (%) and BPS Analysis by Deployment, 2023 to 2033

Figure 110: Middle East and Africa Market Y-o-Y Growth (%) Projections by Deployment, 2023 to 2033

Figure 111: Middle East and Africa Market Value (US$ Million) Analysis by Component, 2017 to 2033

Figure 112: Middle East and Africa Market Value Share (%) and BPS Analysis by Component, 2023 to 2033

Figure 113: Middle East and Africa Market Y-o-Y Growth (%) Projections by Component, 2023 to 2033

Figure 114: Middle East and Africa Market Value (US$ Million) Analysis by End-use Industry , 2017 to 2033

Figure 115: Middle East and Africa Market Value Share (%) and BPS Analysis by End-use Industry , 2023 to 2033

Figure 116: Middle East and Africa Market Y-o-Y Growth (%) Projections by End-use Industry , 2023 to 2033

Figure 117: Middle East and Africa Market Attractiveness by Deployment, 2023 to 2033

Figure 118: Middle East and Africa Market Attractiveness by Component, 2023 to 2033

Figure 119: Middle East and Africa Market Attractiveness by End-use Industry , 2023 to 2033

Figure 120: Middle East and Africa Market Attractiveness by Country, 2023 to 2033

Recommendations

Industrial Automation

Oil & Gas Terminal Automation Market

Published : July 2023

Industrial Automation

Factory Automation And Industrial Controls Market

Published : October 2022

Explore Industrial Automation Insights

View Reports

Industrial Automation Market