The industrial printer market is projected to rise from USD 12.8 billion in 2025 to USD 24.6 billion by 2035, adding USD 11.8 billion in new value and advancing at a 6.7% CAGR. Growth is driven by widespread integration of digital printing systems into automated production lines, rising traceability requirements across packaging, electronics, automotive, and pharmaceutical sectors, and accelerated replacement of analog marking solutions. Inkjet printing, holding 46% share, remains the preferred technology due to substrate versatility, resolution consistency, and suitability for variable data environments, while packaging & labeling, at 52%, leads application demand as companies tighten batch coding, serialization, and regulatory compliance standards. Laser, thermal transfer, and dot matrix platforms maintain relevance in niche high-durability or low-cost environments but grow at slower rates as industrial digitalization intensifies.
Packaging operations account for over half of total demand, reinforcing the central role of expiration marking, QR coding, logistics labeling, and product authentication systems across FMCG, food, beverage, pharmaceutical, and e-commerce supply chains. Electronics and automotive facilities expand uptake of continuous small-character marking for circuit boards, components, and assemblies, while textile operations increasingly adopt high-speed digital platforms for custom printing and short-run production. The shift toward connected production environments accelerates adoption of printers that support MES/ERP integration, remote monitoring, cloud diagnostics, and automated maintenance protocols in line with Industry 4.0 infrastructure requirements.
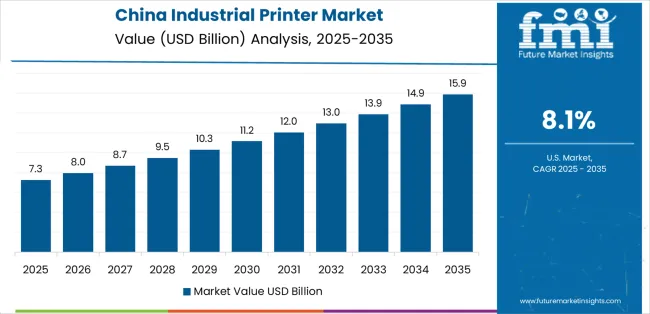
Regionally, China (8.1% CAGR) and India (7.9%) anchor global expansion through rapid factory modernization and export manufacturing growth, reinforced by large-scale packaging, electronics, and automotive production bases. The U.S. (7.4%), Germany (6.6%), and Japan (6.2%) sustain demand through advanced automation and high-specification traceability requirements. Competitive positioning is shaped by manufacturers offering robustness, print consistency, substrate adaptability, and strong service networks, with leading players including HP Inc., Epson, Canon Inc., Xerox Corporation, Ricoh Company, Domino Printing Sciences, and Markem-Imaje. Advantage increasingly depends on workflow integration, printhead reliability, ink chemistry innovation, and the ability to support multi-line production environments with minimal downtime.
A major trend driving market expansion is the growing need for traceability, compliance, and product identification across industries such as food and beverage, pharmaceuticals, automotive, electronics, chemicals, and consumer goods. Manufacturers must print expiry dates, batch numbers, barcodes, QR codes, lot information, and serial data on an ever-widening range of substrates. Industrial printers offer the precision and reliability required to ensure error-free identification on packaging films, metal parts, plastics, cartons, cables, glass surfaces, and flexible materials. As global regulatory expectations strengthen and cross-border trade increases, the role of industrial printing in compliance and logistics continues to grow.
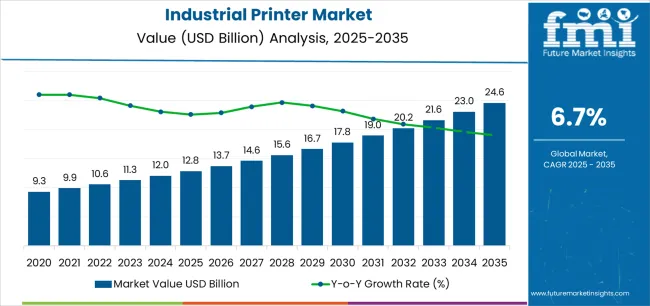
From 2030 to 2035, the market will expand from USD 16.9 billion to USD 24.6 billion, contributing USD 7.7 billion in value, or nearly 65% of decade-long growth. This stage will be defined by widespread adoption of continuous printing platforms, integration with digital manufacturing execution systems, and stronger compatibility with automated production lines. The trajectory indicates a fundamental shift in how industries approach product identification, with adoption expanding across multiple industrial domains.
Between 2025 and 2030, average annual growth is estimated at 5.7%, reflecting the transition from conventional marking and labeling devices to connected multi-color inkjet platforms. Market maturity in this stage is influenced by standardization of print quality, declining costs of high-speed printers, and growing recognition of traceability benefits, with effectiveness benchmarks reaching 68–74% in identification applications. Competition will see major players like HP and Epson enlarging industrial portfolios, while emerging firms push advancements in coding systems and automation integration.
From 2030 to 2035, expansion accelerates with USD 7.7 billion in additional value, driven by deployment of universal digital printers integrated into high-speed automated facilities. Industry focus will move from basic printing capability to workflow integration, connectivity, and compatibility with Industry 4.0 production environments, defining the next phase of competitive differentiation.
| Metric | Value |
|---|---|
| USD Market Value (2025) | USD 12.8 billion |
| USD Market Forecast (2035) | USD 24.6 billion |
| Growth Rate (CAGR) | 6.70% |
Market expansion rests on three fundamental shifts driving adoption across manufacturing and packaging sectors. Manufacturing automation creates compelling advantages through industrial printing systems that provide comprehensive production identification with validated traceability capabilities, enabling manufacturers to achieve regulatory compliance and enhance quality control while maintaining operational efficiency and justifying investment over manual marking systems. Supply chain visibility accelerates as logistics operations worldwide seek automated coding systems that deliver real-time tracking directly to warehouse environments, enabling inventory management enhancement that aligns with distribution requirements and maximizes operational transparency. Regulatory enforcement drives adoption from packaging manufacturers requiring validated printing solutions that comply with food safety standards while maintaining product authentication performance during distribution and retail operations.
The growth faces headwinds from substrate compatibility variations that differ across material types regarding ink adhesion and print durability, potentially limiting performance reliability in challenging surface categories. Equipment investment also persists regarding high-speed industrial systems and specialized print heads that may increase total capital expenses in markets with demanding production volume standards.
The industrial printer market represents a compelling intersection of manufacturing automation innovation, supply chain visibility enhancement, and production efficiency management. With robust growth projected from USD 12,847 million in 2025 to USD 24,563 million by 2035 at a 6.70% CAGR, this market is driven by increasing manufacturing digitalization trends, regulatory traceability requirements, and commercial demand for high-speed variable printing formats.
The market's expansion reflects a fundamental shift in how manufacturers and packaging companies approach product identification infrastructure. Strong growth opportunities exist across diverse applications, from food packaging operations requiring batch coding to automotive facilities demanding component marking. Geographic expansion is particularly pronounced in Asia-Pacific markets, led by China (8.1% CAGR) and India (7.9% CAGR), while established markets in North America and Europe drive innovation and specialized segment development.
The dominance of inkjet printing systems and packaging applications underscores the importance of proven digital technology and production integration in driving adoption. Equipment reliability and substrate compatibility remain key challenges, creating opportunities for companies that can deliver consistent performance while maintaining operational efficiency.
Primary Classification: The market segments by technology type into inkjet printing, laser printing, thermal transfer printing, dot matrix printing, and others categories, representing the evolution from traditional impact marking systems to advanced digital platforms for comprehensive production identification operations.
Secondary Breakdown: Application segmentation divides the market into packaging & labeling, textile printing, automotive parts marking, electronics manufacturing, pharmaceutical coding, and others sectors, reflecting distinct requirements for print quality, production speed, and regulatory compliance.
Regional Classification: Geographic distribution covers North America, Europe, Asia Pacific, Latin America, and the Middle East & Africa, with developed markets leading innovation while emerging economies show accelerating growth patterns driven by manufacturing expansion programs.
The segmentation structure reveals technology progression from basic dot matrix systems toward integrated digital printing platforms with enhanced resolution control and production integration capabilities, while application diversity spans from high-speed packaging operations to precision electronics facilities requiring comprehensive quality assurance and validated marking solutions.
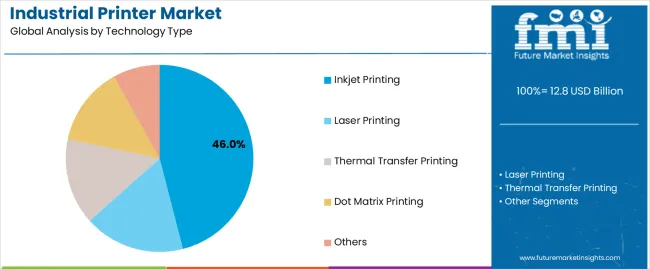
Inkjet printing segment is estimated to account for 46% of the industrial printer market share in 2025. The segment's leading position stems from its fundamental role as a critical component in flexible manufacturing applications and its extensive use across multiple production and packaging sectors. Inkjet printing's dominance is attributed to its superior versatility, including substrate compatibility, variable data capability, and high-speed performance that make it indispensable for modern manufacturing operations.
Market Position: Inkjet printing systems command the leading position in the industrial printer market through advanced print head technologies, including comprehensive nozzle configurations, precise droplet control, and reliable ink delivery that enable manufacturers to deploy printing solutions across diverse production environments.
Value Drivers: The segment benefits from manufacturer preference for proven digital technology that provides exceptional marking quality without requiring tool changes. Efficient ink consumption enables deployment in continuous coding, batch marking, and custom printing applications where speed and flexibility represent critical selection requirements.
Competitive Advantages: Inkjet printing systems differentiate through excellent substrate adaptability, proven resolution performance, and integration with production line systems that enhance manufacturing capabilities while maintaining validated print specifications suitable for diverse industrial applications.
Key market characteristics:
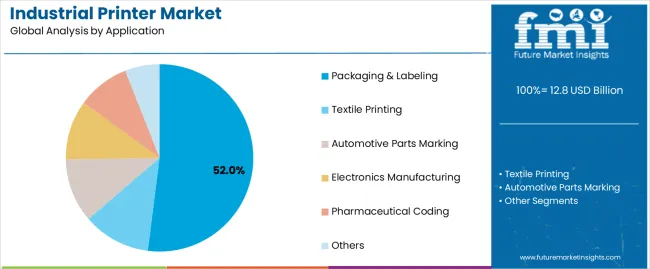
Packaging & labeling segment is projected to hold 52% of the industrial printer market share in 2025. The segment's market leadership is driven by the extensive use of industrial printers in food packaging, consumer goods labeling, pharmaceutical boxes, and shipping containers, where variable information printing serves as both an identification tool and regulatory compliance component. The packaging industry's consistent investment in traceability solutions supports the segment's dominant position.
Market Context: Packaging applications dominate the market due to widespread adoption of digital coding technology and increasing focus on supply chain visibility, product authentication, and regulatory compliance that enhance brand protection while maintaining consumer safety.
Appeal Factors: Packaging manufacturers prioritize print speed, ink versatility, and integration with packaging machinery that enable coordinated deployment across multiple production lines. The segment benefits from substantial e-commerce growth and regulatory standards that emphasize variable data printing for packaging applications.
Growth Drivers: Track-and-trace programs incorporate industrial printing as standard protocol for serialization and batch coding. At the same time, consumer goods manufacturer initiatives are increasing demand for cost-effective printing systems that comply with labeling standards and enhance product visibility.
Market Challenges: Substrate variety requirements and production speed limitations may constrain deployment flexibility in ultra-high-speed operations or challenging surface scenarios.
Application dynamics include:
Growth Accelerators: Manufacturing digitalization drives primary adoption as industrial printing systems provide exceptional identification capabilities that enable production traceability without manual intervention, supporting quality assurance achievement and regulatory compliance that require automated marking formats. Supply chain modernization accelerates market growth as distribution facilities seek coding solutions that maintain product visibility during logistics while enhancing inventory accuracy through verified identification design. Regulatory stringency increases worldwide, creating demand for validated printing systems that complement traceability requirements and provide competitive advantages in brand protection.
Growth Inhibitors: Substrate compatibility challenges differ across material types regarding ink adhesion and durability maintenance, which may limit market penetration and performance reliability in non-porous categories with demanding industrial requirements. Equipment cost burden persists regarding high-speed systems and specialized print head replacement that may increase total ownership expenses in small-scale operations with tight budget specifications. Market fragmentation across multiple technology platforms and application formats creates standardization concerns between different manufacturers and existing production infrastructure.
Market Evolution Patterns: Adoption accelerates in packaging and automotive sectors where production efficiency justifies equipment investments, with geographic concentration in developed markets transitioning toward mainstream adoption in emerging economies driven by manufacturing expansion and export quality improvement. Technology development focuses on enhanced print speed optimization, improved ink formulation systems, and integration with automated production platforms that optimize operational efficiency and marking consistency. The market could face disruption if alternative identification technologies or digital marking innovations significantly challenge inkjet printing advantages in industrial applications.
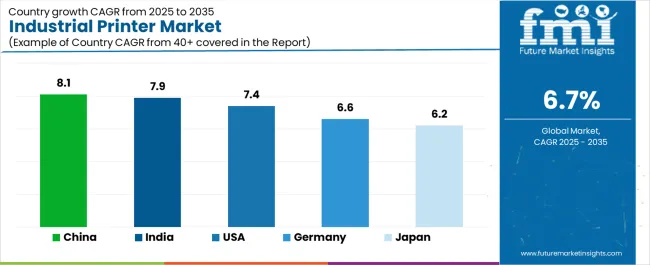
The industrial printer market demonstrates varied regional dynamics with Growth Leaders including China (8.1% CAGR) and India (7.9% CAGR) driving expansion through manufacturing growth and export production modernization. Steady Performers encompass the U.S. (7.4% CAGR), Germany (6.6% CAGR), and Japan (6.2% CAGR), benefiting from established industrial sectors and automation innovation.
| Country | CAGR (2025-2035) |
|---|---|
| China | 8.1% |
| India | 7.9% |
| U.S. | 7.4% |
| Germany | 6.6% |
| Japan | 6.2% |
Regional synthesis reveals Asia-Pacific markets leading growth through manufacturing production expansion and quality enhancement initiatives, while European countries maintain steady expansion supported by specialized automotive applications and advanced packaging requirements. North American markets show strong growth driven by manufacturing automation and logistics traceability applications.
China establishes regional leadership through explosive industrial production expansion and comprehensive manufacturing infrastructure modernization, integrating advanced printing systems as standard components in packaging and electronics operations. The country's 8.1% CAGR through 2035 reflects manufacturing investment growth promoting domestic production and export market activity that mandate the use of validated industrial printing systems in production operations. Growth concentrates in major industrial hubs, including Guangdong, Zhejiang, and Jiangsu, where manufacturing facilities showcase integrated digital printing systems that appeal to domestic producers seeking international quality standards and export market compliance.
Chinese manufacturers are developing innovative industrial printing solutions that combine local cost advantages with international technology specifications, including high-speed inkjet systems and advanced coding capabilities.
Strategic Market Indicators:
The Indian market emphasizes packaging applications, including rapid food processing expansion and comprehensive contract manufacturing that increasingly incorporates industrial printing for product coding and traceability applications. The country is projected to show a 7.9% CAGR through 2035, driven by massive manufacturing production activity under government industrialization initiatives and commercial demand for affordable, reliable printing systems. Indian manufacturers prioritize cost-effectiveness with industrial printers delivering production efficiency through economical equipment specifications and straightforward operation capabilities.
Technology deployment channels include major packaging companies, textile manufacturers, and pharmaceutical producers that support high-volume usage for domestic and international markets.
Performance Metrics:
The U.S. market emphasizes advanced industrial printing features, including innovative production line integration and comprehensive manufacturing execution platforms that manage product identification, quality tracing, and regulatory documentation applications through unified printing systems. The country is projected to show a 7.4% CAGR through 2035, driven by automation innovation under smart manufacturing trends and commercial demand for validated, high-performance printing systems. American manufacturers prioritize operational efficiency with industrial printers delivering comprehensive production visibility through advanced connectivity and proven traceability performance.
Technology deployment channels include major food processors, automotive suppliers, and pharmaceutical manufacturers that support custom development for specialized operations.
Performance Metrics:
In Stuttgart, Munich, and Düsseldorf, German manufacturers and packaging companies are implementing advanced industrial printing systems to enhance production capabilities and support quality assurance that aligns with automotive standards and pharmaceutical protocols. The German market demonstrates growth with a 6.6% CAGR through 2035, driven by Industry 4.0 programs and manufacturing investments that emphasize validated printing systems for production and packaging applications. German manufacturing facilities are prioritizing industrial printing systems that provide exceptional marking consistency while maintaining compliance with traceability standards and minimizing production disruption, particularly important in automotive component marking and pharmaceutical packaging operations.
Market expansion benefits from manufacturing excellence programs that mandate automated identification in production specifications, creating demand across Germany's automotive and chemical sectors, where print quality and equipment reliability represent critical requirements.
Strategic Market Indicators:
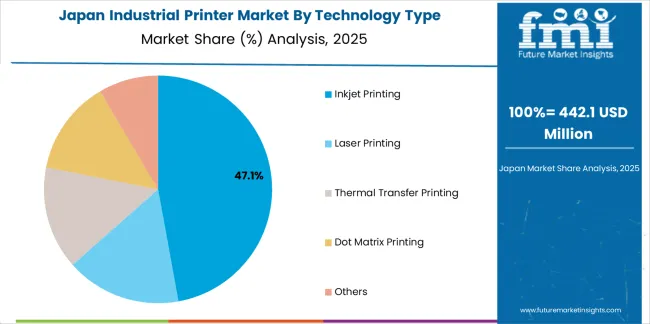
The sophisticated industrial market in Japan demonstrates meticulous printing system deployment, growing at 6.2% CAGR, with documented operational excellence in electronics manufacturing and automotive parts marking applications through integration with existing production systems and quality control infrastructure. The country leverages engineering expertise in precision technology and automation integration to maintain market leadership. Manufacturing centers, including Tokyo, Osaka, and Nagoya, showcase advanced installations where industrial printing systems integrate with comprehensive production platforms and inspection systems to optimize product identification and regulatory compliance.
Japanese manufacturers prioritize print precision and equipment reliability in production development, creating demand for premium industrial printing systems with advanced features, including micro-character capability and integration with robotic assembly protocols. The market benefits from established manufacturing infrastructure and willingness to invest in specialized printing technologies that provide superior marking performance and operational documentation.
Market Intelligence Brief:
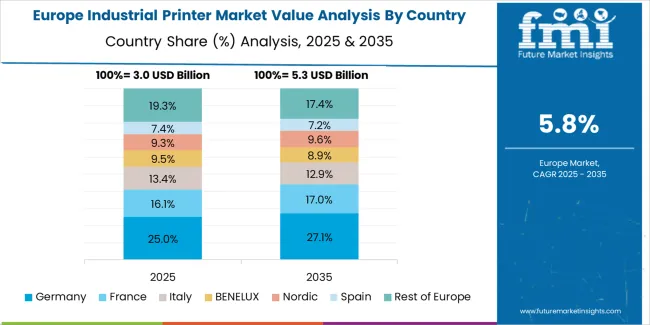
The industrial printer market in Europe is projected to grow from USD 3,421 million in 2025 to USD 5,847 million by 2035, registering a CAGR of 5.5% over the forecast period. Germany is expected to maintain its leadership position with a 38.2% market share in 2025, declining slightly to 37.6% by 2035, supported by its automotive manufacturing excellence and major industrial centers, including Bavaria and North Rhine-Westphalia.
France follows with a 22.7% share in 2025, projected to reach 23.3% by 2035, driven by comprehensive packaging operations and food processing initiatives. The United Kingdom holds a 19.4% share in 2025, expected to maintain 19.8% by 2035 through established pharmaceutical sectors and logistics facility adoption. Italy commands a 11.6% share, while Spain accounts for 5.8% in 2025. The Rest of Europe region is anticipated to gain momentum, expanding its collective share from 2.3% to 2.9% by 2035, attributed to increasing manufacturing activity in Eastern European countries and emerging Nordic production companies implementing automated printing programs.
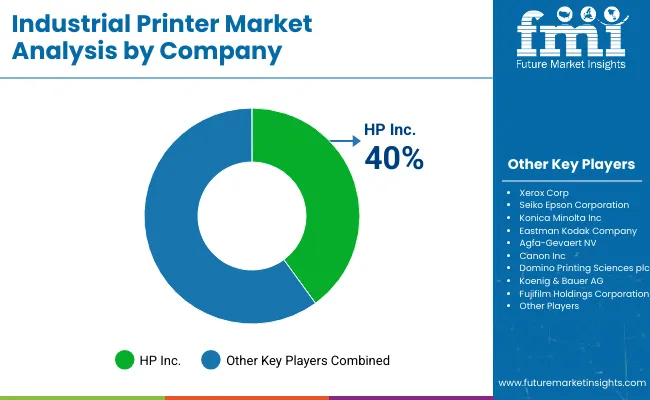
The Industrial Printer Market is moderately concentrated, with roughly 20–30 players competing across inkjet, laser, thermal, and coding-and-marking segments. The market is shaped by high product validation requirements, long replacement cycles, and strong customer dependence on print quality, uptime, and consumable compatibility. The top tier collectively holds an estimated 25–30% share, anchored by companies with deep expertise in print engine design, consumables chemistry, and automated workflow integration.
HP Inc., Epson, and Canon Inc. occupy strong positions through their multi-technology portfolios spanning industrial inkjet, label printing, and wide-format systems. HP benefits from proprietary thermal inkjet platforms and a broad consumables ecosystem, while Epson and Canon leverage piezoelectric inkjet technology and advanced color-management capabilities in packaging, textiles, and signage applications. Xerox Corporation and Ricoh Company retain competitive advantage in production printing through electrophotographic engines, workflow automation, and enterprise print infrastructure, offering high reliability in document-intensive industries.
The industrial coding and marking segment is led by Domino Printing Sciences, Markem-Imaje, and Videojet Technologies, all of which operate with long-standing expertise in continuous inkjet, thermal transfer overprinting, and laser marking. These companies maintain high switching costs due to certified inks, global service networks, and validated performance in regulated sectors such as food, beverage, and pharmaceuticals.
| Item | Value |
|---|---|
| Quantitative Units | USD 12.8 billion |
| Technology Type | Inkjet Printing, Laser Printing, Thermal Transfer Printing, Dot Matrix Printing, Others |
| Application | Packaging & Labeling, Textile Printing, Automotive Parts Marking, Electronics Manufacturing, Pharmaceutical Coding, Others |
| Regions Covered | North America, Europe, Asia Pacific, Latin America, Middle East & Africa |
| Countries Covered | U.S., Germany, Japan, China, India, and 25+ additional countries |
| Key Companies Profiled | HP Inc., Epson, Canon Inc., Xerox Corporation, Ricoh Company, Domino Printing Sciences, Markem-Imaje (Dover Corporation), Videojet Technologies, Brother Industries, Kyocera Corporation |
| Additional Attributes | Dollar sales by technology type and application categories, regional adoption trends across North America, Europe, and Asia-Pacific, competitive landscape with printing equipment companies and technology suppliers, manufacturer preferences for print speed and substrate compatibility, integration with production line systems and automated packaging equipment, innovations in print head technology and ink formulation systems, and development of specialized coding solutions with enhanced connectivity capabilities and validated production integration features |
The global industrial printer market is estimated to be valued at USD 12.8 billion in 2025.
The market size for the industrial printer market is projected to reach USD 24.6 billion by 2035.
The industrial printer market is expected to grow at a 6.7% CAGR between 2025 and 2035.
The key product types in industrial printer market are inkjet printing , laser printing, thermal transfer printing, dot matrix printing and others.
In terms of application, packaging & labeling segment to command 52.0% share in the industrial printer market in 2025.


Our Research Products

The "Full Research Suite" delivers actionable market intel, deep dives on markets or technologies, so clients act faster, cut risk, and unlock growth.

The Leaderboard benchmarks and ranks top vendors, classifying them as Established Leaders, Leading Challengers, or Disruptors & Challengers.

Locates where complements amplify value and substitutes erode it, forecasting net impact by horizon

We deliver granular, decision-grade intel: market sizing, 5-year forecasts, pricing, adoption, usage, revenue, and operational KPIs—plus competitor tracking, regulation, and value chains—across 60 countries broadly.

Spot the shifts before they hit your P&L. We track inflection points, adoption curves, pricing moves, and ecosystem plays to show where demand is heading, why it is changing, and what to do next across high-growth markets and disruptive tech

Real-time reads of user behavior. We track shifting priorities, perceptions of today’s and next-gen services, and provider experience, then pace how fast tech moves from trial to adoption, blending buyer, consumer, and channel inputs with social signals (#WhySwitch, #UX).

Partner with our analyst team to build a custom report designed around your business priorities. From analysing market trends to assessing competitors or crafting bespoke datasets, we tailor insights to your needs.
Supplier Intelligence
Discovery & Profiling
Capacity & Footprint
Performance & Risk
Compliance & Governance
Commercial Readiness
Who Supplies Whom
Scorecards & Shortlists
Playbooks & Docs
Category Intelligence
Definition & Scope
Demand & Use Cases
Cost Drivers
Market Structure
Supply Chain Map
Trade & Policy
Operating Norms
Deliverables
Buyer Intelligence
Account Basics
Spend & Scope
Procurement Model
Vendor Requirements
Terms & Policies
Entry Strategy
Pain Points & Triggers
Outputs
Pricing Analysis
Benchmarks
Trends
Should-Cost
Indexation
Landed Cost
Commercial Terms
Deliverables
Brand Analysis
Positioning & Value Prop
Share & Presence
Customer Evidence
Go-to-Market
Digital & Reputation
Compliance & Trust
KPIs & Gaps
Outputs
Full Research Suite comprises of:
Market outlook & trends analysis
Interviews & case studies
Strategic recommendations
Vendor profiles & capabilities analysis
5-year forecasts
8 regions and 60+ country-level data splits
Market segment data splits
12 months of continuous data updates
DELIVERED AS:
PDF EXCEL ONLINE
Market Share Breakdown of the Industrial Printer Market
Industrial Inkjet Printer Market
Industrial Grade Electrochemical CO Sensor Market Size and Share Forecast Outlook 2025 to 2035
Industrial Bench Scale Market Size and Share Forecast Outlook 2025 to 2035
Industrial Low Profile Floor Scale Market Size and Share Forecast Outlook 2025 to 2035
Industrial Sand Mill Market Size and Share Forecast Outlook 2025 to 2035
Industrial Control Network Modules Market Size and Share Forecast Outlook 2025 to 2035
Industrial Precision Oven Market Size and Share Forecast Outlook 2025 to 2035
Industrial Water Chiller for PCB Market Size and Share Forecast Outlook 2025 to 2035
Industrial & Commercial HVLS Fans Market Size and Share Forecast Outlook 2025 to 2035
Industrial Robot Controller Market Size and Share Forecast Outlook 2025 to 2035
Industrial Wired Routers Market Size and Share Forecast Outlook 2025 to 2035
Industrial Evaporative Condensers Market Size and Share Forecast Outlook 2025 to 2035
Industrial Energy Management System Market Size and Share Forecast Outlook 2025 to 2035
Industrial Insulation Market Size and Share Forecast Outlook 2025 to 2035
Industrial Safety Gloves Market Size and Share Forecast Outlook 2025 to 2035
Industrial Cleaner Market Size and Share Forecast Outlook 2025 to 2035
Industrial Dust Treatment System Market Size and Share Forecast Outlook 2025 to 2035
Industrial Vertical Washing Tower Market Size and Share Forecast Outlook 2025 to 2035
Industrial Pepper Market Size and Share Forecast Outlook 2025 to 2035

Thank you!
You will receive an email from our Business Development Manager. Please be sure to check your SPAM/JUNK folder too.
Chat With
MaRIA