The industrial furnace industry stands at the threshold of a decade-long expansion trajectory that promises to reshape thermal processing technology, sustainable heat treatment solutions, and automated manufacturing applications. The market's journey from USD 10.7 billion in 2025 to USD 17.1 billion by 2035 represents substantial growth, demonstrating the accelerating adoption of advanced furnace configurations and energy-efficient technology across metal production, heat treatment operations, ceramic processing, and specialty manufacturing sectors.
The first half of the decade (2025-2030) will witness the market climbing from USD 10.7 billion to approximately USD 13.6 billion, adding USD 2.9 billion in value, which constitutes 45% of the total forecast growth period. This phase will be characterized by the rapid adoption of electric arc furnace systems, driven by increasing decarbonization requirements and the growing need for high-efficiency thermal processing equipment worldwide. Advanced hydrogen-ready burner capabilities and integrated emission control systems will become standard expectations rather than premium options.
The latter half (2030-2035) will witness sustained growth from USD 13.6 billion to USD 17.1 billion, representing an addition of USD 3.5 billion or 55% of the decade's expansion. This period will be defined by mass market penetration of specialized smart furnace systems, integration with comprehensive manufacturing execution platforms, and seamless compatibility with existing production infrastructure. The market trajectory signals fundamental shifts in how industrial facilities approach thermal efficiency optimization and emission reduction management, with participants positioned to benefit from sustained demand across multiple furnace types and material processing segments.
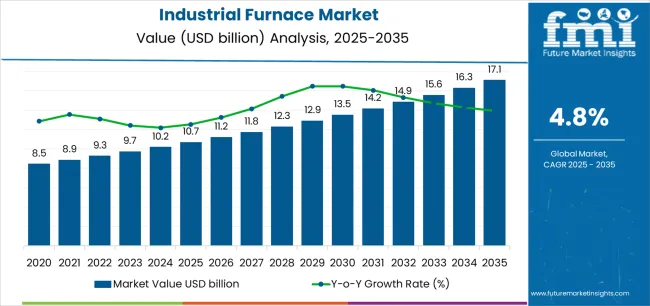
The industrial furnace market demonstrates distinct growth phases with varying market characteristics and competitive dynamics. Between 2025 and 2030, the market progresses through its decarbonization transition phase, expanding from USD 10.7 billion to USD 13.6 billion with steady annual increments averaging 4.8% growth. This period showcases the transition from conventional fossil fuel-fired systems to advanced electric arc furnace configurations with enhanced energy recovery capabilities and integrated emission monitoring systems becoming mainstream features.
The 2025-2030 phase adds USD 2.9 billion to market value, representing 45% of total decade expansion. Market maturation factors include standardization of electric furnace protocols, declining capital costs for induction and arc furnace systems, and increasing industry awareness of energy efficiency benefits reaching 70-75% thermal efficiency in industrial heating applications. Competitive landscape evolution during this period features established furnace manufacturers like Tenova and ANDRITZ expanding their electric furnace portfolios while specialty manufacturers focus on advanced hydrogen-ready burner development and enhanced emission control capabilities.
From 2030 to 2035, market dynamics shift toward advanced automation integration and global manufacturing expansion, with growth continuing from USD 13.6 billion to USD 17.1 billion, adding USD 3.5 billion or 55% of total expansion. This phase transition centers on fully automated thermal processing systems, integration with comprehensive factory digitalization networks, and deployment across diverse material processing and manufacturing scenarios, becoming standard rather than specialized applications.
| Metric | Value |
|---|---|
| Market Value (2025) | USD 10.7 billion |
| Market Forecast (2035) | USD 17.1 billion |
| Growth Rate | 4.8% CAGR |
| Leading Technology | Gas-fired Furnaces |
| Primary Application | Metal Production & Heat Treatment Segment |
The market demonstrates strong fundamentals with gas-fired furnace systems capturing a dominant share through advanced thermal control and operational flexibility capabilities. Metal production and heat treatment applications drive primary demand, supported by increasing steel manufacturing capacity and automotive heat treatment requirements. Geographic expansion remains concentrated in developed manufacturing regions with established industrial infrastructure, while emerging economies show accelerating adoption rates driven by manufacturing capacity expansion and rising energy efficiency standards.
Market expansion rests on three fundamental shifts driving adoption across the metals production, manufacturing, and materials processing sectors. First, decarbonization mandates create compelling operational advantages through advanced electric furnace systems that provide reduced carbon emissions without compromising production capacity, enabling manufacturers to achieve environmental compliance while maintaining thermal processing productivity and reducing operational carbon footprint. Second, manufacturing capacity expansion accelerates as industrial facilities worldwide seek high-efficiency continuous furnace systems that accommodate increased production volumes, enabling process optimization that aligns with Industry 4.0 digitalization and operational efficiency standards.
Third, electric vehicle supply chain development drives adoption from automotive manufacturers and battery materials producers requiring effective heat treatment solutions that enable precision thermal processing while maintaining material quality during component manufacturing and materials synthesis operations. However, growth faces headwinds from capital investment challenges that vary across industrial facilities regarding the procurement of advanced electric arc furnace systems and automation controls, which may limit adoption in price-sensitive manufacturing environments. Energy infrastructure limitations also persist regarding high-capacity electrical supply and grid connection requirements that may reduce effectiveness in regions with constrained power infrastructure and electricity cost volatility, which affect operational economics and furnace deployment.
The industrial furnace market represents a fundamental manufacturing infrastructure opportunity driven by expanding global metals production, thermal processing modernization, and the need for superior energy efficiency in diverse material heating applications. As manufacturers worldwide seek to achieve 70-75% thermal efficiency, reduce emissions by 40-60%, and integrate advanced control systems with real-time process monitoring platforms, industrial furnaces are evolving from basic heating equipment to sophisticated thermal management solutions ensuring production quality and environmental compliance.
The market's growth trajectory from USD 10.7 billion in 2025 to USD 17.1 billion by 2035 at a 4.8% CAGR reflects fundamental shifts in manufacturing sustainability requirements and process efficiency optimization. Geographic expansion opportunities are particularly pronounced in Asia Pacific markets, while the dominance of gas-fired systems (39.8% market share) and metal production applications (55.0% share) provides clear strategic focus areas.
Strengthening the dominant gas-fired furnace segment (39.8% market share) through enhanced natural gas burner configurations (29.0% gas-fired share), superior thermal efficiency, and low-NOx emission systems. This pathway focuses on optimizing combustion control, improving heat recovery capability, extending furnace lifespan to 20-30 year service cycles, and developing hydrogen-ready burner systems for diverse industrial applications. Market leadership consolidation through advanced combustion engineering and emission control integration enables premium positioning while defending competitive advantages against electric alternatives. Expected revenue pool: USD 310-410 million
Rapid steel production and automotive manufacturing growth across Asia Pacific creates substantial expansion opportunities through local furnace fabrication capabilities and technology transfer partnerships. Growing electric arc furnace adoption and government industrial development initiatives drive sustained demand for advanced thermal processing systems. Regional manufacturing strategies reduce equipment costs, enable faster project execution, and position companies advantageously for industrial expansion programs while accessing growing domestic markets. Expected revenue pool: USD 270-355 million
Expansion within the dominant metal production and heat treatment segment (55.0% market share) through specialized furnace systems addressing steel heat treatment standards (41.0% metals share) and heat treatment process requirements (22.0% application share). This pathway encompasses annealing furnaces, carburizing systems, and compatibility with diverse metallurgical processes. Premium positioning reflects superior temperature uniformity and comprehensive process control supporting modern steel production, aluminum processing, and specialty alloy manufacturing. Expected revenue pool: USD 235-310 million
Strategic advancement in electric furnace adoption (36.7% market share) requires enhanced power supply capabilities and specialized electrode systems addressing steelmaking decarbonization requirements. This pathway addresses green steel production, scrap-based manufacturing, and emission-free melting operations with advanced power electronics for demanding continuous operation conditions. Premium pricing reflects environmental leadership and operational flexibility through reduced fossil fuel dependency. Expected revenue pool: USD 205-270 million
Development of specialized continuous operation furnaces (58.1% operation type share) for roller-hearth applications (18.6% continuous share), addressing throughput requirements and process consistency demands. This pathway encompasses belt furnace systems, walking-beam configurations, and automated material handling for high-volume manufacturing environments. Technology differentiation through proprietary atmosphere control enables diversified revenue streams while reducing dependency on batch processing applications. Expected revenue pool: USD 175-230 million
Expansion targeting aluminum heat treatment operations (18.0% metals share) through specialized brazing and solution heat treatment furnaces for automotive lightweighting requirements. This pathway encompasses controlled atmosphere furnaces, vacuum brazing systems, and specialized thermal cycles for aluminum alloy processing. Market development through automotive-specific engineering enables differentiated positioning while accessing growing electric vehicle component markets requiring advanced heat treatment solutions. Expected revenue pool: USD 150-198 million
Development of comprehensive furnace monitoring systems addressing energy optimization and process control requirements across industrial heating installations. This pathway encompasses IoT sensor integration, AI-powered thermal management, and comprehensive manufacturing execution system platforms. Premium positioning reflects operational excellence and total cost of ownership optimization while enabling access to Industry 4.0-focused manufacturers and technology-driven production partnerships. Expected revenue pool: USD 128-168 million
Primary Classification: The market segments by furnace type into Gas-fired, Electric, Oil-fired, and Dual-fuel categories, representing the evolution from conventional combustion systems to advanced electric heating solutions for comprehensive thermal processing optimization.
Secondary Classification: Operation type segmentation divides the market into Continuous and Batch furnaces, reflecting distinct requirements for production throughput, process flexibility, and manufacturing application standards.
Tertiary Classification: Material processed segmentation covers Metals and Non-metals, with steel processing leading adoption while aluminum and specialty alloys show accelerating growth patterns driven by automotive and aerospace programs.
Quaternary Classification: Application segmentation includes Metal Production & Heat Treatment, Ceramics & Glass, Petrochemical/Chemical, and Electronics & Others, with metals applications dominating market demand while ceramics processing maintains specialized presence.
The segmentation structure reveals technology progression from conventional fossil fuel combustion toward advanced electric heating and hydrogen-ready systems with enhanced emission control and process monitoring capabilities, while application diversity spans from steel production to precision ceramics sintering requiring advanced thermal management solutions.
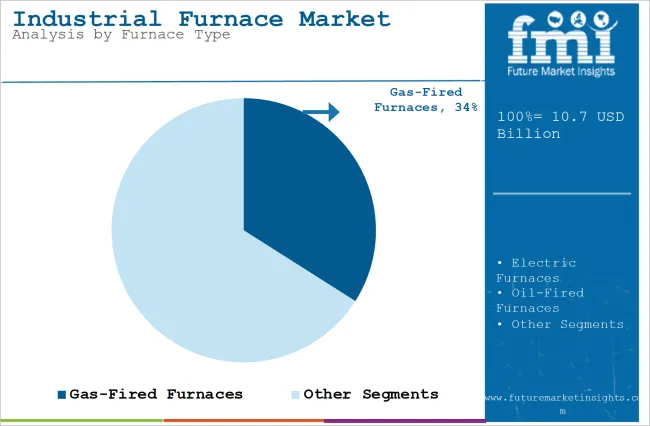
Market Position: Gas-fired furnace systems command the leading position in the Industrial Furnace market with approximately 39.8% market share through advanced combustion control, including superior fuel flexibility, established infrastructure compatibility, and operational cost-effectiveness that enable manufacturers to achieve optimal thermal processing across diverse industrial heating environments.
Value Drivers: The segment benefits from industrial operator preference for proven combustion systems that provide reliable thermal performance, reduced capital investment compared to electric alternatives, and fuel availability optimization without requiring extensive electrical infrastructure upgrades. Advanced burner features enable low-NOx emission control, hydrogen fuel blending capability, and integration with existing gas distribution infrastructure, where combustion efficiency and operational flexibility represent critical production requirements.
Competitive Advantages: Gas-fired furnace systems differentiate through proven operational track record, optimal fuel cost-to-performance ratios, and integration with natural gas supply infrastructure (29.0% gas-fired share) that enhance deployment effectiveness while maintaining equipment costs suitable for diverse industrial applications and facility budgets.
Key market characteristics:
Electric furnace systems maintain substantial market presence (36.7% share) through arc, induction, and resistance heating technologies offering emission-free operation and precise temperature control. Oil-fired systems capture specialized portions (15.2% share) supporting heavy industrial applications, while dual-fuel configurations (8.3% share) provide operational flexibility across fuel availability scenarios.
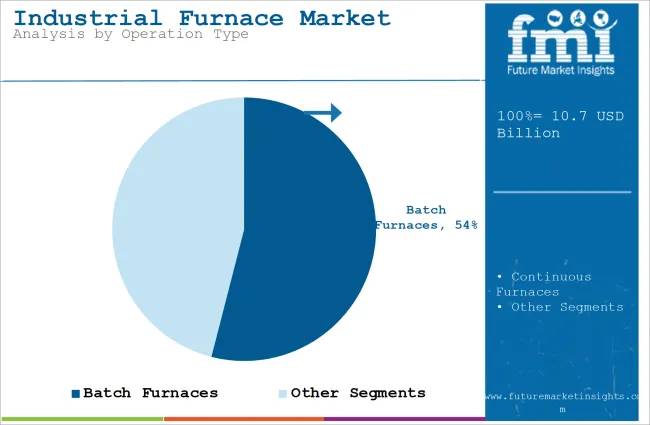
Market Context: Continuous furnace operations dominate the industrial furnace market with approximately 58.1% market share due to widespread adoption in high-volume manufacturing and increasing focus on production throughput optimization, consistent material processing, and automated manufacturing applications that maximize operational efficiency while maintaining process quality standards.
Appeal Factors: Manufacturing facilities prioritize continuous material flow, automated handling integration, and steady-state thermal conditions that enable coordinated production operations across extended operating periods. The segment benefits from substantial automotive manufacturing investment and steel production capacity programs that emphasize the acquisition of roller-hearth systems (18.6% continuous share), belt furnace configurations (16.1% share), and pusher/walking-beam designs (13.4% share) for high-volume component processing.
Growth Drivers: Automotive production expansion programs incorporate specialized continuous heat treatment furnaces as essential equipment for component hardening operations, while steel manufacturing growth increases demand for continuous reheating and annealing capabilities that comply with production rate standards and optimize material throughput.
Market Challenges: High capital requirements and dedicated production line integration may limit deployment flexibility in multi-product manufacturing scenarios.
Application dynamics include:
Batch furnace operations maintain significant market presence (41.9% share) through job shop heat treatment, specialty alloy processing, and low-volume production applications requiring process flexibility and diverse thermal cycle capabilities for custom manufacturing requirements.
Market Context: Metal production and heat treatment applications dominate the industrial furnace market with approximately 55.0% market share due to widespread adoption in steel industry operations and increasing focus on component hardening processes, smelting operations, and refining applications that maximize metallurgical quality while maintaining production efficiency standards.
Appeal Factors: Metals manufacturers prioritize process reliability, temperature precision, and integration with existing production workflows that enable coordinated manufacturing across melting, forming, and finishing operations. The segment benefits from substantial heat treatment service industry investment and captive processing operations emphasizing heat treatment processes (22.0% application share), smelting furnaces (18.0% share), and refining systems (15.0% share) for modern metals production.
Growth Drivers: Automotive heat treatment demand programs incorporate specialized carburizing and tempering furnaces as essential equipment for drivetrain component production, while powder metallurgy growth (6.0% application share) increases demand for sintering furnace capabilities that comply with PM component density standards and optimize material utilization.
Market Challenges: Process certification requirements and metallurgical testing may extend qualification timelines for new furnace installations.
Application dynamics include:
Ceramics and glass processing maintains substantial presence (19.0% share) through sintering furnaces, glass melting tanks, and specialty ceramic manufacturing. Petrochemical and chemical industries capture significant portions (14.0% share) requiring process heaters and catalyst regeneration systems. Electronics and other applications (12.0% share) support semiconductor processing and specialty material production requiring precision thermal environments.
Growth Accelerators: Manufacturing decarbonization mandates drive primary adoption as electric arc furnaces provide emission reduction capabilities that enable steel producers to achieve net-zero commitments without compromising production capacity, supporting climate action requirements and corporate sustainability missions that demand low-carbon thermal processing applications. Automotive industry electrification demand accelerates market expansion as manufacturers seek advanced heat treatment systems that accommodate aluminum component processing while maintaining material properties during battery tray fabrication and electric motor housing production operations. Steel industry modernization spending increases worldwide, creating sustained demand for electric arc furnace systems that complement scrap-based steelmaking processes and provide operational flexibility in diverse manufacturing environments.
Growth Inhibitors: Capital intensity challenges vary across industrial facilities regarding the procurement of electric arc furnace systems and advanced automation controls, which may limit project feasibility and market penetration in regions with constrained capital budgets or commodity price-sensitive manufacturing sectors. Electrical infrastructure limitations persist regarding high-voltage power supply, transformer capacity, and grid connection requirements that may reduce deployment effectiveness in regions with inadequate electrical networks, power quality concerns, or electricity cost disadvantages, affecting operational economics and furnace adoption. Technical workforce availability across skilled furnace operators and maintenance personnel creates capability concerns between different manufacturing regions and existing facility expertise.
Market Evolution Patterns: Adoption accelerates in large-scale steel production and automotive manufacturing where emission reduction requirements justify electric furnace investments, with geographic concentration in developed manufacturing regions transitioning toward mainstream adoption in emerging economies driven by capacity expansion programs and environmental regulation implementation. Technology development focuses on hydrogen-ready burner systems, improved thermal efficiency, and integration with manufacturing execution platforms that optimize energy consumption and process control. The market could face disruption if alternative materials processing methods or breakthrough heating technologies significantly reduce the need for conventional furnace infrastructure in manufacturing applications, though the industry's fundamental requirement for controlled thermal processing continues to make industrial furnaces irreplaceable in metals production and materials processing.
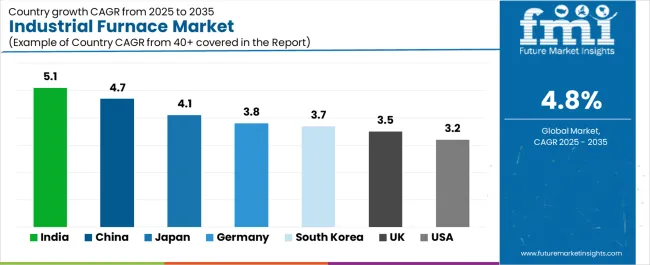
The industrial furnace market demonstrates varied regional dynamics with Growth Leaders including India (5.1% CAGR) and China (4.7% CAGR) driving expansion through steel capacity additions and manufacturing infrastructure programs. Strong Performers encompass Japan (4.1% CAGR), Germany (3.8% CAGR), and South Korea (3.7% CAGR), benefiting from established manufacturing industries and advanced thermal processing technology adoption. Steady Markets feature the United Kingdom (3.5% CAGR) and the United States (3.2% CAGR), where decarbonization initiatives and manufacturing re-shoring support consistent growth patterns.
| Country | CAGR (2025-2035) |
|---|---|
| India | 5.1% |
| China | 4.7% |
| Japan | 4.1% |
| Germany | 3.8% |
| South Korea | 3.7% |
| United Kingdom | 3.5% |
| United States | 3.2% |
Regional synthesis reveals Asia Pacific markets leading adoption through manufacturing capacity expansion and steel production infrastructure development, while European countries maintain strong growth supported by green steel initiatives and automotive lightweighting programs. North American markets show moderate expansion driven by supply chain re-shoring and efficiency retrofit trends.
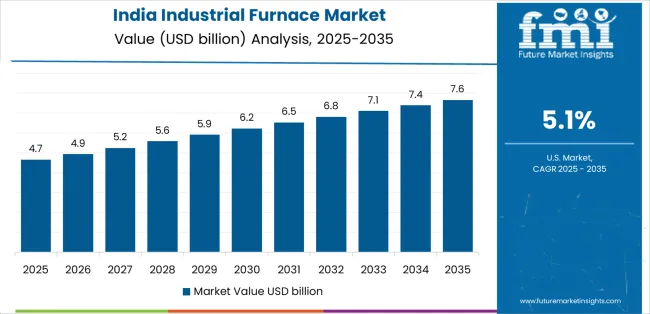
In the industrial furnace market, India leads growth momentum with a 5.1% CAGR, driven by automotive and steel capacity additions including forging operations and heat treatment facilities, solar and wind supply-chain processing line development, and energy-efficiency retrofits in state-owned and public sector metals operations across major industrial states including Maharashtra, Gujarat, Tamil Nadu, and Karnataka. Steel industry expansion through integrated mills and electric arc furnace installations drive primary furnace demand, while growing automotive component manufacturing supports heat treatment furnace procurement. Government infrastructure investment through National Steel Policy targets, Production Linked Incentive schemes for manufacturing, and energy efficiency programs support sustained expansion.
The convergence of manufacturing capacity growth, renewable energy equipment production through domestic manufacturing policies, and industrial efficiency modernization replacing aging thermal processing equipment positions India as a key growth market for industrial furnaces. Automotive forging and heat treatment operations accelerate continuous furnace adoption, while state enterprise modernization programs drive replacement of inefficient batch systems with advanced continuous configurations.
Performance Metrics:
The industrial furnace market in China emphasizes extensive steel production capacity with documented operational effectiveness in electric arc furnace transition and integrated manufacturing facilities through integration with domestic equipment capabilities and industrial infrastructure. The country leverages manufacturing expertise in furnace production and automation technology to maintain substantial market presence at 4.7% CAGR. Industrial regions including Hebei, Jiangsu, Shandong, and Liaoning showcase large-scale installations where industrial furnaces integrate with comprehensive steel production platforms and smart factory systems to optimize thermal efficiency and emission control. Chinese steel producers prioritize electric arc furnace deployment and domestic manufacturing capabilities, creating demand for locally produced systems with competitive pricing meeting national emission standards. The market benefits from government support for industrial upgrading through 14th Five-Year Plan provisions, carbon peak programs, and NOx emission limits driving new burner and control system installations.
State-owned steel enterprises drive substantial equipment procurement through centralized purchasing programs, while smart factory initiatives require comprehensive furnace automation. Environmental regulations promoting emission reduction and energy efficiency create additional demand for advanced low-NOx burner systems and electric furnace installations.
Market Intelligence Brief:
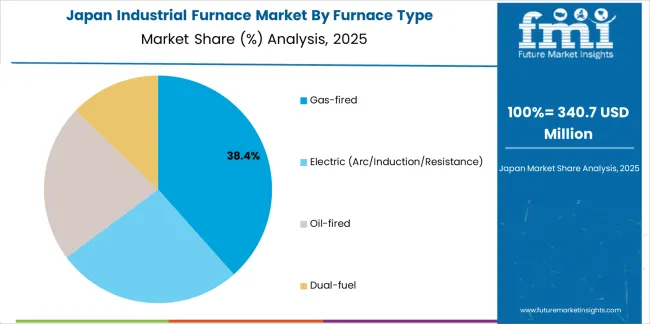
The industrial furnace market in Japan demonstrates deployment with documented operational effectiveness in precision ceramics processing, electronics component sintering, and specialty metals heat treatment through integration with quality control systems and process monitoring infrastructure. The country leverages engineering expertise in thermal processing technology and materials science to maintain strong growth at 4.1% CAGR. Manufacturing regions including Kanto, Chubu, and Kinki showcase premium installations where industrial furnaces integrate with comprehensive production management platforms and automated quality verification systems to optimize process consistency and material properties. Japanese manufacturers prioritize precision temperature control, atmosphere management capability, and environmental compliance, creating demand for high-specification furnaces with advanced features including vacuum processing capability and rapid thermal cycling.
Precision ceramics production for electronics applications and specialty metals processing drive sustained demand, while aging industrial equipment replacement programs address legacy batch furnace systems with modern high-efficiency continuous and vacuum configurations. Advanced materials manufacturing including semiconductor processing equipment creates opportunities for specialized controlled-atmosphere furnace systems.
Strategic Market Indicators:
The industrial furnace market in Germany demonstrates strong growth at 3.8% CAGR through green steel pilot projects utilizing hydrogen and electric arc furnace technology, and automotive lightweighting programs requiring aluminum heat treatment and brazing systems. Major steel producers including ThyssenKrupp and Salzgitter develop hydrogen-based direct reduction and electric arc furnace installations addressing decarbonization mandates. Automotive manufacturers require specialized aluminum heat treatment furnaces for body panel processing and structural component manufacturing supporting vehicle weight reduction.
Green steel technology development including hydrogen-ready reheating furnaces and electric arc furnace installations drives substantial equipment investment for emission reduction programs. Automotive lightweighting initiatives create additional demand for aluminum brazing furnaces and solution heat treatment systems for multi-material body construction.
Performance Metrics:
The industrial furnace market in South Korea maintains strong growth at 3.7% CAGR through battery and electric vehicle cathode-anode material processing furnaces, and steel industry electric arc furnace capacity additions supporting production modernization. Battery materials manufacturers including cathode active material producers require specialized sintering and calcination furnaces for lithium-ion battery production. Steelmakers add electric arc furnace capacity addressing scrap-based production and emission reduction requirements.
Battery supply chain development including cathode material calcination and anode graphitization drives specialized furnace demand for controlled-atmosphere thermal processing. Steel industry modernization incorporating electric arc furnace technology creates additional market opportunities for large-capacity melting systems.
Market Characteristics:
The industrial furnace market in UK emphasizes net-zero driven electric arc furnace transitions, aerospace heat treatment applications, and specialty metals processing at 3.5% CAGR. Steel industry decarbonization programs including British Steel's planned electric arc furnace installations at Scunthorpe and Teesside address government emission reduction mandates. Aerospace manufacturers require precision heat treatment and brazing furnaces for turbine component processing and structural assembly operations.
Steel sector transformation incorporating large-capacity electric arc furnace systems replacing conventional blast furnace-basic oxygen furnace routes drives substantial equipment investment. Aerospace and specialty metals processing maintains steady demand for vacuum heat treatment and controlled-atmosphere brazing systems.
Performance Metrics:
The industrial furnace market in USA emphasizes advanced industrial furnace features, including comprehensive process control and integration with manufacturing execution platforms that manage thermal cycles, atmosphere composition, and quality verification through unified production systems. The country demonstrates moderate growth at 3.2% CAGR driven by manufacturing re-shoring of metals and electric vehicle supply chains, and efficiency retrofits across legacy batch furnace fleets supporting modernization programs. American manufacturers prioritize operational efficiency with industrial furnaces delivering reliable performance through advanced control systems and comprehensive energy management capabilities. Equipment deployment channels include heat treatment service providers, integrated manufacturers, and specialty processors that support thermal processing for complex automotive and aerospace applications.
Electric vehicle supply chain development including battery materials processing and aluminum component heat treatment drives emerging furnace demand. Legacy batch furnace replacement programs address energy efficiency improvements and emission reduction requirements at established heat treatment facilities.
Strategic Development Indicators:
The industrial furnace market in South Africa demonstrates specialized growth at 2.8% CAGR through mining-linked industrial expansion, minerals processing capacity development, and energy-efficient smelting technology adoption supporting ferrochrome, platinum group metals, and steel production operations. The country leverages abundant mineral resources with industrial furnace requirements spanning large electric arc furnaces for chrome ore smelting, specialized refining systems for precious metals processing, and integrated steel production facilities serving domestic construction demand. South African manufacturers prioritize energy optimization with industrial furnaces delivering cost-effective performance through advanced smelting technologies and comprehensive power management systems supporting mining industry value-addition strategies.
Mining industry expansion including ferrochrome production scaling and platinum group metals processing drives substantial furnace procurement demand. Steel manufacturing modernization programs address capacity optimization and emission compliance requirements at established integrated production facilities.
Strategic Development Indicators:
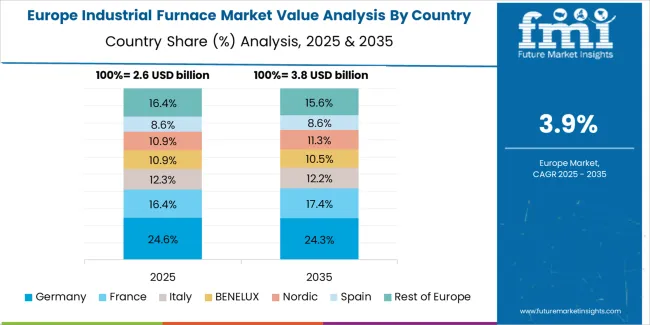
The industrial furnace market in Europe accounts for 29.0% of global industrial furnace revenue in 2025 (USD 3.1 billion) and is projected to maintain approximately 29.0% share by 2035 (USD 5.0 billion), registering a CAGR of approximately 4.9% over the forecast period. Within Europe's regional distribution in 2025, Germany holds approximately 24.0% of European market share (USD 0.7 billion), supported by green steel pilot programs including hydrogen-ready furnace technology and automotive lightweighting requiring aluminum heat treatment and brazing systems across major manufacturing regions.
Italy follows with approximately 15.0% share (USD 0.5 billion), driven by specialty steel heat treatment operations and machinery manufacturing requiring precision thermal processing. The United Kingdom commands approximately 13.0% share (USD 0.4 billion) through steel industry decarbonization programs including planned electric arc furnace installations and aerospace heat treatment applications. France accounts for approximately 12.0% share (USD 0.4 billion), aided by automotive manufacturing heat treatment requirements and specialty alloy processing. Spain holds approximately 8.0% share (USD 0.2 billion) with steel production operations and automotive component manufacturing. The Nordic region represents approximately 8.0% share (USD 0.2 billion) through specialty steel production and precision manufacturing applications. Central and Eastern Europe accounts for approximately 12.0% share (USD 0.4 billion), reflecting steel production capacity and automotive supply chain manufacturing. Rest of Europe collectively represents approximately 8.0% share (USD 0.2 billion) through diversified industrial manufacturing operations.
The industrial furnace market in Japan demonstrates specialized market characteristics focused on precision ceramics and electronics sintering applications and advanced thermal processing quality preferences that emphasize temperature uniformity, atmosphere control precision, and comprehensive process monitoring. The Japanese market focuses on high-specification controlled-atmosphere furnaces for electronics component manufacturing, precision vacuum systems for specialty metals processing, and replacement of aging industrial equipment with modern high-efficiency continuous and vacuum configurations that reflect the country's renowned manufacturing excellence standards. Industrial furnace procurement emphasizes technological sophistication, integration with comprehensive quality management systems, and long-term reliability requirements that align with Japanese production quality expectations. The market benefits from domestic furnace manufacturers maintaining strong engineering capabilities and ongoing capacity expansion supporting both domestic production and export markets.
Market Development Factors:
The industrial furnace market in South Korea demonstrates advanced market characteristics focused on battery materials processing furnaces for cathode and anode production, semiconductor manufacturing thermal processing, and smart factory integration with sophisticated control systems and comprehensive automation features. The Korean market emphasizes lithium-ion battery supply chain equipment, electric vehicle component heat treatment, and precision thermal processing requiring high-specification industrial furnaces with advanced atmosphere control capabilities and real-time monitoring features. Korean manufacturers and industrial facilities prioritize automation integration, digital transformation programs, and process optimization initiatives that reflect the country's leadership in advanced manufacturing and Industry 4.0 adoption. The market benefits from government support for electric vehicle industry development, battery supply chain investment, and manufacturing technology advancement supporting equipment procurement and capability development.
Strategic Development Indicators:
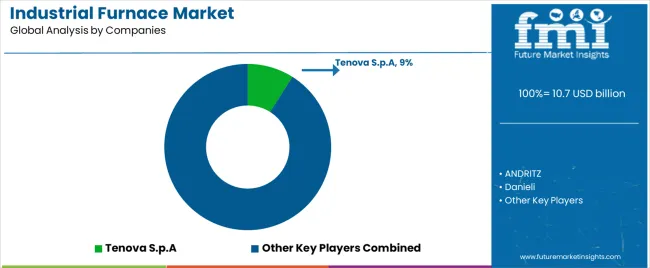
The industrial furnace market operates with moderate concentration, featuring approximately 40-55 meaningful participants, where leading companies control roughly 28-33% of global market share through established engineering relationships and comprehensive technology portfolios. Competition emphasizes thermal efficiency capability, process reliability, and engineering expertise rather than price-based rivalry. Tier 1 companies including Tenova, ANDRITZ, and Danieli collectively command approximately 18-23% market share through comprehensive industrial furnace product lines and extensive global project presence.
Market Leaders encompass Tenova S.p.A, ANDRITZ, and Danieli, which maintain competitive advantages through extensive thermal processing expertise, global engineering networks, and comprehensive project execution capabilities that create customer preference and support premium positioning. Tenova alone holds approximately 9.0% market share through its diverse furnace technology portfolio and steel industry relationships, including introduction of hydrogen-ready furnace technology for steel reheating enabling significant carbon dioxide reductions versus natural gas firing announced in 2024.
Technology Innovators include SECO/WARWICK, Ipsen, and ECM Technologies, which compete through specialized heat treatment and vacuum furnace development appealing to manufacturers seeking advanced thermal processing capabilities. Regional Specialists feature companies with specific geographic presence including Ebner Industrieofenbau and Aichelin Group in Europe, and Inductotherm Group and NUTEC Bickley serving diverse regional markets.
| Item | Value |
|---|---|
| Quantitative Units | USD 10.7 billion |
| Furnace Type | Gas-fired (Natural Gas, LPG/Propane, Mixed/Producer Gas), Electric (Arc/Induction/Resistance), Oil-fired, Dual-fuel |
| Operation Type | Continuous (Roller-hearth, Belt/Mesh-belt, Pusher/Walking-beam, Continuous Vacuum), Batch |
| Material Processed | Metals (Steel, Aluminum, Copper, Other Alloys), Non-metals (Ceramics, Glass, Carbon Composites) |
| Application | Metal Production & Heat Treatment (Heat Treatment, Smelting, Refining, Powder Metallurgy Sintering), Ceramics & Glass, Petrochemical/Chemical, Electronics & Others |
| Regions Covered | Asia Pacific, North America, Europe, Middle East & Africa, Latin America |
| Countries Covered | India, China, Japan, Germany, South Korea, United Kingdom, United States, Italy, France, Spain, and 25+ additional countries |
| Key Companies Profiled | Tenova S.p.A, ANDRITZ, Danieli, SECO/WARWICK, Ipsen, ECM Technologies, Ebner Industrieofenbau, Aichelin Group, Inductotherm Group, NUTEC Bickley |
| Additional Attributes | Dollar sales by furnace type, operation type, material processed, and application categories, regional adoption trends across Asia Pacific, North America, and Europe, competitive landscape with furnace manufacturers and thermal processing specialists, industrial operator preferences for energy efficiency and process reliability, integration with manufacturing execution platforms and automated control systems, innovations in hydrogen-ready burners and electric arc furnace technologies, and development of emission control solutions with enhanced thermal efficiency and decarbonization capabilities. |
The global industrial furnace market is estimated to be valued at USD 10.7 billion in 2025.
The market size for the industrial furnace market is projected to reach USD 17.1 billion by 2035.
The industrial furnace market is expected to grow at a 4.8% CAGR between 2025 and 2035.
The key product types in industrial furnace market are gas-fired, electric (arc/induction/resistance), oil-fired and dual-fuel.
In terms of operation type, continuous segment to command 58.1% share in the industrial furnace market in 2025.


Full Research Suite comprises of:
Market outlook & trends analysis
Interviews & case studies
Strategic recommendations
Vendor profiles & capabilities analysis
5-year forecasts
8 regions and 60+ country-level data splits
Market segment data splits
12 months of continuous data updates
DELIVERED AS:
PDF EXCEL ONLINE
Industrial Furnace Industry Analysis in Europe Forecast and Outlook 2025 to 2035
Industrial High-Temperature Graphitization Furnaces Market Size and Share Forecast Outlook 2025 to 2035
Industrial Evaporative Condensers Market Size and Share Forecast Outlook 2025 to 2035
Industrial Energy Management System Market Size and Share Forecast Outlook 2025 to 2035
Industrial Insulation Market Size and Share Forecast Outlook 2025 to 2035
Industrial Safety Gloves Market Size and Share Forecast Outlook 2025 to 2035
Industrial Cleaner Market Size and Share Forecast Outlook 2025 to 2035
Industrial Dust Treatment System Market Size and Share Forecast Outlook 2025 to 2035
Industrial Vertical Washing Tower Market Size and Share Forecast Outlook 2025 to 2035
Industrial Pepper Market Size and Share Forecast Outlook 2025 to 2035
Industrial Electronics Packaging Market Forecast and Outlook 2025 to 2035
Industrial Absorbent Market Forecast and Outlook 2025 to 2035
Industrial Denox System Market Size and Share Forecast Outlook 2025 to 2035
Industrial Electronic Pressure Switch Market Size and Share Forecast Outlook 2025 to 2035
Industrial WiFi Module Market Size and Share Forecast Outlook 2025 to 2035
Industrial Security System Market Forecast Outlook 2025 to 2035
Industrial Film Market Forecast Outlook 2025 to 2035
Industrial Floor Mat Market Forecast Outlook 2025 to 2035
Industrial Process Water Coolers Market Forecast and Outlook 2025 to 2035
Industrial Grade Ammonium Hydrogen Fluoride Market Forecast and Outlook 2025 to 2035

Thank you!
You will receive an email from our Business Development Manager. Please be sure to check your SPAM/JUNK folder too.
Chat With
MaRIA