Reports

- Global Locations -

Headquarters

Future Market Insights, Inc.

Christiana Corporate, 200
Continental Drive, Suite 401,
Newark, Delaware - 19713,
United States

T: +1-845-579-5705

Americas

Future Market Insights, Inc.

616 Corporate Way, Suite 2-9018,
Valley Cottage, NY 10989, United States

T: +1-347-918-3531

MEA

Future Market Insights

1602-6 Jumeirah Bay X2 Tower, Plot No: JLT-PH2-X2A,
Jumeirah Lakes Towers, Dubai,
United Arab Emirates

Europe

Future Market Insights

3rd Floor, 207 Regent Street,
W1B 3HH London
United Kingdom

T: + 44 (0) 20 8123 9659
D: +44 (0) 20 3287 4268

Asia Pacific

Future Market Insights

IndiaLand Global Tech Park, Unit UG-1, Behind Grand HighStreet, Phase 1, Hinjawadi, MH, Pune – 411057, India

Industrial PC Market Outlook (2022 to 2032)

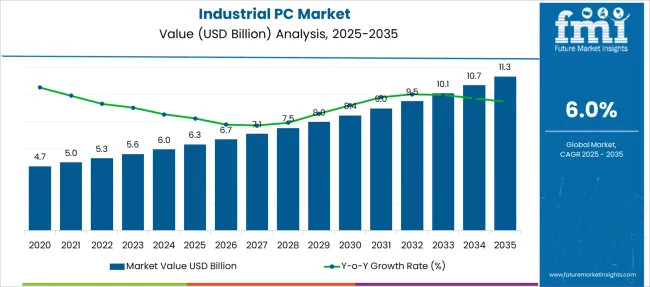
The global industrial PC market size reached US$ 5 Billion in 2021 and is forecast to grow at a healthy CAGR of 6% during the forecast period between 2022 and 2032, surpassing a valuation of US$ 9.4 Billion by the end of 2032. Rising demand for industrial PCs from diverse industries including automotive, oil & gas, electronics, and pharmaceuticals is driving the growth in the global industrial PC market.

Attribute Details
Industrial PC Market Estimated Size in 2021 US$ 5 Billion
Industrial PC Market Projected Size in Market Size (2032) US$ 9.4 Billion
Industrial PC Market Value-based CAGR (2022 to 2032) 6%

Industrial PCs are advanced computers used for numerous industrial purposes such as controlling entire systems, monitoring essential parameters like pressure and temperature, controlling machines, and displaying vital information related to manufactured products. They have become highly sought-after automation tools used in manufacturing industries. These PCs are specially designed to withstand extreme industrial environments.

Over the years, industrial PCs have gained immense traction across various end-use industries as they provide a variety of features required for industrial operations such as high performance, long life, and safety. These industrial PCs are powerful, energy efficient, reliable, and rugged in nature.

The rapid expansion of the manufacturing industry coupled with the increasing adoption of smart manufacturing solutions is a major factor boosting the growth of the industrial PC market and the trend is likely to continue during the forecast period.

Industries like healthcare and retail businesses are increasingly using industrial PC hardware to manage assets and procedures remotely. The adoption of these devices significantly improves efficiency, reduces human intervention, and eliminates the risk of human injuries.

Similarly, the growing adoption of the industrial Internet of Things (IoT) to optimize resources and costs is expected to create opportunities for industrial PC manufacturers during the forecast period.

Don't pay for what you don't need

Customize your report by selecting specific countries or regions and save 30%!

2015 to 2021 Global Industrial PC Market Outlook Compared To 2022 to 2032 Forecast

The global demand for industrial PCs is projected to rise at a robust CAGR of 6% during the forecast period from 2022 to 2032, totaling over US$ 9.4 Billion by 2032. Growth in the industrial PC market is driven by increasing penetration of digitalization, the rise of Industry 4.0, rapid adoption of automation and IoT across manufacturing industries, the growing need for improving overall productivity, and rising awareness about resource optimization in manufacturing firms. and technological advancements in industrial PCs.

Industrial PCs are mostly used for process control and data acquisition applications. They help manufacturing plants be more productive and efficient by planning, controlling, and monitoring operations in real time. They can also be used as remote terminal units (RTIs) and supervisory control and data acquisition (SCADA) systems.

The rising adoption of automation and several other advanced technologies such as artificial intelligence, robotics, and the Internet of Things across industries to increase productivity and reduce human intervention is a major factor providing impetus to the growth of the industrial PC market. The majority of manufacturing industries today use industrial PCs for data acquisition and process control applications. Products like Advantech industrial pcs are gaining wider popularity as they allow manufacturing industries to significantly increase efficiency and productivity.

Similarly, increasing investments in renewable energy projects worldwide are expected to boost industrial PC sales during the forecast period. Industrial PCs help power plants to collect and analyze data and use it to control manufacturing processes. A lot of businesses are gradually setting up industrial mini pcs to meet the growing need for smart manufacturing solutions.

In addition to this, the rapid growth of the global panel industrial PC market and the growing popularity of industrial 3D printing across developed and developing regions will further boost the demand for industrial PCs in the coming years.

What Factors are Restraining the Growth of the Industrial PC Market?

Despite positive growth projections, there are certain obstacles that are limiting the growth of the industrial PC market. Some of the major factors restraining the growth of the industrial PC market include the high cost of advanced industrial PCs and poor penetration of automation across various emerging economies.
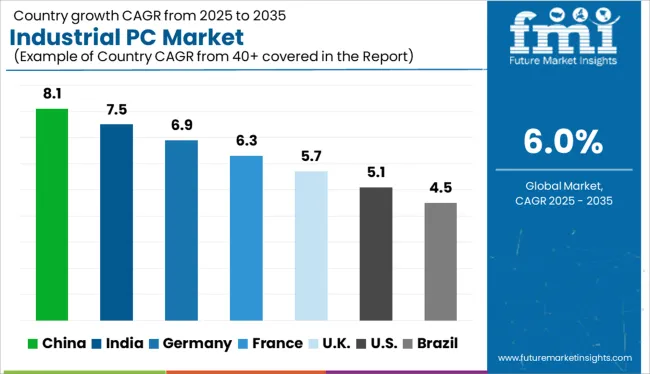
Country-wise Insights

Why is China Considered a Prominent Industrial PC Market?

Booming Manufacturing Sector and Presence of Leading Players Driving Industrial PC Market Growth in China

As per FMI, the industrial PC market in China is expected to grow at the highest CAGR during the forecast period, owing to the rapid penetration of automation across manufacturing industries, favorable government support, the growing popularity of advanced products like Advantech industrial PC, and large base of leading industrial PC manufacturers.

Over the years, a rapid economic boom and increasing government spending have ignited the growth of manufacturing industries across China. According to the World Economic Forum, China accounted for 28.4% of global manufacturing output in 2018. As these manufacturing industries are increasingly embracing modern technologies for improving their productivity and minimizing human intervention, demand for industrial PCs across the country will grow at a significant pace during the forthcoming years.

Similarly, the rapid expansion of the fanless industrial PC market will create opportunities for industrial PC manufacturers across the country in the future.
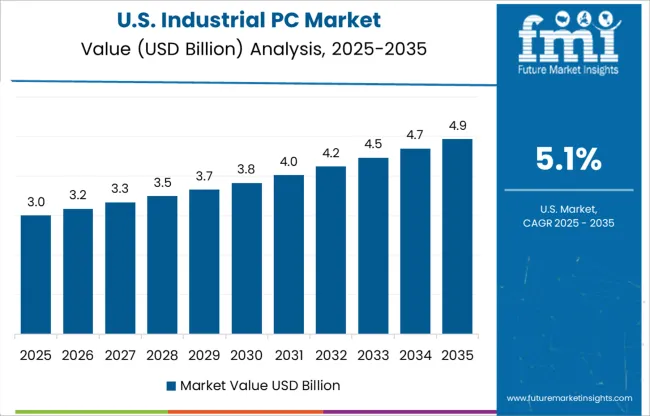
Why is the Demand for Industrial PCs Rising Across the USA?

Rising Penetration of Automation and Other Advanced Technologies Like IoT Creating Space for Industrial PC Market Growth in the USA

With the rising adoption of advanced technologies such as the Internet of Things (IoT) and augmented reality (AR), the booming manufacturing sector, and the availability of advanced products, the USA industrial PC market is poised to exhibit robust growth during the forecast period.

Similarly, increasing government initiatives to encourage the adoption of automation and the booming workstation market will further expand the industrial PC market size in the country during the forthcoming period.
Nikhil Kaitwade
Nikhil Kaitwade

Principal Consultant

Talk to Analyst

Find your sweet spots for generating winning opportunities in this market.

Segment-wise Insights

Which Industrial PC Type Remains High in Demand?

Sales of DIN Rail IPCs to Rise at a Relatively Higher Pace

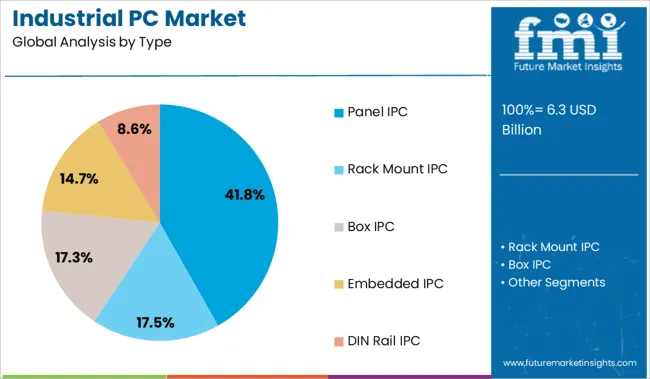
By type, the global industrial PC market is segmented into panel IPC, rack mount IPC, box IPC, embedded IPC, and DIN rail IPC. Among these industrial computer types, the DIN Rail IPC segment is likely to dominate the industrial PC market during the forecast period. This can be attributed to the rising applications of DIN rail IPCs across diverse industries including military, medical services, and traffic.

DIN rail IPCs offer various benefits such as easy installation, compact design, shock resistance, etc. They are often used to serve as communication and visualization gateways for monitoring plan operations, vehicle tracking, agriculture monitoring, and other applications.

Rising demand for connected factory and enterprise networks is expected to further boost the sales of DIN Rail IPCs in the future.

However, the growing popularity of rack mount IPCs for their various advantages is likely to expand the industrial rack mount computer market size during the assessment period.

Which is the Leading End-Use Industry for Industrial Pcs?

Most of the Industrial PC Sales Remain Concentrated in Discrete Industries

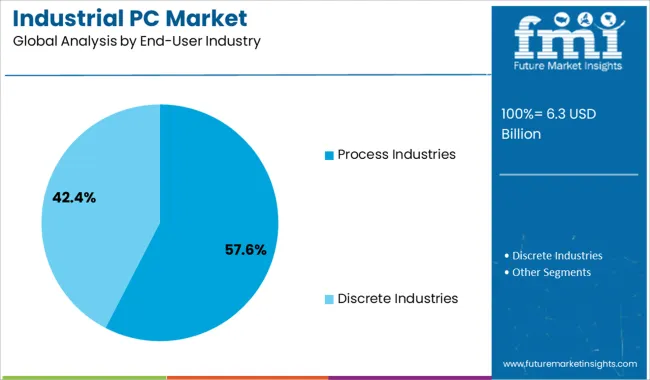
Based on the end-use industry, the global industrial PC market has been segmented into process industries and discrete industries. Among these, the discrete industries segment is poised to exhibit strong growth, owing to the rising adoption of advanced technologies in discrete industries, rising demand for improved process flexibility and enhanced efficiency, and increasing need for reducing operational costs.

Further, the rapid expansion of the factory automation & industrial controls market across developed and developing regions is expected to support the growth of this segment during the forecast period.

Competitive Landscape

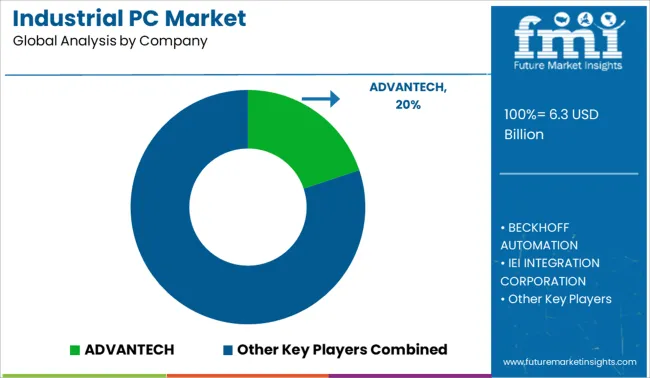
Leading industrial PC manufacturers like Advantech Solutions and IEI Integration Corporation are continuously focusing on developing advanced products that can effectively meet end-user demands. Besides this, they are adopting growth strategies such as partnerships, acquisitions, new product launches, collaborations, etc. to gain a competitive edge in the global industrial PC market. For instance,

  • In November Advantech, a leading industrial computing platform provider, launched its new next-generation TPC industrial panel PCs (TPC-300 series) aimed at machine automation and IoT applications.
  • In January 2020, Onlogic, the global industrial computer hardware manufacturer and IoT provider unveiled rigged industrial computers powered by 12th Gen Intel Alder Lake.

Get the data you need at a Fraction of the cost

Personalize your report by choosing insights you need
and save 40%!

Scope of Report

FMI’s latest study provides a complete packaged solution for the global industrial PC market. It provides compelling insights into the market-shaping factors including growth drivers, restraints, emerging opportunities, consumer demands, etc.

The reports use both primary and secondary research methodologies to identify new opportunities for the development of the industrial PC market. It provides details about emerging industrial PC market trends and leading industrial PC manufacturers.

Besides underscoring the impact of digitalization on the global industrial PC market size, FMI examines how the rising pentation of industrial automation will boost the demand for industrial PCs globally.

The Industrial PC Market analysis includes:

  • A 10-year realistic industrial PC sales forecast across multiple end-user verticals
  • Comprehensive information on demand forecasting and sales prospects across 25 countries
  • Key insights into leading regional pockets and industrial PC types along with their respective shares, growth forecast, and market potential.
  • Top industrial PC manufacturers in the market, and key competitive factors
  • How are top players developing new revenue streams
  • Comprehensive analysis of key market governing factors such as growth drivers, restraints, and emerging opportunities
  • Insights into emerging industrial PC market trends
  • Market Segmentation
  • The winning imperatives in the chromatography software market
  • Supply chain analysis
  • Pricing analysis
Attribute Details
Projected Market Size (2032) US$ 9.4 Billion
Estimated Growth Rate (2022 to 2032) 6%
Forecast Period 2022 to 2032
Historic Data Available for 2015 to 2021
Market Analysis USD Million for Value
Report Coverage Market forecast, company share analysis, competition intelligence, Drivers, Restraints, Opportunities and Threats analysis, market dynamics and challenges, and strategic growth initiatives
Key Segments Covered
  • Type
  • Sales Channel
  • End-Use Industry
  • Region
Key regions covered
  • North America
    • USA
    • Canada
    • Rest of North America
  • Latin America
    • Brazil
    • Argentina
    • Mexico
    • Rest of Latin America
  • Western Europe
    • Germany
    • United Kingdom
    • France
    • Rest of Western Europe
  • Eastern Europe
    • Russia
    • Spain
    • Rest of Eastern Europe
  • South Asia Pacific
    • China
    • India
    • Japan
    • Malaysia
    • Thailand
    • Indonesia
    • South Korea
    • Rest of South Asia &Pacific
  • Middle East & Africa
    • GCC Countries
    • Turkey
    • Israel
    • Rest of the Middle East and Africa(MEA)
  • Rest of the World Oceania
    • Africa
    • South America
End-Use Industry
  • Process Industries
  • Discrete Industries
Key companies profiled Advantech Solutions, Beckhoff Automation, Siemens, IEI Integration Corporation, B&R Automation, Kontron S&T, Avalue Technology, DFI, Nexcom International, American Port well Technology, and others.
Customization & pricing Available upon request

Key Segments

By Type:

  • Panel IPC
  • Rack Mount IPC
  • Box IPC
  • Embedded IPC
  • DIN Rail IPC

By Sales Channel:

  • Direct Sales
  • Indirect Sales

By End-use Industry:

  • Process Industries
  • Discrete Industries

By Region:

  • North America
  • Latin America
  • Europe
  • Asia Pacific
  • Middle East and Africa (MEA)

Frequently Asked Questions

What was the historical size of industrial PC market?

The global industrial PC market was valued at US$ 5 Billion in 2021.

What is the demand outlook for the industrial PC market?

As per FMI, the global industrial PC market is anticipated to grow at 6% CAGR during the forecast period from 2022 to 2032.

What is the projected valuation for industrial PC market?

By 2032, the industrial PC market is projected to reach around US$ 9.4 Billion.

Which region dominates the global industrial PC market?

The Asia Pacific region is expected to lead the global industrial PC market.

Table of Content

1. Executive Summary | Industrial PC Market

    1.1. Global Market Outlook

    1.2. Summary of Statistics

    1.3. Key Market Characteristics & Attributes

    1.4. FMI Analysis and Recommendations

2. Market Overview

    2.1. Market Coverage / Taxonomy

    2.2. Market Definition / Scope / Limitations

3. Market Risks and Trends Assessment

    3.1. Risk Assessment

        3.1.1. COVID-19 Crisis and Impact on Industrial PC

        3.1.2. COVID-19 Impact Benchmark with Previous Crisis

        3.1.3. Impact on Market Value (US$ Million)

        3.1.4. Assessment by Key Countries

        3.1.5. Assessment by Key Market Segments

        3.1.6. Action Points and Recommendation for Suppliers

    3.2. Key Trends Impacting the Market

    3.3. Formulation and Product Development Trends

4. Market Background

    4.1. Market, by Key Countries

    4.2. Market Opportunity Assessment (US$ Million)

        4.2.1. Total Available Market

        4.2.2. Serviceable Addressable Market

        4.2.3. Serviceable Obtainable Market

    4.3. Market Scenario Forecast

        4.3.1. Demand in Optimistic Scenario

        4.3.2. Demand in Likely Scenario

        4.3.3. Demand in Conservative Scenario

    4.4. Investment Feasibility Analysis

        4.4.1. Investment in Established Markets

            4.4.1.1. In Short Term

            4.4.1.2. In Long Term

        4.4.2. Investment in Emerging Markets

            4.4.2.1. In Short Term

            4.4.2.2. In Long Term

    4.5. Forecast Factors - Relevance & Impact

        4.5.1. Top Companies Historical Growth

        4.5.2. Growth in Automation, By Country

        4.5.3. Adoption Rate, By Country

    4.6. Market Dynamics

        4.6.1. Market Driving Factors and Impact Assessment

        4.6.2. Prominent Market Challenges and Impact Assessment

        4.6.3. Market Opportunities

        4.6.4. Prominent Trends in the Global Market & Their Impact Assessment

5. Key Success Factors

    5.1. Manufacturers’ Focus on Low Penetration High Growth Markets

    5.2. Banking on with Segments High Incremental Opportunity

    5.3. Peer Benchmarking

6. Global Market Demand Analysis 2015 to 2021 and Forecast, 2022 to 2032

    6.1. Historical Market Analysis, 2015 to 2021

    6.2. Current and Future Market Projections, 2022 to 2032

    6.3. Y-o-Y Growth Trend Analysis

7. Global Market Value Analysis 2015 to 2021 and Forecast, 2022 to 2032

    7.1. Historical Market Value (US$ Million) Analysis, 2015 to 2021

    7.2. Current and Future Market Value (US$ Million) Projections, 2022 to 2032

        7.2.1. Y-o-Y Growth Trend Analysis

        7.2.2. Absolute $ Opportunity Analysis

8. Global Market Analysis 2015 to 2021 and Forecast 2022 to 2032, By Type

    8.1. Introduction / Key Findings

    8.2. Historical Market Size (US$ Million) Analysis By Type, 2015 to 2021

    8.3. Current and Future Market Size (US$ Million) Analysis and Forecast By Type, 2022 to 2032

        8.3.1. Panel IPC

        8.3.2. Rack Mount IPC

        8.3.3. Box IPC

        8.3.4. Embedded IPC

        8.3.5. DIN Rail IPC

    8.4. Market Attractiveness Analysis By Type

9. Global Market Analysis 2015 to 2021 and Forecast 2022 to 2032, By Sales Channel

    9.1. Introduction / Key Findings

    9.2. Historical Market Size (US$ Million) Analysis By Sales Channel, 2015 to 2021

    9.3. Current and Future Market Size (US$ Million) Analysis and Forecast By Sales Channel, 2022 to 2032

        9.3.1. Direct Sales

        9.3.2. Indirect Sales

    9.4. Market Attractiveness Analysis By Sales Channel

10. Global Market Analysis 2015 to 2021 and Forecast 2022 to 2032, By End-User Industry

    10.1. Introduction / Key Findings

    10.2. Historical Market Size (US$ Million) Analysis By End-User Industry, 2015 to 2021

    10.3. Current and Future Market Size (US$ Million) Analysis and Forecast By End-User Industry, 2022 to 2032

        10.3.1. Process Industries

            10.3.1.1. Chemical

            10.3.1.2. Energy & Power

            10.3.1.3. Oil & Gas

            10.3.1.4. Food & Beverages

            10.3.1.5. Pharmaceutical

            10.3.1.6. Others (Metals and Mining, Pulp and Paper, and Water and Wastewater Treatment)

        10.3.2. Discrete Industries

            10.3.2.1. Automotive

            10.3.2.2. Aerospace & Defense

            10.3.2.3. Semiconductor & Electronics

            10.3.2.4. Medical Devices

    10.4. Market Attractiveness Analysis By End-User Industry

11. Global Market Analysis 2015 to 2021 and Forecast 2022 to 2032, By Region

    11.1. Introduction

    11.2. Historical Market Size (US$ Million) Analysis By Region, 2015 to 2021

    11.3. Current Market Size (US$ Million) & Analysis and Forecast By Region, 2022 to 2032

        11.3.1. North America

        11.3.2. Latin America

        11.3.3. Europe

        11.3.4. Asia Pacific

        11.3.5. Middle East and Africa (MEA)

    11.4. Market Attractiveness Analysis By Region

12. North America Market Analysis 2015 to 2021 and Forecast 2022 to 2032

    12.1. Introduction

    12.2. Pricing Analysis

    12.3. Historical Market Size (US$ Million) Trend Analysis By Market Taxonomy, 2015 to 2021

    12.4. Market Size (US$ Million) & Forecast By Market Taxonomy, 2022 to 2032

        12.4.1. By Country

            12.4.1.1. USA

            12.4.1.2. Canada

            12.4.1.3. Rest of North America

        12.4.2. By Type

        12.4.3. By End-User Industry

        12.4.4. By Sales Channel

    12.5. Market Attractiveness Analysis

        12.5.1. By Country

        12.5.2. By Type

        12.5.3. By End-User Industry

        12.5.4. By Sales Channel

13. Latin America Market Analysis 2015 to 2021 and Forecast 2022 to 2032

    13.1. Introduction

    13.2. Pricing Analysis

    13.3. Historical Market Size (US$ Million) Trend Analysis By Market Taxonomy, 2015 to 2021

    13.4. Market Size (US$ Million) & Forecast By Market Taxonomy, 2022 to 2032

        13.4.1. By Country

            13.4.1.1. Brazil

            13.4.1.2. Mexico

            13.4.1.3. Rest of Latin America

        13.4.2. By Type

        13.4.3. By End-User Industry

        13.4.4. By Sales Channel

    13.5. Market Attractiveness Analysis

        13.5.1. By Country

        13.5.2. By Type

        13.5.3. By End-User Industry

        13.5.4. By Sales Channel

14. Europe Market Analysis 2015 to 2021 and Forecast 2022 to 2032

    14.1. Introduction

    14.2. Pricing Analysis

    14.3. Historical Market Size (US$ Million) Trend Analysis By Market Taxonomy, 2015 to 2021

    14.4. Market Size (US$ Million) & Forecast By Market Taxonomy, 2022 to 2032

        14.4.1. By Country

            14.4.1.1. Germany

            14.4.1.2. France

            14.4.1.3. United Kingdom

            14.4.1.4. Italy

            14.4.1.5. Benelux

            14.4.1.6. Nordic Countries

            14.4.1.7. Rest of Europe

        14.4.2. By Type

        14.4.3. By End-User Industry

        14.4.4. By Sales Channel

    14.5. Market Attractiveness Analysis

        14.5.1. By Country

        14.5.2. By Type

        14.5.3. By End-User Industry

        14.5.4. By Sales Channel

15. Asia Pacific Market Analysis 2015 to 2021 and Forecast 2022 to 2032

    15.1. Introduction

    15.2. Pricing Analysis

    15.3. Historical Market Size (US$ Million) Trend Analysis By Market Taxonomy, 2015 to 2021

    15.4. Market Size (US$ Million) & Forecast By Market Taxonomy, 2022 to 2032

        15.4.1. By Country

            15.4.1.1. China

            15.4.1.2. Japan

            15.4.1.3. South Korea

            15.4.1.4. Rest of Asia Pacific

        15.4.2. By Type

        15.4.3. By End-User Industry

        15.4.4. By Sales Channel

    15.5. Market Attractiveness Analysis

        15.5.1. By Country

        15.5.2. By Type

        15.5.3. By End-User Industry

        15.5.4. By Sales Channel

16. Middle East and Africa Market Analysis 2015 to 2021 and Forecast 2022 to 2032

    16.1. Introduction

    16.2. Pricing Analysis

    16.3. Historical Market Size (US$ Million) Trend Analysis By Market Taxonomy, 2015 to 2021

    16.4. Market Size (US$ Million) & Forecast By Market Taxonomy, 2022 to 2032

        16.4.1. By Country

            16.4.1.1. GCC Countries

            16.4.1.2. South Africa

            16.4.1.3. Turkey

            16.4.1.4. Rest of Middle East and Africa

        16.4.2. By Type

        16.4.3. By End-User Industry

        16.4.4. By Sales Channel

    16.5. Market Attractiveness Analysis

        16.5.1. By Country

        16.5.2. By Type

        16.5.3. By End-User Industry

        16.5.4. By Sales Channel

17. Key Countries Market Analysis 2015 to 2021 and Forecast 2022 to 2032

    17.1. Introduction

        17.1.1. Market Value Proportion Analysis, By Key Countries

        17.1.2. Global Vs. Country Growth Comparison

    17.2. USA Market Analysis

        17.2.1. Value Proportion Analysis by Market Taxonomy

        17.2.2. Value & Analysis and Forecast by Market Taxonomy, 2015 to 2032

            17.2.2.1. By Type

            17.2.2.2. By End-User Industry

            17.2.2.3. By Sales Channel

    17.3. Canada Market Analysis

        17.3.1. Value Proportion Analysis by Market Taxonomy

        17.3.2. Value & Analysis and Forecast by Market Taxonomy, 2015 to 2032

            17.3.2.1. By Type

            17.3.2.2. By End-User Industry

            17.3.2.3. By Sales Channel

    17.4. Mexico Market Analysis

        17.4.1. Value Proportion Analysis by Market Taxonomy

        17.4.2. Value & Analysis and Forecast by Market Taxonomy, 2015 to 2032

            17.4.2.1. By Type

            17.4.2.2. By End-User Industry

            17.4.2.3. By Sales Channel

    17.5. Brazil Market Analysis

        17.5.1. Value Proportion Analysis by Market Taxonomy

        17.5.2. Value & Analysis and Forecast by Market Taxonomy, 2015 to 2032

            17.5.2.1. By Type

            17.5.2.2. By End-User Industry

            17.5.2.3. By Sales Channel

    17.6. Germany Market Analysis

        17.6.1. Value Proportion Analysis by Market Taxonomy

        17.6.2. Value & Analysis and Forecast by Market Taxonomy, 2015 to 2032

            17.6.2.1. By Type

            17.6.2.2. By End-User Industry

            17.6.2.3. By Sales Channel

    17.7. France Market Analysis

        17.7.1. Value Proportion Analysis by Market Taxonomy

        17.7.2. Value & Analysis and Forecast by Market Taxonomy, 2015 to 2032

            17.7.2.1. By Type

            17.7.2.2. By End-User Industry

            17.7.2.3. By Sales Channel

    17.8. Italy Market Analysis

        17.8.1. Value Proportion Analysis by Market Taxonomy

        17.8.2. Value & Analysis and Forecast by Market Taxonomy, 2015 to 2032

            17.8.2.1. By Type

            17.8.2.2. By End-User Industry

            17.8.2.3. By Sales Channel

    17.9. BENELUX Market Analysis

        17.9.1. Value Proportion Analysis by Market Taxonomy

        17.9.2. Value & Analysis and Forecast by Market Taxonomy, 2015 to 2032

            17.9.2.1. By Type

            17.9.2.2. By End-User Industry

            17.9.2.3. By Sales Channel

    17.10. United Kingdom Market Analysis

        17.10.1. Value Proportion Analysis by Market Taxonomy

        17.10.2. Value & Analysis and Forecast by Market Taxonomy, 2015 to 2032

            17.10.2.1. By Type

            17.10.2.2. By End-User Industry

            17.10.2.3. By Sales Channel

    17.11. Nordic Countries Market Analysis

        17.11.1. Value Proportion Analysis by Market Taxonomy

        17.11.2. Value & Analysis and Forecast by Market Taxonomy, 2015 to 2032

            17.11.2.1. By Type

            17.11.2.2. By End-User Industry

            17.11.2.3. By Sales Channel

    17.12. China Market Analysis

        17.12.1. Value Proportion Analysis by Market Taxonomy

        17.12.2. Value & Analysis and Forecast by Market Taxonomy, 2015 to 2032

            17.12.2.1. By Type

            17.12.2.2. By End-User Industry

            17.12.2.3. By Sales Channel

    17.13. Japan Market Analysis

        17.13.1. Value Proportion Analysis by Market Taxonomy

        17.13.2. Value & Analysis and Forecast by Market Taxonomy, 2015 to 2032

            17.13.2.1. By Type

            17.13.2.2. By End-User Industry

            17.13.2.3. By Sales Channel

    17.14. South Korea Market Analysis

        17.14.1. Value Proportion Analysis by Market Taxonomy

        17.14.2. Value & Analysis and Forecast by Market Taxonomy, 2015 to 2032

            17.14.2.1. By Type

            17.14.2.2. By End-User Industry

            17.14.2.3. By Sales Channel

    17.15. GCC Countries Market Analysis

        17.15.1. Value Proportion Analysis by Market Taxonomy

        17.15.2. Value & Analysis and Forecast by Market Taxonomy, 2015 to 2032

            17.15.2.1. By Type

            17.15.2.2. By End-User Industry

            17.15.2.3. By Sales Channel

    17.16. South Africa Market Analysis

        17.16.1. Value Proportion Analysis by Market Taxonomy

        17.16.2. Value & Analysis and Forecast by Market Taxonomy, 2015 to 2032

            17.16.2.1. By Type

            17.16.2.2. By End-User Industry

            17.16.2.3. By Sales Channel

    17.17. Turkey Market Analysis

        17.17.1. Value Proportion Analysis by Market Taxonomy

        17.17.2. Value & Analysis and Forecast by Market Taxonomy, 2015 to 2032

            17.17.2.1. By Type

            17.17.2.2. By End-User Industry

            17.17.2.3. By Sales Channel

        17.17.3. Competition Landscape and Player Concentration in the Country

18. Market Structure Analysis

    18.1. Market Analysis by Tier of Companies

    18.2. Market Concentration

    18.3. Market Share Analysis of Top Players

    18.4. Market Presence Analysis

        18.4.1. By Regional Footprint of Players

        18.4.2. Product Footprint by Players

19. Competition Analysis

    19.1. Competition Dashboard

    19.2. Competition Benchmarking

    19.3. Competition Deep Dive

        19.3.1. ADVANTECH

            19.3.1.1. Overview

            19.3.1.2. Product Portfolio

            19.3.1.3. Sales Footprint

            19.3.1.4. Strategy Overview

        19.3.2. BECKHOFF AUTOMATION

            19.3.2.1. Overview

            19.3.2.2. Product Portfolio

            19.3.2.3. Sales Footprint

            19.3.2.4. Strategy Overview

        19.3.3. IEI INTEGRATION CORPORATION

            19.3.3.1. Overview

            19.3.3.2. Product Portfolio

            19.3.3.3. Sales Footprint

            19.3.3.4. Strategy Overview

        19.3.4. SIEMENS

            19.3.4.1. Overview

            19.3.4.2. Product Portfolio

            19.3.4.3. Sales Footprint

            19.3.4.4. Strategy Overview

        19.3.5. B&R AUTOMATION

            19.3.5.1. Overview

            19.3.5.2. Product Portfolio

            19.3.5.3. Sales Footprint

            19.3.5.4. Strategy Overview

        19.3.6. KONTRON S&T

            19.3.6.1. Overview

            19.3.6.2. Product Portfolio

            19.3.6.3. Sales Footprint

            19.3.6.4. Strategy Overview

        19.3.7. AVALUE TECHNOLOGY

            19.3.7.1. Overview

            19.3.7.2. Product Portfolio

            19.3.7.3. Sales Footprint

            19.3.7.4. Strategy Overview

        19.3.8. DFI

            19.3.8.1. Overview

            19.3.8.2. Product Portfolio

            19.3.8.3. Sales Footprint

            19.3.8.4. Strategy Overview

        19.3.9. NEXCOM INTERNATIONAL

            19.3.9.1. Overview

            19.3.9.2. Product Portfolio

            19.3.9.3. Sales Footprint

            19.3.9.4. Strategy Overview

        19.3.10. AMERICAN PORTWELL TECHNOLOGY

            19.3.10.1. Overview

            19.3.10.2. Product Portfolio

            19.3.10.3. Sales Footprint

            19.3.10.4. Strategy Overview

20. Assumptions and Acronyms Used

21. Research Methodology

Don't pay for what you don't need

Customize your report by selecting specific countries or regions and save 30%!

List of Tables

Table 1: Global Market Value (US$ Million), By Type, 2015 to 2021

Table 2: Global Market Value (US$ Million), By Type, 2022 to 2032

Table 3: Global Market Value (US$ Million), By End-User Industry, 2015 to 2021

Table 4: Global Market Value (US$ Million), By End-User Industry, 2022 to 2032

Table 5: Global Market Value (US$ Million), By Sales Channel, 2015 to 2021

Table 6: Global Market Value (US$ Million), By Sales Channel, 2022 to 2032

Table 7: Global Market, By Region, 2015 to 2021

Table 8: Global Market, By Region, 2022 to 2032

Table 9: North America Market Value (US$ Million), By Type, 2015 to 2021

Table 10: North America Market Value (US$ Million), By Type, 2022 to 2032

Table 11: North America Market Value (US$ Million), By End-User Industry, 2015 to 2021

Table 12: North America Market Value (US$ Million), By End-User Industry, 2022 to 2032

Table 13: North America Market Value (US$ Million), By Sales Channel, 2015 to 2021

Table 14: North America Market Value (US$ Million), By Sales Channel, 2022 to 2032

Table 15: North America Market, By Country, 2015 to 2021

Table 16: North America Market, By Country, 2022 to 2032

Table 17: Latin America Market Value (US$ Million), By Type, 2015 to 2021

Table 18: Latin America Market Value (US$ Million), By Type, 2022 to 2032

Table 19: Latin America Market Value (US$ Million), By End-User Industry, 2015 to 2021

Table 20: Latin America Market Value (US$ Million), By End-User Industry, 2022 to 2032

Table 21: Latin America Market Value (US$ Million), By Sales Channel, 2015 to 2021

Table 22: Latin America Market Value (US$ Million), By Sales Channel, 2022 to 2032

Table 23: Latin America Market, By Country, 2015 to 2021

Table 24: Latin America Market, By Country, 2022 to 2032

Table 25: Europe Market Value (US$ Million), By Type, 2015 to 2021

Table 26: Europe Market Value (US$ Million), By Type, 2022 to 2032

Table 27: Europe Market Value (US$ Million), By End-User Industry, 2015 to 2021

Table 28: Europe Market Value (US$ Million), By End-User Industry, 2022 to 2032

Table 29: Europe Market Value (US$ Million), By Sales Channel, 2015 to 2021

Table 30: Europe Market Value (US$ Million), By Sales Channel, 2022 to 2032

Table 31: Europe Market, By Country, 2015 to 2021

Table 32: Europe Market, By Country, 2022 to 2032

Table 33: Asia Pacific Market Value (US$ Million), By Type, 2015 to 2021

Table 34: Asia Pacific Market Value (US$ Million), By Type, 2022 to 2032

Table 35: Asia Pacific Market Value (US$ Million), By End-User Industry, 2015 to 2021

Table 36: Asia Pacific Market Value (US$ Million), By End-User Industry, 2022 to 2032

Table 37: Asia Pacific Market Value (US$ Million), By Sales Channel, 2015 to 2021

Table 38: Asia Pacific Market Value (US$ Million), By Sales Channel, 2022 to 2032

Table 39: Asia Pacific Market, By Country, 2015 to 2021

Table 40: Asia Pacific Market, By Country, 2022 to 2032

Table 41: MEA Market Value (US$ Million), By Type, 2015 to 2021

Table 42: MEA Market Value (US$ Million), By Type, 2022 to 2032

Table 43: MEA Market Value (US$ Million), By End-User Industry, 2015 to 2021

Table 44: MEA Market Value (US$ Million), By End-User Industry, 2022 to 2032

Table 45: MEA Market Value (US$ Million), By Sales Channel, 2015 to 2021

Table 46: MEA Market Value (US$ Million), By Sales Channel, 2022 to 2032

Table 47: MEA Market, By Country, 2015 to 2021

Table 48: MEA Market, By Country, 2022 to 2032

Table 49: Global Market Incremental $ Opportunity, By Type, 2015 to 2021

Table 50: Global Market Incremental $ Opportunity, By End-User Industry, 2022 to 2032

Table 51: Global Market Incremental $ Opportunity, By Sales Channel, 2015 to 2021

Table 52: Global Market Incremental $ Opportunity, By Region, 2022 to 2032

Table 53: North America Market Incremental $ Opportunity, By Type, 2015 to 2021

Table 54: North America Market Incremental $ Opportunity, By End-User Industry, 2022 to 2032

Table 55: North America Market Incremental $ Opportunity, By Sales Channel, 2015 to 2021

Table 56: North America Market Incremental $ Opportunity, By Country, 2022 to 2032

Table 57: Latin America Market Incremental $ Opportunity, By Type, 2015 to 2021

Table 58: Latin America Market Incremental $ Opportunity, By End-User Industry, 2022 to 2032

Table 59: Latin America Market Incremental $ Opportunity, By Sales Channel, 2015 to 2021

Table 60: Latin America Market Incremental $ Opportunity, By Country, 2022 to 2032

Table 61: Europe Market Incremental $ Opportunity, By Type, 2015 to 2021

Table 62: Europe Market Incremental $ Opportunity, By End-User Industry, 2022 to 2032

Table 63: Europe Market Incremental $ Opportunity, By Sales Channel, 2015 to 2021

Table 64: Europe Market Incremental $ Opportunity, By Country, 2022 to 2032

Table 65: Asia Pacific Market Incremental $ Opportunity, By Type, 2015 to 2021

Table 66: Asia Pacific Market Incremental $ Opportunity, By End-User Industry, 2022 to 2032

Table 67: Asia Pacific Market Incremental $ Opportunity, By Sales Channel, 2015 to 2021

Table 68: Asia Pacific Market Incremental $ Opportunity, By Country, 2022 to 2032

Table 69: MEA Market Incremental $ Opportunity, By Type, 2015 to 2021

Table 70: MEA Market Incremental $ Opportunity, By End-User Industry, 2022 to 2032

Table 71: MEA Market Incremental $ Opportunity, By Sales Channel, 2015 to 2021

Table 72: MEA Market Incremental $ Opportunity, By Country, 2022 to 2032
Nikhil Kaitwade
Nikhil Kaitwade

Principal Consultant

Talk to Analyst

Find your sweet spots for generating winning opportunities in this market.

List of Charts

Figure 1: Global Market Value (US$ Million) and Year-on-Year Growth, 2015 to 2032

Figure 2: Global Market Absolute $ Historical Gain (2015 to 2021) and Opportunity (2022 to 2032), US$ Million

Figure 3: Global Market Share, By Type, 2022 & 2032

Figure 4: Global Market Y-o-Y Growth Projections, By Type – 2022 to 2032

Figure 5: Global Market Attractiveness Index, By Type – 2022 to 2032

Figure 6: Global Market Share, By End-User Industry, 2022 & 2032

Figure 7: Global Market Y-o-Y Growth Projections, By End-User Industry – 2022 to 2032

Figure 8: Global Market Attractiveness Index, By End-User Industry – 2022 to 2032

Figure 9: Global Market Share, By Sales Channel, 2022 & 2032

Figure 10: Global Market Y-o-Y Growth Projections, By Sales Channel – 2022 to 2032

Figure 11: Global Market Attractiveness Index, By Sales Channel – 2022 to 2032

Figure 12: Global Market Share, By Region, 2022 & 2032

Figure 13: Global Market Y-o-Y Growth Projections, By Region – 2022 to 2032

Figure 14: Global Market Attractiveness Index, By Region – 2022 to 2032

Figure 15: North America Market Value (US$ Million) and Year-on-Year Growth, 2015 to 2032

Figure 16: North America Market Absolute $ Opportunity Historical (2015 to 2021) and Forecast Period (2022 to 2032), US$ Million

Figure 17: North America Market Share, By Type, 2022 & 2032

Figure 18: North America Market Y-o-Y Growth Projections, By Type – 2022 to 2032

Figure 19: North America Market Attractiveness Index, By Type – 2022 to 2032

Figure 20: North America Market Share, By End-User Industry, 2022 & 2032

Figure 21: North America Market Y-o-Y Growth Projections, By End-User Industry – 2022 to 2032

Figure 22: North America Market Attractiveness Index, By End-User Industry – 2022 to 2032

Figure 23: North America Market Share, By Sales Channel, 2022 & 2032

Figure 24: North America Market Y-o-Y Growth Projections, By Sales Channel – 2022 to 2032

Figure 25: North America Market Attractiveness Index, By Sales Channel – 2022 to 2032

Figure 26: North America Market Share, By Country, 2022 & 2032

Figure 27: North America Market Y-o-Y Growth Projections, By Country – 2022 to 2032

Figure 28: North America Market Attractiveness Index, By Country – 2022 to 2032

Figure 29: Latin America Market Value (US$ Million) and Year-on-Year Growth, 2015 to 2032

Figure 30: Latin America Market Absolute $ Opportunity Historical (2015 to 2021) and Forecast Period (2022 to 2032), US$ Million

Figure 31: Latin America Market Share, By Type, 2022 & 2032

Figure 32: Latin America Market Y-o-Y Growth Projections, By Type – 2022 to 2032

Figure 33: Latin America Market Attractiveness Index, By Type – 2022 to 2032

Figure 34: Latin America Market Share, By End-User Industry, 2022 & 2032

Figure 35: Latin America Market Y-o-Y Growth Projections, By End-User Industry – 2022 to 2032

Figure 36: Latin America Market Attractiveness Index, By End-User Industry – 2022 to 2032

Figure 37: Latin America Market Share, By Sales Channel, 2022 & 2032

Figure 38: Latin America Market Y-o-Y Growth Projections, By Sales Channel – 2022 to 2032

Figure 39: Latin America Market Attractiveness Index, By Sales Channel – 2022 to 2032

Figure 40: Latin America Market Share, By Country, 2022 & 2032

Figure 41: Latin America Market Y-o-Y Growth Projections, By Country – 2022 to 2032

Figure 42: Latin America Market Attractiveness Index, By Country – 2022 to 2032

Figure 43: Europe Market Value (US$ Million) and Year-on-Year Growth, 2015 to 2032

Figure 44: Europe Market Absolute $ Opportunity Historical (2015 to 2021) and Forecast Period (2022 to 2032), US$ Million

Figure 45: Europe Market Share, By Type, 2022 & 2032

Figure 46: Europe Market Y-o-Y Growth Projections, By Type – 2022 to 2032

Figure 47: Europe Market Attractiveness Index, By Type – 2022 to 2032

Figure 48: Europe Market Share, By End-User Industry, 2022 & 2032

Figure 49: Europe Market Y-o-Y Growth Projections, By End-User Industry – 2022 to 2032

Figure 50: Europe Market Attractiveness Index, By End-User Industry – 2022 to 2032

Figure 51: Europe Market Share, By Sales Channel, 2022 & 2032

Figure 52: Europe Market Y-o-Y Growth Projections, By Sales Channel – 2022 to 2032

Figure 53: Europe Market Attractiveness Index, By Sales Channel – 2022 to 2032

Figure 54: Europe Market Share, By Country, 2022 & 2032

Figure 55: Europe Market Y-o-Y Growth Projections, By Country – 2022 to 2032

Figure 56: Europe Market Attractiveness Index, By Country – 2022 to 2032

Figure 57: MEA Market Value (US$ Million) and Year-on-Year Growth, 2015 to 2032

Figure 58: MEA Market Absolute $ Opportunity Historical (2015 to 2021) and Forecast Period (2022 to 2032), US$ Million

Figure 59: MEA Market Share, By Type, 2022 & 2032

Figure 60: MEA Market Y-o-Y Growth Projections, By Type – 2022 to 2032

Figure 61: MEA Market Attractiveness Index, By Type – 2022 to 2032

Figure 62: MEA Market Share, By End-User Industry, 2022 & 2032

Figure 63: MEA Market Y-o-Y Growth Projections, By End-User Industry – 2022 to 2032

Figure 64: MEA Market Attractiveness Index, By End-User Industry – 2022 to 2032

Figure 65: MEA Market Share, By Sales Channel, 2022 & 2032

Figure 66: MEA Market Y-o-Y Growth Projections, By Sales Channel – 2022 to 2032

Figure 67: MEA Market Attractiveness Index, By Sales Channel – 2022 to 2032

Figure 68: MEA Market Share, By Country, 2022 & 2032

Figure 69: MEA Market Y-o-Y Growth Projections, By Country – 2022 to 2032

Figure 70: MEA Market Attractiveness Index, By Country – 2022 to 2032

Figure 71: Asia Pacific Market Value (US$ Million) and Year-on-Year Growth, 2015 to 2032

Figure 72: Asia Pacific Market Absolute $ Opportunity Historical (2015 to 2021) and Forecast Period (2022 to 2032), US$ Million

Figure 73: Asia Pacific Market Share, By Type, 2022 & 2032

Figure 74: Asia Pacific Market Y-o-Y Growth Projections, By Type – 2022 to 2032

Figure 75: Asia Pacific Market Attractiveness Index, By Type – 2022 to 2032

Figure 76: Asia Pacific Market Share, By End-User Industry, 2022 & 2032

Figure 77: Asia Pacific Market Y-o-Y Growth Projections, By End-User Industry – 2022 to 2032

Figure 78: Asia Pacific Market Attractiveness Index, By End-User Industry – 2022 to 2032

Figure 79: Asia Pacific Market Share, By Sales Channel, 2022 & 2032

Figure 80: Asia Pacific Market Y-o-Y Growth Projections, By Sales Channel – 2022 to 2032

Figure 81: Asia Pacific Market Attractiveness Index, By Sales Channel – 2022 to 2032

Figure 82: Asia Pacific Market Share, By Country, 2022 & 2032

Figure 83: Asia Pacific Market Y-o-Y Growth Projections, By Country – 2022 to 2032

Figure 84: Asia Pacific Market Attractiveness Index, By Country – 2022 to 2032

Figure 85: USA Market Value (US$ Million) and Forecast, 2022 to 2032

Figure 86: USA Market Share, By Type, 2021

Figure 87: USA Market Share, By End-User Industry, 2021

Figure 88: USA Market Share, By Sales Channel, 2021

Figure 89: Canada Market Value (US$ Million) and Forecast, 2022 to 2032

Figure 90: Canada Market Share, By Type, 2021

Figure 91: Canada Market Share, By End-User Industry, 2021

Figure 92: Canada Market Share, By Sales Channel, 2021

Figure 93: Brazil Market Value (US$ Million) and Forecast, 2022 to 2032

Figure 94: Brazil Market Share, By Type, 2021

Figure 95: Brazil Market Share, By End-User Industry, 2021

Figure 96: Brazil Market Share, By Sales Channel, 2021

Figure 97: Mexico Market Value (US$ Million) and Forecast, 2022 to 2032

Figure 98: Mexico Market Share, By Type, 2021

Figure 99: Mexico Market Share, By End-User Industry, 2021

Figure 100: Mexico Market Share, By Sales Channel, 2021

Figure 101: Germany Market Value (US$ Million) and Forecast, 2022 to 2032

Figure 102: Germany Market Share, By Type, 2021

Figure 103: Germany Market Share, By End-User Industry, 2021

Figure 104: Germany Market Share, By Sales Channel, 2021

Figure 105: UK Market Value (US$ Million) and Forecast, 2022 to 2032

Figure 106: UK Market Share, By Type, 2021

Figure 107: UK Market Share, By End-User Industry, 2021

Figure 108: UK Market Share, By Sales Channel, 2021

Figure 109: France Market Value (US$ Million) and Forecast, 2022 to 2032

Figure 110: France Market Share, By Type, 2021

Figure 111: France Market Share, By End-User Industry, 2021

Figure 112: France Market Share, By Sales Channel, 2021

Figure 113: Italy Market Value (US$ Million) and Forecast, 2022 to 2032

Figure 114: Italy Market Share, By Type, 2021

Figure 115: Italy Market Share, By End-User Industry, 2021

Figure 116: Italy Market Share, By Sales Channel, 2021

Figure 117: BENELUX Market Value (US$ Million) and Forecast, 2022 to 2032

Figure 118: BENELUX Market Share, By Type, 2021

Figure 119: BENELUX Market Share, By End-User Industry, 2021

Figure 120: BENELUX Market Share, By Sales Channel, 2021

Figure 121: Nordic Countries Market Value (US$ Million) and Forecast, 2022 to 2032

Figure 122: Nordic Countries Market Share, By Type, 2021

Figure 123: Nordic Countries Market Share, By End-User Industry, 2021

Figure 124: Nordic Countries Market Share, By Sales Channel, 2021

Figure 125: China Market Value (US$ Million) and Forecast, 2022 to 2032

Figure 126: China Market Share, By Type, 2021

Figure 127: China Market Share, By End-User Industry, 2021

Figure 128: China Market Share, By Sales Channel, 2021

Figure 129: Japan Market Value (US$ Million) and Forecast, 2022 to 2032

Figure 130: Japan Market Share, By Type, 2021

Figure 131: Japan Market Share, By End-User Industry, 2021

Figure 132: Japan Market Share, By Sales Channel, 2021

Figure 133: South Korea Market Value (US$ Million) and Forecast, 2022 to 2032

Figure 134: South Korea Market Share, By Type, 2021

Figure 135: South Korea Market Share, By End-User Industry, 2021

Figure 136: South Korea Market Share, By Sales Channel, 2021

Figure 137: GCC Countries Market Value (US$ Million) and Forecast, 2022 to 2032

Figure 138: GCC Countries Market Share, By Type, 2021

Figure 139: GCC Countries Market Share, By End-User Industry, 2021

Figure 140: GCC Countries Market Share, By Sales Channel, 2021

Figure 141: South Africa Market Value (US$ Million) and Forecast, 2022 to 2032

Figure 142: South Africa Market Share, By Type, 2021

Figure 143: South Africa Market Share, By End-User Industry, 2021

Figure 144: South Africa Market Share, By Sales Channel, 2021

Figure 145: Turkey Market Value (US$ Million) and Forecast, 2022 to 2032

Figure 146: Turkey Market Share, By Type, 2021

Figure 147: Turkey Market Share, By End-User Industry, 2021

Figure 148: Turkey Market Share, By Sales Channel, 2021

Recommendations

Industrial Automation

Industrial Weighing Equipment Market

Published : January 2024

Industrial Automation

Fire Protection Systems for Industrial Cooking Market

Published : July 2023

Industrial Automation

Industrial Wireless Broken Signal Solutions Market

Published : September 2022

Industrial Automation

Asia Pacific Industrial Pumps Market

Published : September 2022

Explore Industrial Automation Insights

View Reports