Methodology

Industrial Energy Management System Market Outlook for 2025 to 2035

The industrial energy management system market is experiencing robust growth driven by increasing energy costs, stringent sustainability regulations, and the rising need for operational efficiency across manufacturing and heavy industries. The current market landscape is defined by accelerated digital transformation, integration of IoT and AI-based analytics, and heightened awareness of carbon footprint reduction. Companies are adopting advanced systems to monitor, control, and optimize energy use across industrial processes.

The future outlook remains promising as industries transition toward smart manufacturing and sustainable production models. Government incentives for energy conservation and carbon neutrality are further accelerating adoption.

Growth rationale is rooted in the ability of energy management systems to deliver real-time insights, reduce operational costs, and enhance compliance with global efficiency standards Continuous innovation in software platforms, cloud connectivity, and predictive analytics is expected to reinforce market expansion and strengthen the strategic importance of energy management systems within industrial operations worldwide.

Quick Stats for Industrial Energy Management System Market

  • Industrial Energy Management System Market Industry Value (2025): USD 37.2 billion
  • Industrial Energy Management System Market Forecast Value (2035): USD 82.6 billion
  • Industrial Energy Management System Market Forecast CAGR: 8.3%
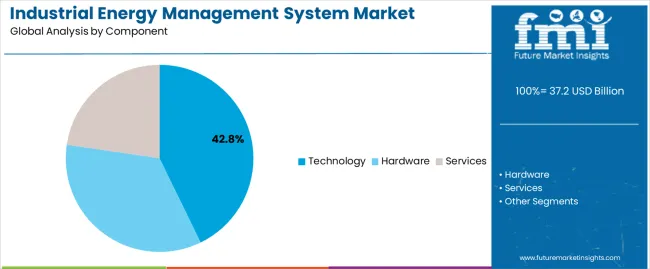
  • Leading Segment in Industrial Energy Management System Market in 2025: Technology (42.8%)
  • Key Growth Region in Industrial Energy Management System Market: North America, Asia-Pacific, Europe
  • Top Key Players in Industrial Energy Management System Market: Schneider Electric SE, Cisco Systems, Inc., Siemens AG, General Electric Co., Emerson Electric Co., ASEA Brown Boveri (ABB) Ltd., Eaton Corporation Plc, EnerNOC, Inc., Honeywell International, Inc., Rockwell Automation, EFT (Energy Inc.), Azbil Corporation, Hatch Ltd, Shanghai Baosight Software Co., Ltd.

Industrial Energy Management System Market Market Value Analysis

Metric Value
Industrial Energy Management System Market Estimated Value in (2025 E) USD 37.2 billion
Industrial Energy Management System Market Forecast Value in (2035 F) USD 82.6 billion
Forecast CAGR (2025 to 2035) 8.3%

Segmental Analysis

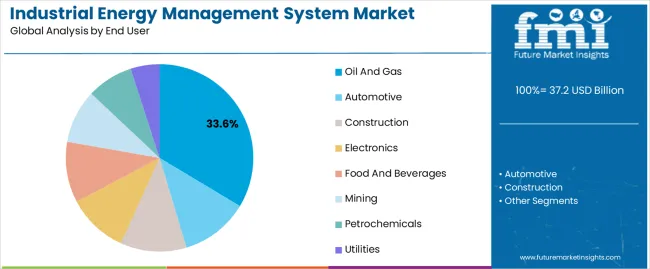
The market is segmented by Component and End User and region. By Component, the market is divided into Technology, Hardware, and Services. In terms of End User, the market is classified into Oil And Gas, Automotive, Construction, Electronics, Food And Beverages, Mining, Petrochemicals, and Utilities. Regionally, the market is classified into North America, Latin America, Western Europe, Eastern Europe, Balkan & Baltic Countries, Russia & Belarus, Central Asia, East Asia, South Asia & Pacific, and the Middle East & Africa.
Insights into the Component Segment

Industrial Energy Management System Market Analysis By Component

The technology segment, accounting for 42.8% of the component category, has emerged as the leading segment due to its critical role in enabling data-driven decision-making and operational optimization. Adoption has been driven by the integration of smart sensors, advanced analytics, and automation platforms that collectively improve energy visibility and performance efficiency.

The segment’s leadership is supported by continuous innovation in digital technologies such as cloud computing, AI, and IoT-based solutions. These advancements have enabled real-time monitoring, predictive maintenance, and demand response capabilities across industrial facilities.

The scalability and interoperability of modern energy management technologies have further strengthened market penetration As industries focus on achieving energy efficiency targets and sustainability goals, the technology segment is expected to maintain its dominance through continuous upgrades and the growing adoption of intelligent, connected systems.
Insights into the End User Segment

Industrial Energy Management System Market Analysis By End User

The oil and gas segment, representing 33.6% of the end-user category, has remained dominant due to its intensive energy consumption and operational complexity. The sector’s leadership is reinforced by the need for precise monitoring and optimization of energy resources across exploration, production, and refining operations.

Adoption of advanced energy management systems has enabled real-time tracking of energy usage, reduction of wastage, and improvement in process reliability. Stringent environmental regulations and the global transition toward cleaner energy have further encouraged oil and gas companies to implement efficient energy control systems.

Investments in digital infrastructure and automation technologies have enhanced transparency and energy accountability across large-scale facilities As the industry continues to prioritize carbon reduction and operational efficiency, the oil and gas segment is expected to sustain its market share and drive significant demand for advanced industrial energy management solutions.

Role of Industrial Energy Management Systems in Cost Reduction Strategies

Operational cost control is essential to maintaining profitability and competitiveness in the corporate environment. Energy costs account for an important share of an industry's operating costs.

The industrial energy management system (IEMS) provides a systematic approach to cost reduction by optimizing energy use, detecting energy inefficiencies, and implementing policies to reduce waste. IEMS helps enterprises find operational and energy savings potential using data analytics, predictive modeling, and real-time monitoring.

The adoption of industrial energy management system is a strategic investment in long-term cost management because reducing energy expenses increases profitability, improves financial performance, and gives businesses a competitive edge.

Attributes Details
Industrial Energy Management System Market Value for 2020 USD 25,462.40 million
Historical Market Value for 2025 USD 32,219.20 million
CAGR from 2020 to 2025 6.1%

Financial Concerns in Industrial Energy Management System Adoption

One of the main obstacles to the adoption of industrial energy management systems is the high initial expenditure needed for execution. Due to financial limitations or concerns about the investment's return, businesses are hesitant to commit resources to acquiring and implementing energy management systems.

Enterprises put energy management activities on hold due to the significant initial expenditures associated with modifications to infrastructure, software, hardware, and consulting services. The perceived financial risk linked to the initial investment prevents the widespread adoption of industrial energy management systems despite the long-term savings on energy costs.

Category-wise Outlook

The preceding section offers the segmented industrial energy management system market analysis. In-depth studies suggests that the hardware segment prevails in the component category and the construction sector stands out in the end user category.

Sustainable Structures Embrace Energy Efficiency in Construction

Top End User Construction Sector
Market Share (2025) 21.20%

The construction sector's increasing focus on green building practices and environmental responsibility aligns with integrating energy-efficient technologies. Large amounts of energy are consumed during construction projects, which makes reliable energy management systems essential for maximizing use.

The industrial energy management systems are a wise investment since increases in construction efficiency directly result in cost savings. Construction firms are compelled to implement advanced energy management techniques due to sustainability objectives and regulatory requirements.

The Strategic Investment in Hardware for Sustainable Energy Management

Top Component Hardware
Market Share (2025) 39.20%

Due to their durability and dependability, hardware components are essential for continuous energy management activities. Hardware purchases guarantee energy management programs' long-term viability and scalability, resulting in financial savings and increased operational effectiveness.

The hardware components provide the physical infrastructure necessary for monitoring and controlling industrial energy management systems. Hardware serves as the framework for data collection, allowing for real-time observations of patterns in energy use.

Country-wise Analysis

The following tables, which emphasize the most prominent economies in Australia, China, the United States, Germany, and Japan, demonstrate the demand for industrial energy management systems. A thorough examination indicates Australia delivers substantial industrial energy management system market opportunities.

Countries CAGR (2025 to 2035)
Australia 11.8%
China 8.8%
United States 5.1%
Germany 3.7%
Japan 3%

Sustainable Practices Propel Adoption of Industrial Energy Management System in Australia

Australia is experiencing a trend toward integrating renewable energy sources into industrial energy management systems due to its abundance of renewable energy supplies.

Government programs that support energy efficiency and reduce emissions stimulate the adoption of industrial energy management systems in Australia. Australia has many industrial sites in remote areas, emphasizing the significance of sophisticated monitoring and control systems in energy management.

Trends in Chinese Industrial Energy Management System Industry

China is leading the way in industrial energy management solution innovation due to the growing use of IoT and AI technology. Due to China's industrial energy management system market size, large-scale energy management system adoption offers abundant opportunities.

Chinese enterprises are supported by rising labor costs and environmental laws to adopt industrial energy management systems to comply with rules and save money.

Tech Advancements Spur Innovation in the United States Industrial Energy Management System

Renewable energy sources are integrated into industrial energy management systems due to the decentralization of energy production in the United States. In the United States, technological innovations like data analytics and cloud computing are improving the functionality of industrial energy management systems.

Industries are investing in energy management systems to optimize energy usage and reduce environmental consequences due to the United States shale gas boom.

Environmental Commitment Boost Industrial Energy Management Systems in Germany

In Germany's manufacturing facilities, the adoption of smart energy management technologies is emphasized by Industry 4.0 principles. Germany is experiencing increased expenditures on energy-efficient technologies and management systems due to its shift away from fossil fuels and nuclear power.

Germany's demand for industrial energy management systems is compelled by its dedication to renewable energy sources and strict environmental laws.

Aging Infrastructure Opportunities Renew Japan's Industrial Energy Management Systems

Modern energy management systems can increase efficiency and dependability in Japan's aged industrial infrastructure. Due to its limited domestic energy supplies, Japan strongly emphasizes energy security, which motivates investments in effective energy management technology.

Japan's industrial energy management market is experiencing a rise in the adoption of innovative techniques, including demand response systems and virtual power plants.
Competitive Analysis

Industrial Energy Management System Market Analysis By Company

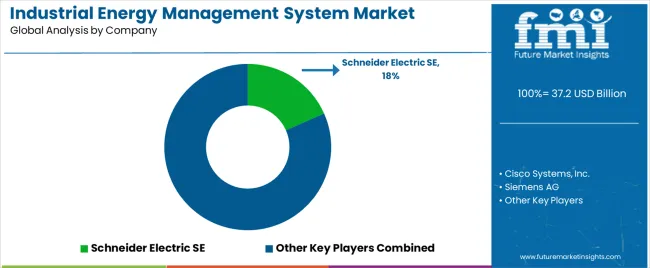
Key industrial energy management system providers strive to gain market share and influence by dependable and innovative. Prominent industrial energy management system providers are well-represented, using their wealth of knowledge and technological know-how to influence the direction of the industry.

Eaton Corporation Plc, EnerNOC, Inc., and ASEA Brown Boveri (ABB) Ltd are the main industrial energy management system vendors influencing the competitive dynamics. The industrial energy management system (IEMS) industry encounters more competition due to their services and solutions for various industrial needs.

Notable industrial energy management system manufacturers include Honeywell International, Inc., Rockwell Automation, and EFT (Energy Inc.), providing cutting-edge energy optimization and management methods. With their combined experience, Hatch Ltd. and Azbil Corporation enhance the IEMS market with advanced collaborations and solutions.

The market is made more dynamic by the engagement of emerging industrial energy management system suppliers like Shanghai Baosight Software Co., Ltd., which encourages innovation and pushes boundaries.

The industrial energy management system solution market is positioned for ongoing expansion and development as long as these sector leaders keep coming up with new ideas and working together. The global industrial sectors' pursuit of efficiency, sustainability, and technical advancements has created a dynamic competitive landscape.

Latest Advancements

Company Details
Schneider Electric Work on Schneider Electric's new smart factory in Dunavesce, Hungary got underway in March 2025. 500 workers are scheduled to work at the 25,000-square-meter new location, which will cost EUR 40 million to build. This new smart factory will boost capacity to meet growing demand as Europe enhances its energy independence and expedites its energy transition.
AutoGrid One of the leading electricity companies in India, Tata Electricity, and AutoGrid announced a new, conventional cooperation in February 2025 to roll out a demand response program for all of their residential, commercial, and industrial customers. This innovative approach is going to promote India's sustainable energy development while helping to satisfy peak demand.
Siemens Energy A new version of Syntax's SAP Digital Manufacturing Cloud (DMC) infrastructure was developed and deployed for over 80 production sites globally in December 2025 because of a partnership between Siemens Energy and the well-known multi-cloud provider for mission-critical applications. Syntax was contracted to manage SAP DMC subscription contracts for five test factories in Mexico, Germany, and the Germany. These sites present Siemens Energy's diverse requirements, while Syntax gathers vital operation data for analysis, process modeling and execution, and resource coordination.
IBM IBM introduced the upcoming version of its LinuxONE server in September 2025. This platform, which is based on Kubernetes and Linux and is favorably scalable, accommodates thousands of workloads inside the footprint of a single strategy. With IBM LinuxONE Emperor 4, customers could run workloads at higher densities and capacities by turning on unused cores without increasing their energy consumption and related greenhouse gas emissions.

Vital Industrial Energy Management System Vendors

  • Cisco Systems, Inc.
  • Siemens AG
  • General Electric Co.
  • Schneider Electric SE
  • Emerson Electric Co.
  • ASEA Brown Boveri (ABB) Ltd.
  • Eaton Corporation Plc
  • EnerNOC, Inc.
  • Honeywell International, Inc.
  • Rockwell Automation
  • EFT (Energy Inc.)
  • Azbil Corporation
  • Hatch Ltd
  • Shanghai Baosight Software Co., Ltd.

Key Coverage in Industrial Energy Management System Market Report

  • Categorical Study on Technology, Hardware, and Services
  • Industrial Energy Management System Market In-depth Overview of Current Scenario with Growth Projections
  • Market Potential of Industrial Energy Management Systems is Australia
  • Revenue Prospects of Industrial Energy Management Systems in China
  • Competition Analysis of Industrial Energy Management System Manufacturers with Focus on Schneider Electric, AutoGrid, and Others.

Key Segments

By Component:

  • Technology
    • Energy Platform
    • Distributed Control System (DCS)
    • Meter Data Management (MDM)
    • Peak Load Control System (PLCS)
    • Programmable Logic Controls (PLC)
    • Energy Analytics
    • Supervisory Control and Data Acquisition (SCADA)
    • Energy Management Information System (EMIS)
  • Hardware
    • Communication Network Hardware
    • Industrial Hardware
      • Smart Meters
      • Heating, Ventilating, and Air Conditioning (HVAC)
      • Load Control Switch (LCS)
      • Transmitters
      • Human Machine Interface (HMI)/Operator Panels
      • Others
  • Services
    • Consulting
    • System Integrators
    • Maintenance and Support Services

By End User:

  • Automotive
  • Construction
  • Electronics
  • Food and Beverages
  • Mining
  • Oil and Gas
  • Petrochemicals
  • Utilities

By Region:

  • North America
  • Latin America
  • Western Europe
  • Eastern Europe
  • South East Asia and Pacific
  • China
  • Japan
  • Middle East and Africa

Frequently Asked Questions

How big is the industrial energy management system market in 2025?

The global industrial energy management system market is estimated to be valued at USD 37.2 billion in 2025.

What will be the size of industrial energy management system market in 2035?

The market size for the industrial energy management system market is projected to reach USD 82.6 billion by 2035.

How much will be the industrial energy management system market growth between 2025 and 2035?

The industrial energy management system market is expected to grow at a 8.3% CAGR between 2025 and 2035.

What are the key product types in the industrial energy management system market?

The key product types in industrial energy management system market are technology, energy platform, distributed control system (dcs), meter data management (mdm), peak load control system (plcs), programmable logic controls (plc), energy analytics, supervisory control and data acquisition (scada), energy management information system (emis), hardware, communication network hardware, industrial hardware, services, consulting, system integrators and maintenance and support services.

Which end user segment to contribute significant share in the industrial energy management system market in 2025?

In terms of end user, oil and gas segment to command 33.6% share in the industrial energy management system market in 2025.

Table of Content

  1. Executive Summary
    • Global Market Outlook
    • Demand to side Trends
    • Supply to side Trends
    • Technology Roadmap Analysis
    • Analysis and Recommendations
  2. Market Overview
    • Market Coverage / Taxonomy
    • Market Definition / Scope / Limitations
  3. Market Background
    • Market Dynamics
      • Drivers
      • Restraints
      • Opportunity
      • Trends
    • Scenario Forecast
      • Demand in Optimistic Scenario
      • Demand in Likely Scenario
      • Demand in Conservative Scenario
    • Opportunity Map Analysis
    • Product Life Cycle Analysis
    • Supply Chain Analysis
    • Investment Feasibility Matrix
    • Value Chain Analysis
    • PESTLE and Porter’s Analysis
    • Regulatory Landscape
    • Regional Parent Market Outlook
    • Production and Consumption Statistics
    • Import and Export Statistics
  4. Global Market Analysis 2020 to 2025 and Forecast, 2025 to 2035
    • Historical Market Size Value (USD Million) Analysis, 2020 to 2025
    • Current and Future Market Size Value (USD Million) Projections, 2025 to 2035
      • Y to o to Y Growth Trend Analysis
      • Absolute $ Opportunity Analysis
  5. Global Market Pricing Analysis 2020 to 2025 and Forecast 2025 to 2035
  6. Global Market Analysis 2020 to 2025 and Forecast 2025 to 2035, By Component
    • Introduction / Key Findings
    • Historical Market Size Value (USD Million) Analysis By Component , 2020 to 2025
    • Current and Future Market Size Value (USD Million) Analysis and Forecast By Component , 2025 to 2035
      • Technology
        • Energy Platform
        • Distributed Control System (DCS)
        • Meter Data Management (MDM)
        • Peak Load Control System (PLCS)
        • Programmable Logic Controls (PLC)
        • Energy Analytics
        • Supervisory Control and Data Acquisition (SCADA)
        • Energy Management Information System (EMIS)
      • Hardware
        • Communication Network Hardware
        • Industrial Hardware
      • Services
        • Consulting
        • System Integrators
        • Maintenance And Support Services
    • Y to o to Y Growth Trend Analysis By Component , 2020 to 2025
    • Absolute $ Opportunity Analysis By Component , 2025 to 2035
  7. Global Market Analysis 2020 to 2025 and Forecast 2025 to 2035, By End User
    • Introduction / Key Findings
    • Historical Market Size Value (USD Million) Analysis By End User, 2020 to 2025
    • Current and Future Market Size Value (USD Million) Analysis and Forecast By End User, 2025 to 2035
      • Oil And Gas
      • Automotive
      • Construction
      • Electronics
      • Food And Beverages
      • Mining
      • Petrochemicals
      • Utilities
    • Y to o to Y Growth Trend Analysis By End User, 2020 to 2025
    • Absolute $ Opportunity Analysis By End User, 2025 to 2035
  8. Global Market Analysis 2020 to 2025 and Forecast 2025 to 2035, By Region
    • Introduction
    • Historical Market Size Value (USD Million) Analysis By Region, 2020 to 2025
    • Current Market Size Value (USD Million) Analysis and Forecast By Region, 2025 to 2035
      • North America
      • Latin America
      • Western Europe
      • Eastern Europe
      • East Asia
      • South Asia and Pacific
      • Middle East & Africa
    • Market Attractiveness Analysis By Region
  9. North America Market Analysis 2020 to 2025 and Forecast 2025 to 2035, By Country
    • Historical Market Size Value (USD Million) Trend Analysis By Market Taxonomy, 2020 to 2025
    • Market Size Value (USD Million) Forecast By Market Taxonomy, 2025 to 2035
      • By Country
        • USA
        • Canada
        • Mexico
      • By Component
      • By End User
    • Market Attractiveness Analysis
      • By Country
      • By Component
      • By End User
    • Key Takeaways
  10. Latin America Market Analysis 2020 to 2025 and Forecast 2025 to 2035, By Country
    • Historical Market Size Value (USD Million) Trend Analysis By Market Taxonomy, 2020 to 2025
    • Market Size Value (USD Million) Forecast By Market Taxonomy, 2025 to 2035
      • By Country
        • Brazil
        • Chile
        • Rest of Latin America
      • By Component
      • By End User
    • Market Attractiveness Analysis
      • By Country
      • By Component
      • By End User
    • Key Takeaways
  11. Western Europe Market Analysis 2020 to 2025 and Forecast 2025 to 2035, By Country
    • Historical Market Size Value (USD Million) Trend Analysis By Market Taxonomy, 2020 to 2025
    • Market Size Value (USD Million) Forecast By Market Taxonomy, 2025 to 2035
      • By Country
        • Germany
        • UK
        • Italy
        • Spain
        • France
        • Nordic
        • BENELUX
        • Rest of Western Europe
      • By Component
      • By End User
    • Market Attractiveness Analysis
      • By Country
      • By Component
      • By End User
    • Key Takeaways
  12. Eastern Europe Market Analysis 2020 to 2025 and Forecast 2025 to 2035, By Country
    • Historical Market Size Value (USD Million) Trend Analysis By Market Taxonomy, 2020 to 2025
    • Market Size Value (USD Million) Forecast By Market Taxonomy, 2025 to 2035
      • By Country
        • Russia
        • Poland
        • Hungary
        • Balkan & Baltic
        • Rest of Eastern Europe
      • By Component
      • By End User
    • Market Attractiveness Analysis
      • By Country
      • By Component
      • By End User
    • Key Takeaways
  13. East Asia Market Analysis 2020 to 2025 and Forecast 2025 to 2035, By Country
    • Historical Market Size Value (USD Million) Trend Analysis By Market Taxonomy, 2020 to 2025
    • Market Size Value (USD Million) Forecast By Market Taxonomy, 2025 to 2035
      • By Country
        • China
        • Japan
        • South Korea
      • By Component
      • By End User
    • Market Attractiveness Analysis
      • By Country
      • By Component
      • By End User
    • Key Takeaways
  14. South Asia and Pacific Market Analysis 2020 to 2025 and Forecast 2025 to 2035, By Country
    • Historical Market Size Value (USD Million) Trend Analysis By Market Taxonomy, 2020 to 2025
    • Market Size Value (USD Million) Forecast By Market Taxonomy, 2025 to 2035
      • By Country
        • India
        • ASEAN
        • Australia & New Zealand
        • Rest of South Asia and Pacific
      • By Component
      • By End User
    • Market Attractiveness Analysis
      • By Country
      • By Component
      • By End User
    • Key Takeaways
  15. Middle East & Africa Market Analysis 2020 to 2025 and Forecast 2025 to 2035, By Country
    • Historical Market Size Value (USD Million) Trend Analysis By Market Taxonomy, 2020 to 2025
    • Market Size Value (USD Million) Forecast By Market Taxonomy, 2025 to 2035
      • By Country
        • Kingdom of Saudi Arabia
        • Other GCC Countries
        • Turkiye
        • South Africa
        • Other African Union
        • Rest of Middle East & Africa
      • By Component
      • By End User
    • Market Attractiveness Analysis
      • By Country
      • By Component
      • By End User
    • Key Takeaways
  16. Key Countries Market Analysis
    • USA
      • Pricing Analysis
      • Market Share Analysis, 2025
        • By Component
        • By End User
    • Canada
      • Pricing Analysis
      • Market Share Analysis, 2025
        • By Component
        • By End User
    • Mexico
      • Pricing Analysis
      • Market Share Analysis, 2025
        • By Component
        • By End User
    • Brazil
      • Pricing Analysis
      • Market Share Analysis, 2025
        • By Component
        • By End User
    • Chile
      • Pricing Analysis
      • Market Share Analysis, 2025
        • By Component
        • By End User
    • Germany
      • Pricing Analysis
      • Market Share Analysis, 2025
        • By Component
        • By End User
    • UK
      • Pricing Analysis
      • Market Share Analysis, 2025
        • By Component
        • By End User
    • Italy
      • Pricing Analysis
      • Market Share Analysis, 2025
        • By Component
        • By End User
    • Spain
      • Pricing Analysis
      • Market Share Analysis, 2025
        • By Component
        • By End User
    • France
      • Pricing Analysis
      • Market Share Analysis, 2025
        • By Component
        • By End User
    • India
      • Pricing Analysis
      • Market Share Analysis, 2025
        • By Component
        • By End User
    • ASEAN
      • Pricing Analysis
      • Market Share Analysis, 2025
        • By Component
        • By End User
    • Australia & New Zealand
      • Pricing Analysis
      • Market Share Analysis, 2025
        • By Component
        • By End User
    • China
      • Pricing Analysis
      • Market Share Analysis, 2025
        • By Component
        • By End User
    • Japan
      • Pricing Analysis
      • Market Share Analysis, 2025
        • By Component
        • By End User
    • South Korea
      • Pricing Analysis
      • Market Share Analysis, 2025
        • By Component
        • By End User
    • Russia
      • Pricing Analysis
      • Market Share Analysis, 2025
        • By Component
        • By End User
    • Poland
      • Pricing Analysis
      • Market Share Analysis, 2025
        • By Component
        • By End User
    • Hungary
      • Pricing Analysis
      • Market Share Analysis, 2025
        • By Component
        • By End User
    • Kingdom of Saudi Arabia
      • Pricing Analysis
      • Market Share Analysis, 2025
        • By Component
        • By End User
    • Turkiye
      • Pricing Analysis
      • Market Share Analysis, 2025
        • By Component
        • By End User
    • South Africa
      • Pricing Analysis
      • Market Share Analysis, 2025
        • By Component
        • By End User
  17. Market Structure Analysis
    • Competition Dashboard
    • Competition Benchmarking
    • Market Share Analysis of Top Players
      • By Regional
      • By Component
      • By End User
  18. Competition Analysis
    • Competition Deep Dive
      • Schneider Electric SE
        • Overview
        • Product Portfolio
        • Profitability by Market Segments (Product/Age /Sales Channel/Region)
        • Sales Footprint
        • Strategy Overview
          • Marketing Strategy
          • Product Strategy
          • Channel Strategy
      • Cisco Systems, Inc.
      • Siemens AG
      • General Electric Co.
      • Emerson Electric Co.
      • ASEA Brown Boveri (ABB) Ltd.
      • Eaton Corporation Plc
      • EnerNOC, Inc.
      • Honeywell International, Inc.
      • Rockwell Automation
      • EFT (Energy Inc.)
      • Azbil Corporation
      • Hatch Ltd
      • Shanghai Baosight Software Co., Ltd.
  19. Assumptions & Acronyms Used
  20. Research Methodology

List of Tables

  • Table 1: Global Market Value (USD Million) Forecast by Region, 2020 to 2035
  • Table 2: Global Market Value (USD Million) Forecast by Component , 2020 to 2035
  • Table 3: Global Market Value (USD Million) Forecast by End User, 2020 to 2035
  • Table 4: North America Market Value (USD Million) Forecast by Country, 2020 to 2035
  • Table 5: North America Market Value (USD Million) Forecast by Component , 2020 to 2035
  • Table 6: North America Market Value (USD Million) Forecast by End User, 2020 to 2035
  • Table 7: Latin America Market Value (USD Million) Forecast by Country, 2020 to 2035
  • Table 8: Latin America Market Value (USD Million) Forecast by Component , 2020 to 2035
  • Table 9: Latin America Market Value (USD Million) Forecast by End User, 2020 to 2035
  • Table 10: Western Europe Market Value (USD Million) Forecast by Country, 2020 to 2035
  • Table 11: Western Europe Market Value (USD Million) Forecast by Component , 2020 to 2035
  • Table 12: Western Europe Market Value (USD Million) Forecast by End User, 2020 to 2035
  • Table 13: Eastern Europe Market Value (USD Million) Forecast by Country, 2020 to 2035
  • Table 14: Eastern Europe Market Value (USD Million) Forecast by Component , 2020 to 2035
  • Table 15: Eastern Europe Market Value (USD Million) Forecast by End User, 2020 to 2035
  • Table 16: East Asia Market Value (USD Million) Forecast by Country, 2020 to 2035
  • Table 17: East Asia Market Value (USD Million) Forecast by Component , 2020 to 2035
  • Table 18: East Asia Market Value (USD Million) Forecast by End User, 2020 to 2035
  • Table 19: South Asia and Pacific Market Value (USD Million) Forecast by Country, 2020 to 2035
  • Table 20: South Asia and Pacific Market Value (USD Million) Forecast by Component , 2020 to 2035
  • Table 21: South Asia and Pacific Market Value (USD Million) Forecast by End User, 2020 to 2035
  • Table 22: Middle East & Africa Market Value (USD Million) Forecast by Country, 2020 to 2035
  • Table 23: Middle East & Africa Market Value (USD Million) Forecast by Component , 2020 to 2035
  • Table 24: Middle East & Africa Market Value (USD Million) Forecast by End User, 2020 to 2035

List of Figures

  • Figure 1: Global Market Pricing Analysis
  • Figure 2: Global Market Value (USD Million) Forecast 2020-2035
  • Figure 3: Global Market Value Share and BPS Analysis by Component , 2025 and 2035
  • Figure 4: Global Market Y to o to Y Growth Comparison by Component , 2025-2035
  • Figure 5: Global Market Attractiveness Analysis by Component
  • Figure 6: Global Market Value Share and BPS Analysis by End User, 2025 and 2035
  • Figure 7: Global Market Y to o to Y Growth Comparison by End User, 2025-2035
  • Figure 8: Global Market Attractiveness Analysis by End User
  • Figure 9: Global Market Value (USD Million) Share and BPS Analysis by Region, 2025 and 2035
  • Figure 10: Global Market Y to o to Y Growth Comparison by Region, 2025-2035
  • Figure 11: Global Market Attractiveness Analysis by Region
  • Figure 12: North America Market Incremental Dollar Opportunity, 2025-2035
  • Figure 13: Latin America Market Incremental Dollar Opportunity, 2025-2035
  • Figure 14: Western Europe Market Incremental Dollar Opportunity, 2025-2035
  • Figure 15: Eastern Europe Market Incremental Dollar Opportunity, 2025-2035
  • Figure 16: East Asia Market Incremental Dollar Opportunity, 2025-2035
  • Figure 17: South Asia and Pacific Market Incremental Dollar Opportunity, 2025-2035
  • Figure 18: Middle East & Africa Market Incremental Dollar Opportunity, 2025-2035
  • Figure 19: North America Market Value Share and BPS Analysis by Country, 2025 and 2035
  • Figure 20: North America Market Value Share and BPS Analysis by Component , 2025 and 2035
  • Figure 21: North America Market Y to o to Y Growth Comparison by Component , 2025-2035
  • Figure 22: North America Market Attractiveness Analysis by Component
  • Figure 23: North America Market Value Share and BPS Analysis by End User, 2025 and 2035
  • Figure 24: North America Market Y to o to Y Growth Comparison by End User, 2025-2035
  • Figure 25: North America Market Attractiveness Analysis by End User
  • Figure 26: Latin America Market Value Share and BPS Analysis by Country, 2025 and 2035
  • Figure 27: Latin America Market Value Share and BPS Analysis by Component , 2025 and 2035
  • Figure 28: Latin America Market Y to o to Y Growth Comparison by Component , 2025-2035
  • Figure 29: Latin America Market Attractiveness Analysis by Component
  • Figure 30: Latin America Market Value Share and BPS Analysis by End User, 2025 and 2035
  • Figure 31: Latin America Market Y to o to Y Growth Comparison by End User, 2025-2035
  • Figure 32: Latin America Market Attractiveness Analysis by End User
  • Figure 33: Western Europe Market Value Share and BPS Analysis by Country, 2025 and 2035
  • Figure 34: Western Europe Market Value Share and BPS Analysis by Component , 2025 and 2035
  • Figure 35: Western Europe Market Y to o to Y Growth Comparison by Component , 2025-2035
  • Figure 36: Western Europe Market Attractiveness Analysis by Component
  • Figure 37: Western Europe Market Value Share and BPS Analysis by End User, 2025 and 2035
  • Figure 38: Western Europe Market Y to o to Y Growth Comparison by End User, 2025-2035
  • Figure 39: Western Europe Market Attractiveness Analysis by End User
  • Figure 40: Eastern Europe Market Value Share and BPS Analysis by Country, 2025 and 2035
  • Figure 41: Eastern Europe Market Value Share and BPS Analysis by Component , 2025 and 2035
  • Figure 42: Eastern Europe Market Y to o to Y Growth Comparison by Component , 2025-2035
  • Figure 43: Eastern Europe Market Attractiveness Analysis by Component
  • Figure 44: Eastern Europe Market Value Share and BPS Analysis by End User, 2025 and 2035
  • Figure 45: Eastern Europe Market Y to o to Y Growth Comparison by End User, 2025-2035
  • Figure 46: Eastern Europe Market Attractiveness Analysis by End User
  • Figure 47: East Asia Market Value Share and BPS Analysis by Country, 2025 and 2035
  • Figure 48: East Asia Market Value Share and BPS Analysis by Component , 2025 and 2035
  • Figure 49: East Asia Market Y to o to Y Growth Comparison by Component , 2025-2035
  • Figure 50: East Asia Market Attractiveness Analysis by Component
  • Figure 51: East Asia Market Value Share and BPS Analysis by End User, 2025 and 2035
  • Figure 52: East Asia Market Y to o to Y Growth Comparison by End User, 2025-2035
  • Figure 53: East Asia Market Attractiveness Analysis by End User
  • Figure 54: South Asia and Pacific Market Value Share and BPS Analysis by Country, 2025 and 2035
  • Figure 55: South Asia and Pacific Market Value Share and BPS Analysis by Component , 2025 and 2035
  • Figure 56: South Asia and Pacific Market Y to o to Y Growth Comparison by Component , 2025-2035
  • Figure 57: South Asia and Pacific Market Attractiveness Analysis by Component
  • Figure 58: South Asia and Pacific Market Value Share and BPS Analysis by End User, 2025 and 2035
  • Figure 59: South Asia and Pacific Market Y to o to Y Growth Comparison by End User, 2025-2035
  • Figure 60: South Asia and Pacific Market Attractiveness Analysis by End User
  • Figure 61: Middle East & Africa Market Value Share and BPS Analysis by Country, 2025 and 2035
  • Figure 62: Middle East & Africa Market Value Share and BPS Analysis by Component , 2025 and 2035
  • Figure 63: Middle East & Africa Market Y to o to Y Growth Comparison by Component , 2025-2035
  • Figure 64: Middle East & Africa Market Attractiveness Analysis by Component
  • Figure 65: Middle East & Africa Market Value Share and BPS Analysis by End User, 2025 and 2035
  • Figure 66: Middle East & Africa Market Y to o to Y Growth Comparison by End User, 2025-2035
  • Figure 67: Middle East & Africa Market Attractiveness Analysis by End User
  • Figure 68: Global Market - Tier Structure Analysis
  • Figure 69: Global Market - Company Share Analysis
Dashboard
Dashboard
Dashboard
Dashboard
Dashboard
Dashboard

Our Research Products

Full Research Suite

The "Full Research Suite" delivers actionable market intel, deep dives on markets or technologies, so clients act faster, cut risk, and unlock growth.

Competitor Leaderboard Report

The Leaderboard benchmarks and ranks top vendors, classifying them as Established Leaders, Leading Challengers, or Disruptors & Challengers.

Future Leaders Index

Locates where complements amplify value and substitutes erode it, forecasting net impact by horizon

Market Data & Forecasts

We deliver granular, decision-grade intel: market sizing, 5-year forecasts, pricing, adoption, usage, revenue, and operational KPIs—plus competitor tracking, regulation, and value chains—across 60 countries broadly.

Market Focus Report

Spot the shifts before they hit your P&L. We track inflection points, adoption curves, pricing moves, and ecosystem plays to show where demand is heading, why it is changing, and what to do next across high-growth markets and disruptive tech

Survey Report

Real-time reads of user behavior. We track shifting priorities, perceptions of today’s and next-gen services, and provider experience, then pace how fast tech moves from trial to adoption, blending buyer, consumer, and channel inputs with social signals (#WhySwitch, #UX).

Bespoke Reports

Partner with our analyst team to build a custom report designed around your business priorities. From analysing market trends to assessing competitors or crafting bespoke datasets, we tailor insights to your needs.

Supplier Intelligence

Discovery & Profiling

Capacity & Footprint

Performance & Risk

Compliance & Governance

Commercial Readiness

Who Supplies Whom

Scorecards & Shortlists

Playbooks & Docs

Category Intelligence

Definition & Scope

Demand & Use Cases

Cost Drivers

Market Structure

Supply Chain Map

Trade & Policy

Operating Norms

Deliverables

Buyer Intelligence

Account Basics

Spend & Scope

Procurement Model

Vendor Requirements

Terms & Policies

Entry Strategy

Pain Points & Triggers

Outputs

Pricing Analysis

Benchmarks

Trends

Should-Cost

Indexation

Landed Cost

Commercial Terms

Deliverables

Brand Analysis

Positioning & Value Prop

Share & Presence

Customer Evidence

Go-to-Market

Digital & Reputation

Compliance & Trust

KPIs & Gaps

Outputs

Full Research Suite comprises of:

Market outlook & trends analysis

Market outlook & trends analysis

Interviews & case studies

Interviews & case studies

Strategic recommendations

Strategic recommendations

Vendor profiles & capabilities analysis

Vendor profiles & capabilities analysis

5-year forecasts

5-year forecasts

8 regions and 60+ country-level data splits

8 regions and 60+ country-level data splits

Market segment data splits

Market segment data splits

12 months of continuous data updates

12 months of continuous data updates

DELIVERED AS:

PDF EXCEL ONLINE

Full Research Suite


$5000

$7500

$10000

Buy Report Now
Similar Industry Reports

Similar Industry Reports

Energy Management System Market

Energy Management System Market Analysis – Growth & Forecast 2017-2025

Home Energy Management Systems Market

Home Energy Management Systems Market Size and Share Forecast Outlook 2025 to 2035

Industrial Energy Monitoring Market

Industrial Energy Monitoring Market

Industrial Skid System Market

Industrial Skid System Market Analysis - Size, Share, and Forecast Outlook 2025 to 2035

Industrial Denox System Market

Industrial Denox System Market Size and Share Forecast Outlook 2025 to 2035

Energy Portfolio Management Market

Energy Portfolio Management Market Report – Trends & Forecast 2023-2033

Industrial Cooling Systems Market

Industrial Cooling Systems Market Size and Share Forecast Outlook 2025 to 2035

Industrial Exhaust System Market

Industrial Exhaust System Market Growth - Trends & Forecast 2025 to 2035

Industrial Security System Market

Industrial Security System Market Forecast Outlook 2025 to 2035

Cloud Systems Management Software Market

Cloud Systems Management Software Market Size and Share Forecast Outlook 2025 to 2035

Industrial Embedded Systems Market

Industrial Embedded Systems Market Size and Share Forecast Outlook 2025 to 2035

Light Management System Market

Light Management System Market Size and Share Forecast Outlook 2025 to 2035

Labor Management System In Retail Market

Labor Management System In Retail Market Size and Share Forecast Outlook 2025 to 2035

Stool Management System Market

Stool Management System Market Analysis - Size, Share, and Forecast Outlook 2025 to 2035

Power Management System Market

Power Management System Market Analysis - Size, Share, and Forecast Outlook 2025 to 2035

Systems Administration Management Tools Market

Systems Administration Management Tools Market Size and Share Forecast Outlook 2025 to 2035

Alarm Management System Market

Alarm Management System Market Analysis by Component, Industry and Region - Trends, Growth & Forecast 2025 to 2035

Crowd Management System Market

Crowd Management System Market

Asset Management System Market

Asset Management System Market

Dealer Management System Market

Dealer Management System Market Size and Share Forecast Outlook 2025 to 2035

Future Market Insights

Industrial Energy Management System Market

Chat With MaRIA

Chat With

MaRIA

Hi There, I am MaRIA, Your Market Research Intelligence Assistant. How may I help you?