Industrial Chemical Packaging Market
Market Insights on Industrial Chemical Packaging covering sales outlook, demand forecast & up-to-date key trends
Industrial Chemical Packaging Market by Intermediate bulk containers (IBCs) (RIBCs, FIBCs), Flexitanks, Drums (Metal, Plastic, Pails & Jerry Cans, Bags & Sacks) & Region - Forecast to 2021 - 2031
Industrial Chemical Packaging Market Snapshot
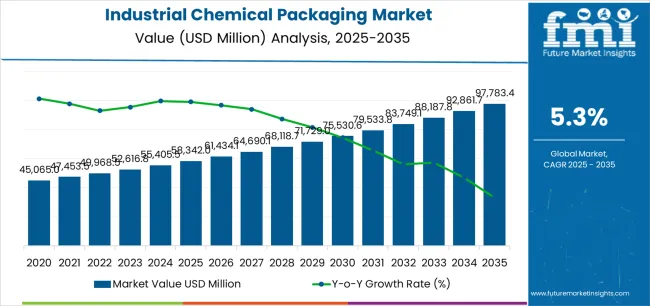
[272 Pages Report] As per the latest study of Future Market Insights (FMI), the consumption of industrial chemical packaging is projected to increase by year-on-year growth of 4.0% in 2021. Global demand for industrial chemical packaging solutions is forecast to reach from 2.9 billion units in 2021 to 4.6 billion units by the year 2031.
The research experts at FMI predict the global sales of industrial chemical packaging solutions to increase by 1.5x over the coming decade.
Let us know your requirement to get
100% FREE customization
Key Points Covered in Industrial Chemical Packaging Market Study
- Market estimates and forecast 2015-2031
- Key drivers and restraints impacting market growth
- Segment-wise, Country-wise, and Region-wise Analysis
- Competition Mapping and Benchmarking
- Market Share Analysis
- Key Product Innovations and Regulatory Climate
- COVID-19 Impact on Industrial Chemical Packaging Market and How to Navigate
- Recommendation on Key Winning Strategies
2016-2020 Global Industrial Chemical Packaging sales Compared to 2021-2031 Forecast
Driven by flooding demand for chemicals essentially used in the food and pharmaceutical industry, the global industrial chemical packaging market will register positive growth. Also, surge in demand for organic chemicals and various other types of additives is resulting in increasing sales of sustainable packaging solutions.
According to the report, the market is estimated to grow at 4.0% CAGR between 2021 and 2031 in comparison to 3.6% CAGR registered during 2016-2020.
Manufacturers in the industrial packaging industry are adapting to the needs of modern-day consumers. Therefore, the focus is on consistent improvement in production technology as market players aim for competitive edge.
Leading players are leveraging their cutting-edge technologies to maintain their supremacy in the market. Established markets already use automated technologies for cutting, welding and shaping different types of packaging solutions required by various industries.
State-of-the-art leak detecting machinery and advanced testing solutions are designed for making sure that chemical packaging solutions adhere to international safety standards and complies with weight handling capacity.
How is Expansion of Diverse Industry Verticals Spurring Market Growth?
In the past decade, manufacturing industries including original equipment manufacturers and various types of value-added services providers have witnessed a surge in demand for food & beverages, cosmetics, and pharmaceutical products. Emergence of new entrants in production and related services will offer lucrative growth opportunities.
Increase in production capacities of various end-use industries such as food & beverages and chemical processing, wide range of new industrial applications of chemicals in cosmetics & personal care and automotive, and research & development services have led to a sharp rise in demand for industrial chemical packaging.
Find your sweet spots for generating winning opportunities in this market.
Talk to AnalystHigh Demand for Safe Packaging Solutions to Improve the Sales
Innovation-driven packaging industry always comes up with more effective packaging solutions than traditional alternatives. In recent years, it the demand for safe packaging solutions has increased, specially designed for transporting high-value goods.
Innovative bulk packaging solutions developed for safe packaging of harmful chemicals, such as intermediate bulk containers, are made to cater for a wide range of applications. Rigid intermediate bulk containers are designed for liquid and granulated forms of chemicals goods and flexible intermediate bulk containers are made for easing the movement of chemicals in powdered form.
Manufacturers and exporters are using high-quality industrial packaging for their high-value goods, for risk-free transit of chemicals. Shipping and logistics partners also prefer spill-proof packaging to avoid wastage of goods, and the surface of the transport vehicle or ship also remains unaffected.
Demand for Accessories and Support Products to Bolster Growth
Players in the packaging industry are confined to the production of primary and secondary packaging solutions, in which goods are to be packed directly or secondarily. Due to the advancement of technology and launch of latest packaging solutions, demand for accessories and complementary products required for industrial packaging are rising across the globe.
Accessories such as different types of lids, caps & closures, locks and pallets are used for efficient usage of industrial chemical packaging solutions, thus, making it easy to handle for logistical partners along with end-user industries.
Rising demand for improvement in these accessories as a part of improved packaging solution will create opportunities for growth of the market.

An unified Market Research Subscription Platform, built for today’s disparate research needs.
Impact of the COVID-19 Crisis On Industrial Chemical Packaging Market
Unprecedented outbreak of COVID-19 pandemic resulted in the implementation of stringent restrictions and lockdowns, disrupting supply chain activities across manufacturing facilities. However, certain relaxations were allowed for essential goods which resulted in continued production and movement in food & beverages and pharmaceutical industries.
The demand for food and feed additives continued, especially as consumers resorted to panic buying. Besides this, the increasing demand for medical equipment and essential drugs caused sharp rise in industrial chemical packaging application within the pharmaceutical sector.
These factors helped the demands for chemical packaging to consistently rise, despite the COVID-19 induced challenges.
Country-wise Insights
What Makes U.S. the Largest Market for ICP Solutions in North America?
As per the Federal Hazardous Substances Act (FHSA), all toxic, corrosive, flammable and irritant products require labelling and safe packaging as it may result in illness or damage to the people and surrounding where it is stored or transported.
Strict regulations from regulatory authorities regarding specific labelling of all types of hazardous materials on packaging had a profound impact on the chemical packaging market in the U.S.
The U.S. market is driven by increasing consumption of active pharmaceutical ingredients. This trend is expected to continue on account of the presence of leading pharmaceutical companies in the country.
Based on aforementioned factors, the U.S. has emerged as the largest market accounting for nearly 60% of sales of industrial chemical packaging solutions in North America in 2021.
How Industrial Chemical Packaging Market will expand in the U.K.?
The industrial chemical packaging market in the U.K. is driven by the presence of some of the leading market players. The U.K. market is estimated to create incremental opportunity of US$ 1.7 billion, during 2021-2031.
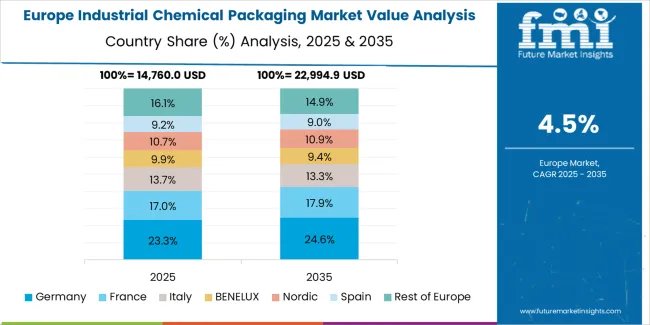
Increasing investments towards the production of organic chemicals will fuel the demand for convenient packaging solutions. The demand for industrial chemical packaging in the U.K. is anticipated to grow of 1.5x over the forecast period, making it the third-largest market in Europe.
How are Favorable Chemical Transport Policies Aiding Growth in Germany?
The European Chemical Industry Council (CEFIC), along with various European regulatory authorities has set specific quantitative limits on the packaging of hazardous chemicals while domestic and international transport. It is necessary for the chemical industry to comply with regulations on classification, labelling and packaging (CLP Regulations) meant for smooth and damage-free movement of hazardous materials across the globe.
Home to one of the largest automobile industries in the world, Germany will accounts for approximately 17% of the Europe market through 2031. Surge in demand for various dyes and pigments along with paints & coatings will create opportunities for sales in Germany.
Why is India Considered as Lucrative Market for Industrial Chemical Packaging Market?
India is the second-largest food producer in the world. Growth in consumption and production of various fertilizers, pesticides and agrochemicals in the recent decade will create opportunities for sales of industrial chemical packaging.
The country ranks as the largest producer of agrochemicals, according to the India Brand Equity Foundation (IBEF) and the chemical industry of India covers more than 70,000 commercial products.
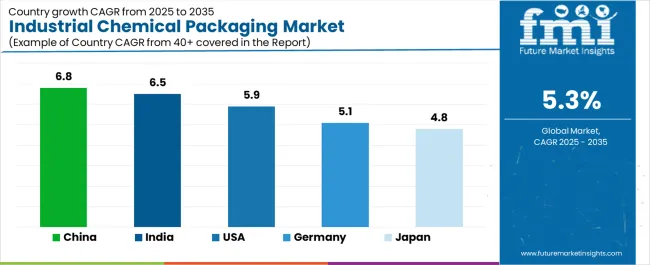
Overall sharp rise in exports of chemicals produced in India results in high demand for packaging solutions fit for international transportation of hazardous materials. As per FMI analysis industrial chemical packaging market in India is estimated to register growth at 6.3% CAGR over the upcoming decade.
What Makes China Largest Consumer of Industrial Chemical Packaging Solutions Globally?
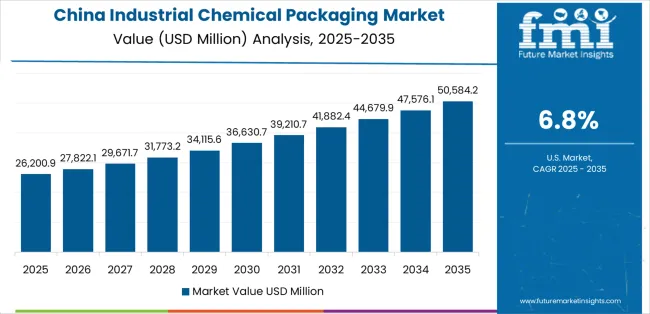
China is the world’s largest producer of chemicals. As per The European Chemical Industry Council (CEFIC) it accounted for more than 40% of chemicals sold across the globe. China held around 46% of the East Asia market in 2020.
The rising sophistication of industrial output in China and rapid investments helped manufacturers to upgrade to advanced production technologies and the easy availability of raw materials and financial resources contributed towards the growth in production of all types of chemicals in the country.
Category-wise Insights
Which Packaging Format is Most Widely Used for Industrial Chemical Packaging?
The intermediate bulk containers (IBC) accounts for ~64% of the total industrial chemical packaging solutions sold across the world. A variety of intermediate bulk containers are produced by manufacturers in all parts of the world, such as rigid intermediate bulk containers made up of plastic and stainless steel.
Intermediate bulk containers having a capacity of 800-1,250 liters are the most used type across and they occupy nearly half of total intermediate bulk containers sold. Overall, the intermediate bulk containers will offer incremental opportunity of more than US$ 34.1 billion between 2021 and 2031.
Why is Plastic More Preferred for Industrial Chemical Packaging?
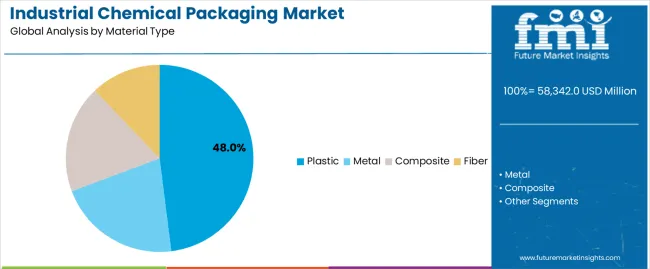
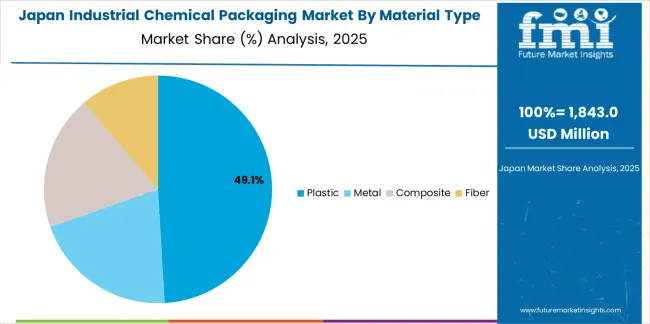
As per FMI, plastic emerged as the most preferred material used by manufacturers of industrial chemical packaging. Approximately 40% of industrial chemical packaging solutions are produced using plastics as raw material in 2020.
Different variables of recyclable plastics such as high-density polyethylene (HDPE), low-density polyethylene (LDPE), polypropylene (PP) and polyvinyl chloride (PVC) are most famous plastic types used because they offer durability and strength required for easy handling of industrial chemicals.
Heavy investments in research & development have enabled producers to develop metallized polyethylene terephthalate (MET-PET), which does not absorb moisture and is 100% recyclability makes it perfect for safe transportation of hazardous and high-value chemicals to the farthest places.
Specialty Chemicals will Exhibit Higher Demand
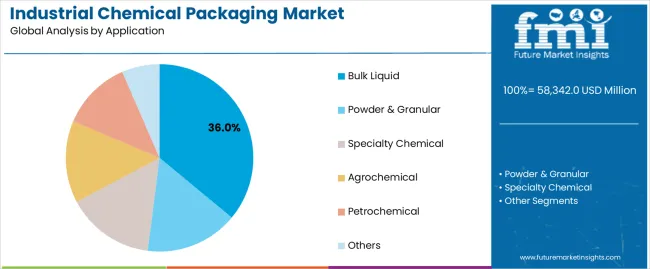
The specialty chemicals segment is anticipated to exhibit growth at 4.4% CAGR during the forecast period. Outpouring demand for various specialty polymers, polymer additives, dyes & pigments and a wide range of pharmaceutical and agricultural chemicals results in the growth of production and consumption of specialty chemicals.
Rapid rise witnessed in demand for active pharmaceutical ingredients for the production of various medicinal drugs and feed additives will spur the demand for industrial chemical packaging.
The specialty chemicals segment will create total incremental opportunity of more than US$ 36.5 billion between 2021 and 2031.
Competitive Landscape
Companies operating in industrial chemical packaging market are aiming at strategic expansions and collaborations with key end users such as, chemical manufacturers and logistical partners to expand market reach of their products and to develop industry specific industrial chemical packaging solutions.
- In October 2020, Myers Industries, Inc. acquired Elhkart Plastics, Inc., which is the fifth largest rotational molder in USA, to strengthen its product portfolio. The move is seen as part of its long term strategic plan for transforming the company in to high growth producer of engineered plastic solutions.
- In April 2021, ProAmpac acquired two companies named IG Industries PLC and Brayford Plastics Ltd., based in UK for production of recyclable packaging solutions.
Scope of Report
Attribute |
Details |
Forecast Period |
2021-2031 |
Historical Data Available for |
2015-2020 |
Market Analysis |
USD Million for Value, Million Units for Volume |
Key Regions Covered |
North America, Latin America, Europe, South Asia, East Asia, Oceania, Middle East and Africa |
Key Countries Covered |
US, Canada, Brazil, Mexico, Germany, Italy, France, U.K., Spain, Russia, GCC Countries, Turkey, China, Japan, India, Australia |
Key Segments Covered |
Packaging Format, Material, Chemical Type and Region |
Key Companies Profiled |
|
Report Coverage |
Market Forecast, Company Share Analysis, Competition Intelligence, DROT Analysis, Market Dynamics and Challenges, and Strategic Growth Initiatives |
Customization & Pricing |
Available upon Request |
Industrial Chemical Packaging Market by Category
By Packaging Format:
- Intermediate bulk containers (IBCs)
- RIBCs
- Up to 800 Litres
- 800 Litres to 1,250 Litres
- Above 1,250 Litres
- FIBCs
- RIBCs
- Flexitanks
- Drums
- Metal
- Standard 210 Litres
- Other than 210 Litres
- Plastic
- Up to 50 Litres
- 50- 100 Litres
- 100-200 Litres
- Above 200 Litres
- Metal
- Pails & Jerry Cans
- Bags & Sacks
- Others (Bins & Liners, etc.)
By Material:
- Metal
- Steel
- Tin
- Plastic
- Polyethylene
- LDPE
- HDPE
- Metalized polyethylene terephthalate (MET-PET)
- Polyvinyl Chloride (PVC)
- Polyamide (PA)
- Polypropylene (PP)
- Polystyrene (PS)
- Others
- Polyethylene
- Paper & Paperboard
By Chemical Type:
- Specialty Chemicals
- Paints & Coatings
- Adhesives & Sealants
- Specialty Polymers
- Food & Feed Additives
- Polymer Additives
- Active Pharmaceutical Ingredients
- Agrochemicals
- Dyes & Pigments
- Others (Fragrances & Flavours, Personal Care Ingredients, etc.)
- Commodity Chemicals
- Monomer & Polymer Resins
- Inorganic Chemicals
- Organic Chemicals
- Petrochemicals
- Others
By Region:
- North America
- Latin America
- Europe
- South Asia
- East Asia
- Oceania
- Middle East & Africa (MEA)
Frequently Asked Questions
The industrial chemical packaging market is projected to exceed an evaluation of US$ 124.9 billion by 2021.
The industrial chemical packaging market recorded solid growth at 3.6% CAGR in the last five years between 2015 and 2020.
The industrial chemical packaging market is anticipated to register a stable rise in demand after a period of reducing sales during COVID-19 in 2020. As per FMI, the market will register growth at a CAGR of 4.0% between 2021 and 2031.
Global key players in the industrial chemical packaging market are manufacturing packaging solutions made up of sustainably sourced raw materials, which offer easy re-usability and recyclability of all types of industrial chemical packaging solutions.
Sharp rise witnessed in international trade of different types of liquid and solid chemicals across the continents drives the sales of industrial chemical packaging solutions.
North America is the second-largest market for industrial chemical packaging solutions and is likely to hold 25% global sales, over the estimated period.
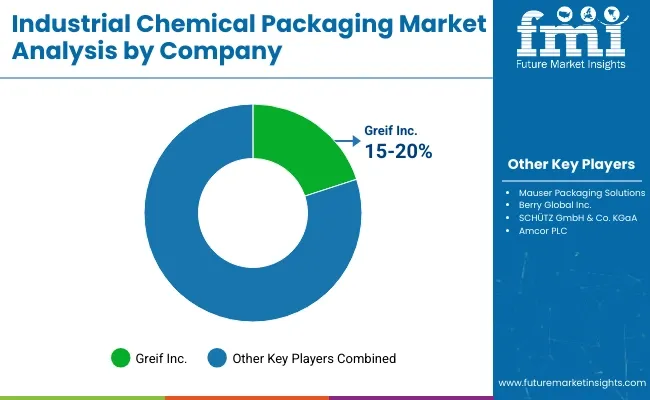
The top five estimated global players in the industrial chemical packaging market are Grief, Inc., ProAmpac, Segheza Group, Myers Industries, Inc., and Time Technoplast Ltd., These major companies are estimated to hold a market share of more than 25%-30% in 2020 the global industrial chemical packaging market.
According to the FMI analysis, the Europe industrial chemical packaging market is anticipated to register growth at a CAGR of 2.4% between 2021 and 2031.
The U.S., Canada, China, India and Germany are among major markets for industrial chemical packaging solutions, recording consistently high demand.
As per FMI, the South Asia industrial chemical packaging market is anticipated to increase at 6.5% CAGR over the upcoming decade.
Table of Content
1. Executive Summary
1.1. Global Market Overview
1.2. Analysis and Recommendations
2. Market Overview
2.1. Market Definition
2.2. Market Taxonomy
3. Key Market Trends
3.1. Key Trends Impacting the Market
3.2. Product Innovation / Development Trends
4. Key Success Factors
4.1. Product Adoption / Usage Analysis
4.2. Product USPs / Features
5. Global Industrial Chemical Packaging Market Demand Analysis 2015-2020 and Forecast, 2021-2031
5.1. Historical Market Volume (Mn Units) Analysis, 2015-2020
5.2. Current and Future Market Volume (Mn Units) Projections, 2021-2031
5.3. Y-o-Y Growth Trend Analysis
6. Global Industrial Chemical Packaging Market - Pricing Analysis
6.1. Regional Pricing Analysis, By Material
6.2. Pricing Break-up
6.3. Global Average Pricing Analysis Benchmark
7. Global Industrial Chemical Packaging Market Demand (US$ Mn) Analysis 2015-2020 and Forecast, 2021-2031
7.1. Historical Market Value (US$ Mn) Analysis, 2015-2020
7.2. Current and Future Market Value (US$ Mn) Projections, 2021-2031
7.2.1. Y-o-Y Growth Trend Analysis
7.2.2. Absolute $ Opportunity Analysis
8. Market Background
8.1. Global GDP Growth Outlook
8.2. Global Packaging Market Overview
8.3. Global Rigid Packaging Market Overview
8.4. Global Chemical Sales Outlook
8.5. Key Industry Perspective: What Industry Leaders are saying?
8.6. Macro-Economic Factors & Co-relation Analysis
8.6.1. Global Industrial Packaging Growth
8.6.2. Chemical Industry Growth
8.6.3. Covid-19 Pandemic
8.6.4. Growth of Rigid Packaging Industry
8.6.5. Packaging Industry
8.7. Forecast Factors - Relevance & Impact
8.7.1. Global Rigid Packaging Industry Growth
8.7.2. Global Food & Beverage Industry Growth
8.7.3. Growth in International Trade of Chemicals
8.7.4. Global Pharmaceutical Industry Growth
8.7.5. Segmental Revenue Growth of Key Players
8.7.6. Growth of Sustainable Packaging Solutions
8.7.7. Global Personal Care Industry Growth
8.7.8. Global Industrial Growth
8.8. Value Chain Analysis
8.8.1. Key Market Participants
8.8.1.1. Raw Material Suppliers
8.8.1.2. Packaging Format Manufacturers
8.8.1.3. End-users
8.8.2. Profitability Margin
8.9. Market Dynamics
8.9.1. Drivers
8.9.2. Restraints
8.9.3. Opportunity Analysis
9. Impact of COVID-19
9.1. Current Statistics and Probable Future Impact
9.2. Impact of COVID-19 on Packaging Market
10. Global Industrial Chemical Packaging Market Analysis 2015-2020 and Forecast 2021-2031, By Packaging Format
10.1. Introduction
10.2. Historical Market Size (US$ Mn) and Volume (Mn Units) Analysis, By Packaging Format, 2015-2020
10.3. Current and Future Market Size (US$ Mn) and Volume (Mn Units) Analysis and Forecast, By Packaging Format, 2021-2031
10.3.1. Intermediate bulk containers (IBCs)
10.3.1.1. RIBCs
10.3.1.1.1. Up to 800 Litres
10.3.1.1.2. 800 Litres to 1,250 Litres
10.3.1.1.3. Above 1,250 Litres
10.3.1.2. FIBCs
10.3.2. Flexitanks
10.3.3. Drums
10.3.3.1. Metal
10.3.3.2. Standard 210 Litres
10.3.3.3. Other than 210 Litres
10.3.3.4. Plastic
10.3.3.5. Up to 50 Litres
10.3.3.6. 50- 100 Litres
10.3.3.7. 100-200 Litres
10.3.3.8. Above 200 Litres
10.3.4. Pails & Jerry Cans
10.3.5. Bags & Sacks
10.3.6. Wrapping Films
10.3.7. Others (Bins & Liners, etc.)
10.4. Market Attractiveness Analysis, By Packaging Format
11. Global Industrial Chemical Packaging Market Analysis 2015-2020 and Forecast 2021-2031, By Material
11.1. Introduction
11.2. Historical Market Size (US$ Mn) and Volume (Mn Units) Analysis, By Material, 2015-2020
11.3. Current and Future Market Size (US$ Mn) and Volume (Mn Units) Analysis and Forecast, By Material, 2021-2031
11.3.1. Metal
11.3.1.1. Steel
11.3.1.2. Tin
11.3.2. Plastic
11.3.2.1. Polyethylene
11.3.2.1.1. LDPE
11.3.2.1.2. HDPE
11.3.2.2. Metalized polyethylene terephthalate (MET-PET)
11.3.2.3. Polyvinyl Chloride (PVC)
11.3.2.4. Polyamide ( PA)
11.3.2.5. Polypropylene (PP)
11.3.2.6. Polystyrene ( PS)
11.3.2.7. Others
11.3.3. Paper & Paperboard
11.4. Market Attractiveness Analysis, By Material
12. Global Industrial Chemical Packaging Market Analysis 2015-2020 and Forecast 2021-2031, By Chemical Type
12.1. Introduction
12.2. Historical Market Size (US$ Mn) and Volume (Mn Units) Analysis, By Chemical Type, 2015-2020
12.3. Current and Future Market Size (US$ Mn) and Volume (Mn Units) Analysis and Forecast, By Chemical Type, 2021-2031
12.3.1. Specialty Chemicals
12.3.1.1. Paints & Coatings
12.3.1.2. Adhesives & Sealants
12.3.1.3. Specialty Polymers
12.3.1.4. Food & Feed Additives
12.3.1.5. Polymer Additives
12.3.1.6. Active Pharmaceutical Ingredients
12.3.1.7. Agrochemicals
12.3.1.8. Dyes & Pigments
12.3.1.9. Others (Fragrances & Flavors, Personal Care Ingredients, etc.)
12.3.2. Commodity Chemicals
12.3.2.1. Monomer & Polymer Resins
12.3.2.2. Inorganic Chemicals
12.3.2.3. Organic Chemicals
12.3.2.4. Petrochemicals
12.3.2.5. Others
12.4. Market Attractiveness Analysis, By Chemical Type
13. Global Industrial Chemical Packaging Market Analysis 2015-2020 and Forecast 2021-2031, by Region
13.1. Introduction
13.2. Historical Market Size (US$ Mn) and Volume (Mn Units) Analysis, by Region, 2015-2020
13.3. Current Market Size (US$ Mn) and Volume (Mn Units) Analysis and Forecast, by Region, 2021-2031
13.3.1. North America
13.3.2. Latin America
13.3.3. Europe
13.3.4. Middle East and Africa (MEA)
13.3.5. East Asia
13.3.6. South Asia
13.3.7. Oceania
13.4. Market Attractiveness Analysis, by Region
14. North America Industrial Chemical Packaging Market Analysis 2015-2020 and Forecast 2021-2031
14.1. Introduction
14.2. Historical Market Size (US$ Mn) and Volume (Mn Units) Trend Analysis, by Market Taxonomy, 2015-2020
14.3. Market Size (US$ Mn) and Volume (Mn Units) Forecast, by Market Taxonomy, 2021-2031
14.3.1. By Country
14.3.1.1. U.S.
14.3.1.2. Canada
14.3.2. By Packaging Format
14.3.3. By Material
14.3.4. By Chemical Type
14.4. Market Attractiveness Analysis
14.4.1. By Country
14.4.2. By Packaging Format
14.4.3. By Material
14.4.4. By Chemical Type
14.5. Key Market Participants - Intensity Mapping
15. Latin America Industrial Chemical Packaging Market Analysis 2015-2020 and Forecast 2021-2031
15.1. Introduction
15.2. Historical Market Size (US$ Mn) and Volume (Mn Units) Trend Analysis, by Market Taxonomy, 2015-2020
15.3. Market Size (US$ Mn) and Volume (Mn Units) Forecast, by Market Taxonomy, 2021-2031
15.3.1. By Country
15.3.1.1. Brazil
15.3.1.2. Mexico
15.3.1.3. Argentina
15.3.1.4. Rest of Latin America
15.3.2. By Packaging Format
15.3.3. By Material
15.3.4. By Chemical Type
15.4. Market Attractiveness Analysis
15.4.1. By Country
15.4.2. By Packaging Format
15.4.3. By Material
15.4.4. By Chemical Type
15.5. Key Market Participants - Intensity Mapping
16. Europe Industrial Chemical Packaging Market Analysis 2015-2020 and Forecast 2021-2031
16.1. Introduction
16.2. Historical Market Size (US$ Mn) and Volume (Mn Units) Trend Analysis, by Market Taxonomy, 2015-2020
16.3. Market Size (US$ Mn) and Volume (Mn Units) Forecast, by Market Taxonomy, 2021-2031
16.3.1. By Country
16.3.1.1. Germany
16.3.1.2. Italy
16.3.1.3. France
16.3.1.4. U.K.
16.3.1.5. Spain
16.3.1.6. BENELUX
16.3.1.7. Nordics
16.3.1.8. Russia
16.3.1.9. Poland
16.3.1.10. Rest of Europe
16.3.2. By Packaging Format
16.3.3. By Material
16.3.4. By Chemical Type
16.4. Market Attractiveness Analysis
16.4.1. By Country
16.4.2. By Packaging Format
16.4.3. By Material
16.4.4. By Chemical Type
16.5. Key Market Participants - Intensity Mapping
17. South Asia Industrial Chemical Packaging Market Analysis 2015-2020 and Forecast 2021-2031
17.1. Introduction
17.2. Historical Market Size (US$ Mn) and Volume (Mn Units) Trend Analysis, by Market Taxonomy, 2015-2020
17.3. Market Size (US$ Mn) and Volume (Mn Units) Forecast, by Market Taxonomy, 2021-2031
17.3.1. By Country
17.3.1.1. India
17.3.1.2. Thailand
17.3.1.3. Indonesia
17.3.1.4. Malaysia
17.3.1.5. Rest of South Asia
17.3.2. By Packaging Format
17.3.3. By Material
17.3.4. By Chemical Type
17.4. Market Attractiveness Analysis
17.4.1. By Country
17.4.2. By Packaging Format
17.4.3. By Material
17.4.4. By Chemical Type
17.5. Key Market Participants - Intensity Mapping
18. East Asia Industrial Chemical Packaging Market Analysis 2015-2020 and Forecast 2021-2031
18.1. Introduction
18.2. Historical Market Size (US$ Mn) and Volume (Mn Units) Trend Analysis, by Market Taxonomy, 2015-2020
18.3. Market Size (US$ Mn) and Volume (Mn Units) Forecast, by Market Taxonomy, 2021-2031
18.3.1. By Country
18.3.1.1. China
18.3.1.2. Japan
18.3.1.3. South Korea
18.3.1.4. Rest of East Asia
18.3.2. By Packaging Format
18.3.3. By Material
18.3.4. By Chemical Type
18.4. Market Attractiveness Analysis
18.4.1. By Country
18.4.2. By Packaging Format
18.4.3. By Material
18.4.4. By Chemical Type
18.5. Key Market Participants - Intensity Mapping
19. Oceania Industrial Chemical Packaging Market Analysis 2015-2020 and Forecast 2021-2031
19.1. Introduction
19.2. Historical Market Size (US$ Mn) and Volume (Mn Units) Trend Analysis, by Market Taxonomy, 2015-2020
19.3. Market Size (US$ Mn) and Volume (Mn Units) Forecast, by Market Taxonomy, 2021-2031
19.3.1. By Country
19.3.1.1. Australia
19.3.1.2. New Zealand
19.3.2. By Packaging Format
19.3.3. By Material
19.3.4. By Chemical Type
19.4. Market Attractiveness Analysis
19.4.1. By Country
19.4.2. By Packaging Format
19.4.3. By Material
19.4.4. By Chemical Type
19.5. Key Market Participants - Intensity Mapping
20. Middle East and Africa Industrial Chemical Packaging Market Analysis 2015-2020 and Forecast 2021-2031
20.1. Introduction
20.2. Historical Market Size (US$ Mn) and Volume (Mn Units) Trend Analysis, by Market Taxonomy, 2015-2020
20.3. Market Size (US$ Mn) and Volume (Mn Units) Forecast, by Market Taxonomy, 2021-2031
20.3.1. By Country
20.3.1.1. GCC Countries
20.3.1.2. Turkey
20.3.1.3. Northern Africa
20.3.1.4. South Africa
20.3.1.5. Rest of Middle East and Africa
20.3.2. By Packaging Format
20.3.3. By Material
20.3.4. By Chemical Type
20.4. Market Attractiveness Analysis
20.4.1. By Country
20.4.2. By Packaging Format
20.4.3. By Material
20.4.4. By Chemical Type
20.5. Key Market Participants - Intensity Mapping
21. Industrial Chemical Packaging Market Country-wise Analysis and Forecast
21.1. U.S. Industrial Chemical Packaging Market Analysis 2021 & 2031
21.1.1. Market Volume (Mn Units) and Value (US$ Mn) Analysis and Forecast, by Market Taxonomy
21.1.1.1. By Packaging Format
21.1.1.2. By Material
21.1.1.3. By Chemical Type
21.2. Canada Industrial Chemical Packaging Market Analysis 2021 & 2031
21.2.1. Market Volume (Mn Units) and Value (US$ Mn) Analysis and Forecast, by Market Taxonomy
21.2.1.1. By Packaging Format
21.2.1.2. By Material
21.2.1.3. By Packaging Format
21.3. Brazil Industrial Chemical Packaging Market Analysis 2021 & 2031
21.3.1. Market Volume (Mn Units) and Value (US$ Mn) Analysis and Forecast, by Market Taxonomy
21.3.1.1. By Packaging Format
21.3.1.2. By Material
21.3.1.3. By Chemical Type
21.4. Mexico Industrial Chemical Packaging Market Analysis 2021 & 2031
21.4.1. Market Volume (Mn Units) and Value (US$ Mn) Analysis and Forecast, by Market Taxonomy
21.4.1.1. By Packaging Format
21.4.1.2. By Material
21.4.1.3. By Chemical Type
21.5. Germany Industrial Chemical Packaging Market Analysis 2021 & 2031
21.5.1. Market Volume (Mn Units) and Value (US$ Mn) Analysis and Forecast, by Market Taxonomy
21.5.1.1. By Packaging Format
21.5.1.2. By Material
21.5.1.3. By Chemical Type
21.6. Italy Industrial Chemical Packaging Market Analysis 2021 & 2031
21.6.1. Market Volume (Mn Units) and Value (US$ Mn) Analysis and Forecast, by Market Taxonomy
21.6.1.1. By Packaging Format
21.6.1.2. By Material
21.6.1.3. By Chemical Type
21.7. France Industrial Chemical Packaging Market Analysis 2021 & 2031
21.7.1. Market Volume (Mn Units) and Value (US$ Mn) Analysis and Forecast, by Market Taxonomy
21.7.1.1. By Packaging Format
21.7.1.2. By Material
21.7.1.3. By Chemical Type
21.8. U.K. Industrial Chemical Packaging Market Analysis 2021 & 2031
21.8.1. Market Volume (Mn Units) and Value (US$ Mn) Analysis and Forecast, by Market Taxonomy
21.8.1.1. By Packaging Format
21.8.1.2. By Material
21.8.1.3. By Chemical Type
21.9. Spain Industrial Chemical Packaging Market Analysis 2021 & 2031
21.9.1. Market Volume (Mn Units) and Value (US$ Mn) Analysis and Forecast, by Market Taxonomy
21.9.1.1. By Packaging Format
21.9.1.2. By Material
21.9.1.3. By Chemical Type
21.10. Russia Industrial Chemical Packaging Market Analysis 2021 & 2031
21.10.1. Market Volume (Mn Units) and Value (US$ Mn) Analysis and Forecast, by Market Taxonomy
21.10.1.1. By Packaging Format
21.10.1.2. By Material
21.10.1.3. By Chemical Type
21.11. GCC Countries Industrial Chemical Packaging Market Analysis 2021 & 2031
21.11.1. Market Volume (Mn Units) and Value (US$ Mn) Analysis and Forecast, by Market Taxonomy
21.11.1.1. By Packaging Format
21.11.1.2. By Material
21.11.1.3. By Chemical Type
21.12. Turkey Industrial Chemical Packaging Market Analysis 2021 & 2031
21.12.1. Market Volume (Mn Units) and Value (US$ Mn) Analysis and Forecast, by Market Taxonomy
21.12.1.1. By Packaging Format
21.12.1.2. By Material
21.12.1.3. By Chemical Type
21.13. China Industrial Chemical Packaging Market Analysis 2021 & 2031
21.13.1. Market Volume (Mn Units) and Value (US$ Mn) Analysis and Forecast, by Market Taxonomy
21.13.1.1. By Packaging Format
21.13.1.2. By Material
21.13.1.3. By Chemical Type
21.14. Japan Industrial Chemical Packaging Market Analysis 2021 & 2031
21.14.1. Market Volume (Mn Units) and Value (US$ Mn) Analysis and Forecast, by Market Taxonomy
21.14.1.1. By Packaging Format
21.14.1.2. By Material
21.14.1.3. By Chemical Type
21.15. India Industrial Chemical Packaging Market Analysis 2021 & 2031
21.15.1. Market Volume (Mn Units) and Value (US$ Mn) Analysis and Forecast, by Market Taxonomy
21.15.1.1. By Packaging Format
21.15.1.2. By Material
21.15.1.3. By Chemical Type
21.16. Australia Industrial Chemical Packaging Market Analysis 2021 & 2031
21.16.1. Market Volume (Mn Units) and Value (US$ Mn) Analysis and Forecast, by Market Taxonomy
21.16.1.1. By Packaging Format
21.16.1.2. By Material
21.16.1.3. By Chemical Type
22. Market Structure Analysis
22.1. Market Analysis, by Tier of Industrial Chemical Packaging Companies
22.2. Market Share Analysis of Top Players
22.3. Market Presence Analysis
23. Competition Analysis
23.1. Competition Dashboard
23.2. Competition Benchmarking
23.3. Competition Deep Dive
(Global Market Players)
23.3.1. ProAmpac
23.3.1.1. Overview
23.3.1.2. Product Portfolio
23.3.1.3. Profitability by Market Segments
23.3.1.4. Sales Footprint
23.3.1.5. Strategy Overview
23.3.1.5.1. Marketing Strategy
23.3.1.5.2. Product Strategy
23.3.1.5.3. Channel Strategy
23.3.2. Tote Systems International, LP
23.3.2.1. Overview
23.3.2.2. Product Portfolio
23.3.2.3. Profitability by Market Segments
23.3.2.4. Sales Footprint
23.3.2.5. Strategy Overview
23.3.2.5.1. Marketing Strategy
23.3.2.5.2. Product Strategy
23.3.2.5.3. Channel Strategy
23.3.3. US Display Group
23.3.3.1. Overview
23.3.3.2. Product Portfolio
23.3.3.3. Profitability by Market Segments
23.3.3.4. Sales Footprint
23.3.3.5. Strategy Overview
23.3.3.5.1. Marketing Strategy
23.3.3.5.2. Product Strategy
23.3.3.5.3. Channel Strategy
23.3.4. Myers Industries, Inc.
23.3.4.1. Overview
23.3.4.2. Product Portfolio
23.3.4.3. Profitability by Market Segments
23.3.4.4. Sales Footprint
23.3.4.5. Strategy Overview
23.3.4.5.1. Marketing Strategy
23.3.4.5.2. Product Strategy
23.3.4.5.3. Channel Strategy
23.3.5. Assmann Corp. of America
23.3.5.1. Overview
23.3.5.2. Product Portfolio
23.3.5.3. Profitability by Market Segments
23.3.5.4. Sales Footprint
23.3.5.5. Strategy Overview
23.3.5.5.1. Marketing Strategy
23.3.5.5.2. Product Strategy
23.3.5.5.3. Channel Strategy
23.3.6. DENIOS Ltd.
23.3.6.1. Overview
23.3.6.2. Product Portfolio
23.3.6.3. Profitability by Market Segments
23.3.6.4. Sales Footprint
23.3.6.5. Strategy Overview
23.3.6.5.1. Marketing Strategy
23.3.6.5.2. Product Strategy
23.3.6.5.3. Channel Strategy
23.3.7. Hoover CS
23.3.7.1. Overview
23.3.7.2. Product Portfolio
23.3.7.3. Profitability by Market Segments
23.3.7.4. Sales Footprint
23.3.7.5. Strategy Overview
23.3.7.5.1. Marketing Strategy
23.3.7.5.2. Product Strategy
23.3.7.5.3. Channel Strategy
23.3.8. Segezha Group GmbH
23.3.8.1. Overview
23.3.8.2. Product Portfolio
23.3.8.3. Profitability by Market Segments
23.3.8.4. Sales Footprint
23.3.8.5. Strategy Overview
23.3.8.5.1. Marketing Strategy
23.3.8.5.2. Product Strategy
23.3.8.5.3. Channel Strategy
23.3.9. CLA Containers
23.3.9.1. Overview
23.3.9.2. Product Portfolio
23.3.9.3. Profitability by Market Segments
23.3.9.4. Sales Footprint
23.3.9.5. Strategy Overview
23.3.9.5.1. Marketing Strategy
23.3.9.5.2. Product Strategy
23.3.9.5.3. Channel Strategy
23.3.10. Greif, Inc.
23.3.10.1. Overview
23.3.10.2. Product Portfolio
23.3.10.3. Profitability by Market Segments
23.3.10.4. Sales Footprint
23.3.10.5. Strategy Overview
23.3.10.5.1. Marketing Strategy
23.3.10.5.2. Product Strategy
23.3.10.5.3. Channel Strategy
23.3.11. RIKUTEC Group
23.3.11.1. Overview
23.3.11.2. Product Portfolio
23.3.11.3. Profitability by Market Segments
23.3.11.4. Sales Footprint
23.3.11.5. Strategy Overview
23.3.11.5.1. Marketing Strategy
23.3.11.5.2. Product Strategy
23.3.11.5.3. Channel Strategy
23.3.12. Müller Group
23.3.12.1. Overview
23.3.12.2. Product Portfolio
23.3.12.3. Profitability by Market Segments
23.3.12.4. Sales Footprint
23.3.12.5. Strategy Overview
23.3.12.5.1. Marketing Strategy
23.3.12.5.2. Product Strategy
23.3.12.5.3. Channel Strategy
23.3.13. Knack Packaging Private Limited
23.3.13.1. Overview
23.3.13.2. Product Portfolio
23.3.13.3. Profitability by Market Segments
23.3.13.4. Sales Footprint
23.3.13.5. Strategy Overview
23.3.13.5.1. Marketing Strategy
23.3.13.5.2. Product Strategy
23.3.13.5.3. Channel Strategy
23.3.14. Mauser Group B.V.
23.3.14.1. Overview
23.3.14.2. Product Portfolio
23.3.14.3. Profitability by Market Segments
23.3.14.4. Sales Footprint
23.3.14.5. Strategy Overview
23.3.14.5.1. Marketing Strategy
23.3.14.5.2. Product Strategy
23.3.14.5.3. Channel Strategy
23.3.15. PVN Fabrics Pvt. Ltd.
23.3.15.1. Overview
23.3.15.2. Product Portfolio
23.3.15.3. Profitability by Market Segments
23.3.15.4. Sales Footprint
23.3.15.5. Strategy Overview
23.3.15.5.1. Marketing Strategy
23.3.15.5.2. Product Strategy
23.3.15.5.3. Channel Strategy
23.3.16. Time Technoplast Ltd.
23.3.16.1. Overview
23.3.16.2. Product Portfolio
23.3.16.3. Profitability by Market Segments
23.3.16.4. Sales Footprint
23.3.16.5. Strategy Overview
23.3.16.5.1. Marketing Strategy
23.3.16.5.2. Product Strategy
23.3.16.5.3. Channel Strategy
23.3.17. Pyramid Technoplast Pvt Ltd.
23.3.17.1. Overview
23.3.17.2. Product Portfolio
23.3.17.3. Profitability by Market Segments
23.3.17.4. Sales Footprint
23.3.17.5. Strategy Overview
23.3.17.5.1. Marketing Strategy
23.3.17.5.2. Product Strategy
23.3.17.5.3. Channel Strategy
23.3.18. Tripura Containers Private Limited
23.3.18.1. Overview
23.3.18.2. Product Portfolio
23.3.18.3. Profitability by Market Segments
23.3.18.4. Sales Footprint
23.3.18.5. Strategy Overview
23.3.18.5.1. Marketing Strategy
23.3.18.5.2. Product Strategy
23.3.18.5.3. Channel Strategy
23.3.19. East India Drums & Barrels Mfg. Co.
23.3.19.1. Overview
23.3.19.2. Product Portfolio
23.3.19.3. Profitability by Market Segments
23.3.19.4. Sales Footprint
23.3.19.5. Strategy Overview
23.3.19.5.1. Marketing Strategy
23.3.19.5.2. Product Strategy
23.3.19.5.3. Channel Strategy
23.3.20. Schuetz GmbH & Co. KGaA
23.3.20.1. Overview
23.3.20.2. Product Portfolio
23.3.20.3. Profitability by Market Segments
23.3.20.4. Sales Footprint
23.3.20.5. Strategy Overview
23.3.20.5.1. Marketing Strategy
23.3.20.5.2. Product Strategy
23.3.20.5.3. Channel Strategy
*The above list is indicative in nature and is subject to change during the course of research
24. Assumptions and Acronyms Used
25. Research Methodology
Let us know your requirement to get
100% FREE customization
List of Tables
Table 01: Global Industrial Chemical Packaging Market Value (US$ Mn) by Packaging Format, 2015H-2031F
Table 02: Global Industrial Chemical Packaging Market Value (US$ Mn) by Packaging Format, 2015H-2031F
Table 03: Global Industrial Chemical Packaging Market Volume (Mn Units) by Packaging Format, 2015H-2031F
Table 04: Global Industrial Chemical Packaging Market Volume (Mn Units) by Packaging Format, 2015H-2031F
Table 05: Global Industrial Chemical Packaging Market Value (US$ Mn) by Material, 2015H-2031F
Table 06: Global Industrial Chemical Packaging Market Value (US$ Mn) by Material, 2015H-2031F
Table 07: Global Industrial Chemical Packaging Market Volume (Mn Units) by Material, 2015H-2031F
Table 08: Global Industrial Chemical Packaging Market Volume (Mn Units) by Material, 2015H-2031F
Table 09: Global Industrial Chemical Packaging Market Value (US$ Mn) by Chemical Type, 2015H-2031F
Table 10: Global Industrial Chemical Packaging Market Value (US$ Mn) by Chemical Type, 2015H-2031F
Table 11: Global Industrial Chemical Packaging Market Volume (Mn Units) by Chemical Type, 2015H-2031F
Table 12: Global Industrial Chemical Packaging Market Volume (Mn Units) by Chemical Type, 2015H-2031F
Table 13: Global Industrial Chemical Packaging Market Value (US$) by Region, 2015H-2031F
Table 14: Global Industrial Chemical Packaging Market Volume (Units) by Region, 2015H-2031F
Table 15: North America Industrial Chemical Packaging Market Value (US$ Mn) by Packaging Format, 2015H-2031F
Table 16: North America Industrial Chemical Packaging Market Value (US$ Mn) by Packaging Format, 2015H-2031F
Table 17: North America Industrial Chemical Packaging Market Volume (Mn Units) by Packaging Format, 2015H-2031F
Table 18: North America Industrial Chemical Packaging Market Volume (Mn Units) by Packaging Format, 2015H-2031F
Table 19: North America Industrial Chemical Packaging Market Value (US$ Mn) by Material, 2015H-2031F
Table 20: North America Industrial Chemical Packaging Market Value (US$ Mn) by Material, 2015H-2031F
Table 21: North America Industrial Chemical Packaging Market Volume (Mn Units) by Material, 2015H-2031F
Table 22: North America Industrial Chemical Packaging Market Volume (Mn Units) by Material, 2015H-2031F
Table 23: North America Industrial Chemical Packaging Market Value (US$ Mn) by Chemical Type, 2015H-2031F
Table 24: North America Industrial Chemical Packaging Market Value (US$ Mn) by Chemical Type, 2015H-2031F
Table 25: North America Industrial Chemical Packaging Market Volume (Mn Units) by Chemical Type, 2015H-2031F
Table 26: North America Industrial Chemical Packaging Market Volume (Mn Units) by Chemical Type, 2015H-2031F
Table 27: North America Industrial Chemical Packaging Market Value (US$ Mn) By Country, 2015H-2031F
Table 28: North America Industrial Chemical Packaging Market Volume (Mn Units) By Country, 2015H-2031F
Table 29: Latin America Industrial Chemical Packaging Market Value (US$ Mn) by Packaging Format, 2015H-2031F
Table 30: Latin America Industrial Chemical Packaging Market Value (US$ Mn) by Packaging Format, 2015H-2031F
Table 31: Latin America Industrial Chemical Packaging Market Volume (Mn Units) by Packaging Format, 2015H-2031F
Table 32: Latin America Industrial Chemical Packaging Market Volume (Mn Units) by Packaging Format, 2015H-2031F
Table 33: Latin America Industrial Chemical Packaging Market Value (US$ Mn) by Material, 2015H-2031F
Table 34: Latin America Industrial Chemical Packaging Market Value (US$ Mn) by Material, 2015H-2031F
Table 35: Latin America Industrial Chemical Packaging Market Volume (Mn Units) by Material, 2015H-2031F
Table 36: Latin America Industrial Chemical Packaging Market Volume (Mn Units) by Material, 2015H-2031F
Table 37: Latin America Industrial Chemical Packaging Market Value (US$ Mn) by Chemical Type, 2015H-2031F
Table 38: Latin America Industrial Chemical Packaging Market Value (US$ Mn) by Chemical Type, 2015H-2031F
Table 39: Latin America Industrial Chemical Packaging Market Volume (Mn Units) by Chemical Type, 2015H-2031F
Table 40: Latin America Industrial Chemical Packaging Market Volume (Mn Units) by Chemical Type, 2015H-2031F
Table 41: Latin America Industrial Chemical Packaging Market Value (US$ Mn) By Country, 2015H-2031F
Table 42: Latin America Industrial Chemical Packaging Market Volume (Mn Units) By Country, 2015H-2031F
Table 43: Europe Industrial Chemical Packaging Market Value (US$ Mn) by Packaging Format, 2015H-2031F
Table 44: Europe Industrial Chemical Packaging Market Value (US$ Mn) by Packaging Format, 2015H-2031F
Table 45: Europe Industrial Chemical Packaging Market Volume (Mn Units) by Packaging Format, 2015H-2031F
Table 46: Europe Industrial Chemical Packaging Market Volume (Mn Units) by Packaging Format, 2015H-2031F
Table 47: Europe Industrial Chemical Packaging Market Value (US$ Mn) by Material, 2015H-2031F
Table 48: Europe Industrial Chemical Packaging Market Value (US$ Mn) by Material, 2015H-2031F
Table 49: Europe Industrial Chemical Packaging Market Volume (Mn Units) by Material, 2015H-2031F
Table 50: Europe Industrial Chemical Packaging Market Volume (Mn Units) by Material, 2015H-2031F
Table 51: Europe Industrial Chemical Packaging Market Value (US$ Mn) by Chemical Type, 2015H-2031F
Table 52: Europe Industrial Chemical Packaging Market Value (US$ Mn) by Chemical Type, 2015H-2031F
Table 53: Europe Industrial Chemical Packaging Market Volume (Mn Units) by Chemical Type, 2015H-2031F
Table 54: Europe Industrial Chemical Packaging Market Volume (Mn Units) by Chemical Type, 2015H-2031F
Table 55: Europe Industrial Chemical Packaging Market Value (US$ Mn) By Country, 2015H-2031F
Table 56: Europe Industrial Chemical Packaging Market Volume (Mn Units) By Country, 2015H-2031F
Table 57: South Asia Industrial Chemical Packaging Market Value (US$ Mn) by Packaging Format, 2015H-2031F
Table 58: South Asia Industrial Chemical Packaging Market Value (US$ Mn) by Packaging Format, 2015H-2031F
Table 59: South Asia Industrial Chemical Packaging Market Volume (Mn Units) by Packaging Format, 2015H-2031F
Table 60: South Asia Industrial Chemical Packaging Market Volume (Mn Units) by Packaging Format, 2015H-2031F
Table 61: South Asia Industrial Chemical Packaging Market Value (US$ Mn) by Material, 2015H-2031F
Table 62: South Asia Industrial Chemical Packaging Market Value (US$ Mn) by Material, 2015H-2031F
Table 63: South Asia Industrial Chemical Packaging Market Volume (Mn Units) by Material, 2015H-2031F
Table 64: South Asia Industrial Chemical Packaging Market Volume (Mn Units) by Material, 2015H-2031F
Table 65: South Asia Industrial Chemical Packaging Market Value (US$ Mn) by Chemical Type, 2015H-2031F
Table 66: South Asia Industrial Chemical Packaging Market Value (US$ Mn) by Chemical Type, 2015H-2031F
Table 67: South Asia Industrial Chemical Packaging Market Volume (Mn Units) by Chemical Type, 2015H-2031F
Table 68: South Asia Industrial Chemical Packaging Market Volume (Mn Units) by Chemical Type, 2015H-2031F
Table 69: South Asia Industrial Chemical Packaging Market Value (US$ Mn) By Country, 2015H-2031F
Table 70: South Asia Industrial Chemical Packaging Market Volume (Mn Units) By Country, 2015H-2031F
Table 71: East Asia Industrial Chemical Packaging Market Value (US$ Mn) by Packaging Format, 2015H-2031F
Table 72: East Asia Industrial Chemical Packaging Market Value (US$ Mn) by Packaging Format, 2015H-2031F
Table 73: East Asia Industrial Chemical Packaging Market Volume (Mn Units) by Packaging Format, 2015H-2031F
Table 74: East Asia Industrial Chemical Packaging Market Volume (Mn Units) by Packaging Format, 2015H-2031F
Table 75: East Asia Industrial Chemical Packaging Market Value (US$ Mn) by Material, 2015H-2031F
Table 76: East Asia Industrial Chemical Packaging Market Value (US$ Mn) by Material, 2015H-2031F
Table 77: East Asia Industrial Chemical Packaging Market Volume (Mn Units) by Material, 2015H-2031F
Table 78: East Asia Industrial Chemical Packaging Market Volume (Mn Units) by Material, 2015H-2031F
Table 79: East Asia Industrial Chemical Packaging Market Value (US$ Mn) by Chemical Type, 2015H-2031F
Table 80: East Asia Industrial Chemical Packaging Market Value (US$ Mn) by Chemical Type, 2015H-2031F
Table 81: East Asia Industrial Chemical Packaging Market Volume (Mn Units) by Chemical Type, 2015H-2031F
Table 82: East Asia Industrial Chemical Packaging Market Volume (Mn Units) by Chemical Type, 2015H-2031F
Table 83: East Asia Industrial Chemical Packaging Market Value (US$ Mn) By Country, 2015H-2031F
Table 84: East Asia Industrial Chemical Packaging Market Volume (Mn Units) By Country, 2015H-2031F
Table 85: Oceania Industrial Chemical Packaging Market Value (US$ Mn) by Packaging Format, 2015H-2031F
Table 86: Oceania Industrial Chemical Packaging Market Value (US$ Mn) by Packaging Format, 2015H-2031F
Table 87: Oceania Industrial Chemical Packaging Market Volume (Mn Units) by Packaging Format, 2015H-2031F
Table 88: Oceania Industrial Chemical Packaging Market Volume (Mn Units) by Packaging Format, 2015H-2031F
Table 89: Oceania Industrial Chemical Packaging Market Value (US$ Mn) by Material, 2015H-2031F
Table 90: Oceania Industrial Chemical Packaging Market Value (US$ Mn) by Material, 2015H-2031F
Table 91: Oceania Industrial Chemical Packaging Market Volume (Mn Units) by Material, 2015H-2031F
Table 92: Oceania Industrial Chemical Packaging Market Volume (Mn Units) by Material, 2015H-2031F
Table 93: Oceania Industrial Chemical Packaging Market Value (US$ Mn) by Chemical Type, 2015H-2031F
Table 94: Oceania Industrial Chemical Packaging Market Value (US$ Mn) by Chemical Type, 2015H-2031F
Table 95: Oceania Industrial Chemical Packaging Market Volume (Mn Units) by Chemical Type, 2015H-2031F
Table 96: Oceania Industrial Chemical Packaging Market Volume (Mn Units) by Chemical Type, 2015H-2031F
Table 97: Oceania Industrial Chemical Packaging Market Value (US$ Mn) By Country, 2015H-2031F
Table 98: Oceania Industrial Chemical Packaging Market Volume (Mn Units) By Country, 2015H-2031F
Table 99: Middle East and Africa Industrial Chemical Packaging Market Value (US$ Mn) by Packaging Format, 2015H-2031F
Table 100: Middle East and Africa Industrial Chemical Packaging Market Value (US$ Mn) by Packaging Format, 2015H-2031F
Table 101: Middle East and Africa Industrial Chemical Packaging Market Volume (Mn Units) by Packaging Format, 2015H-2031F
Table 102: Middle East and Africa Industrial Chemical Packaging Market Volume (Mn Units) by Packaging Format, 2015H-2031F
Table 103: Middle East and Africa Industrial Chemical Packaging Market Value (US$ Mn) by Material, 2015H-2031F
Table 104: Middle East and Africa Industrial Chemical Packaging Market Value (US$ Mn) by Material, 2015H-2031F
Table 105: Middle East and Africa Industrial Chemical Packaging Market Volume (Mn Units) by Material, 2015H-2031F
Table 106: Middle East and Africa Industrial Chemical Packaging Market Volume (Mn Units) by Material, 2015H-2031F
Table 107: Middle East and Africa Industrial Chemical Packaging Market Value (US$ Mn) by Chemical Type, 2015H-2031F
Table 108: Middle East and Africa Industrial Chemical Packaging Market Value (US$ Mn) by Chemical Type, 2015H-2031F
Table 109: Middle East and Africa Industrial Chemical Packaging Market Volume (Mn Units) by Chemical Type, 2015H-2031F
Table 110: Middle East and Africa Industrial Chemical Packaging Market Volume (Mn Units) by Chemical Type, 2015H-2031F
Table 111: Middle East and Africa Industrial Chemical Packaging Market Value (US$ Mn) By Country, 2015H-2031F
Table 112: Middle East and Africa Industrial Chemical Packaging Market Volume (Mn Units) By Country, 2015H-2031
Find your sweet spots for generating winning opportunities in this market.
Talk to AnalystList of Charts
Figure 01: Global Industrial Chemical Packaging Market Share Analysis, by Packaging Format, 2021E & 2031F
Figure 03: Global Industrial Chemical Packaging Market Attractiveness Analysis, by Packaging Format, 2021E-2031F
Figure 02: Global Industrial Chemical Packaging Market Y-o-Y Analysis, by Packaging Format, 2019H-2031F
Figure 04: Global Industrial Chemical Packaging Market Share Analysis, by Material, 2021E & 2031F
Figure 05: Global Industrial Chemical Packaging Market Y-o-Y Analysis, by Material, 2019H-2031F
Figure 06: Global Industrial Chemical Packaging Market Attractiveness Analysis, by Material, 2021E-2031F
Figure 07: Global Industrial Chemical Packaging Market Share Analysis, by Chemical Type, 2021E & 2031F
Figure 08: Global Industrial Chemical Packaging Market Y-o-Y Analysis, by Chemical Type, 2019H-2031F
Figure 09: Global Industrial Chemical Packaging Market Attractiveness Analysis, by Chemical Type, 2021E-2031F
Figure 10: Global Industrial Chemical Packaging Market Share Analysis, by Region, 2021E & 2031F
Figure 11: Global Industrial Chemical Packaging Market Y-o-Y Analysis, by Region, 2019H-2031F
Figure 12: Global Industrial Chemical Packaging Market Attractiveness Analysis, by Region, 2021E-2031F
Figure 13: North America Industrial Chemical Packaging Market Share Analysis, by Packaging Format, 2021E & 2031F
Figure 14: North America Industrial Chemical Packaging Market Incremental Opportunity Analysis (US$ Mn), by Material, 2021(E)-2031(F)
Figure 15: North America Industrial Chemical Packaging Market Attractiveness Analysis, by Chemical Type, 2021E-2031F
Figure 16: North America Industrial Chemical Packaging Market Value Share Analysis, by Country 2021(E)
Figure 17: Latin America Industrial Chemical Packaging Market Share Analysis, by Packaging Format, 2021E & 2031F
Figure 18: Latin America Industrial Chemical Packaging Market Incremental Opportunity Analysis (US$ Mn), by Material, 2021(E)-2031(F)
Figure 19: Latin America Industrial Chemical Packaging Market Attractiveness Analysis, by Chemical Type, 2021E-2031F
Figure 20: Latin America Industrial Chemical Packaging Market Value Share Analysis, by Country 2021(E)
Figure 21: Europe Industrial Chemical Packaging Market Share Analysis, by Packaging Format, 2021E & 2031F
Figure 22: Europe Industrial Chemical Packaging Market Incremental Opportunity Analysis (US$ Mn), by Material, 2021(E)-2031(F)
Figure 23: Europe Industrial Chemical Packaging Market Attractiveness Analysis, by Chemical Type, 2021E-2031F
Figure 24: Europe Industrial Chemical Packaging Market Value Share Analysis, by Country 2021(E)
Figure 25: South Asia Industrial Chemical Packaging Market Share Analysis, by Packaging Format, 2021E & 2031F
Figure 26: South Asia Industrial Chemical Packaging Market Incremental Opportunity Analysis (US$ Mn), by Material, 2021(E)-2031(F)
Figure 27: South Asia Industrial Chemical Packaging Market Attractiveness Analysis, by Chemical Type, 2021E-2031F
Figure 28: South Asia Industrial Chemical Packaging Market Value Share Analysis, by Country 2021(E)
Figure 29: East Asia Industrial Chemical Packaging Market Share Analysis, by Packaging Format, 2021E & 2031F
Figure 30: East Asia Industrial Chemical Packaging Market Incremental Opportunity Analysis (US$ Mn), by Material, 2021(E)-2031(F)
Figure 31: East Asia Industrial Chemical Packaging Market Attractiveness Analysis, by Chemical Type, 2021E-2031F
Figure 32: East Asia Industrial Chemical Packaging Market Value Share Analysis, by Country 2021(E)
Figure 33: Oceania Industrial Chemical Packaging Market Share Analysis, by Packaging Format, 2021E & 2031F
Figure 34: Oceania Industrial Chemical Packaging Market Incremental Opportunity Analysis (US$ Mn), by Material, 2021(E)-2031(F)
Figure 35: Oceania Industrial Chemical Packaging Market Attractiveness Analysis, by Chemical Type, 2021E-2031F
Figure 36: Oceania Industrial Chemical Packaging Market Value Share Analysis, by Country 2021(E)
Figure 37: Middle East and Africa Industrial Chemical Packaging Market Share Analysis, by Packaging Format, 2021E & 2031F
Figure 38: Middle East and Africa Industrial Chemical Packaging Market Incremental Opportunity Analysis (US$ Mn), by Material, 2021(E)-2031(F)
Figure 39: Middle East and Africa Industrial Chemical Packaging Market Attractiveness Analysis, by Chemical Type, 2021E-2031F
Figure 40: Middle East and Africa Industrial Chemical Packaging Market Value Share Analysis, by Country 2021(E)
Figure 41: US Industrial Chemical Packaging Market Value Share Analysis, By Packaging Format, 2021(E) & 2031(F)
Figure 42: US Industrial Chemical Packaging Market Value Share Analysis, By Material, 2021(E) & 2031(F)
Figure 43: US Industrial Chemical Packaging Market Value Share Analysis, By Chemical Type, 2021(E) & 2031(F)
Figure 44: Canada Industrial Chemical Packaging Market Value Share Analysis, By Packaging Format, 2021(E) & 2031(F)
Figure 45: Canada Industrial Chemical Packaging Market Value Share Analysis, By Material, 2021(E) & 2031(F)
Figure 46: Canada Industrial Chemical Packaging Market Value Share Analysis, By Chemical Type, 2021(E) & 2031(F)
Figure 47: Brazil Industrial Chemical Packaging Market Value Share Analysis, By Packaging Format, 2021(E) & 2031(F)
Figure 48: Brazil Industrial Chemical Packaging Market Value Share Analysis, By Material, 2021(E) & 2031(F)
Figure 49: Brazil Industrial Chemical Packaging Market Value Share Analysis, By Chemical Type, 2021(E) & 2031(F)
Figure 50: Mexico Industrial Chemical Packaging Market Value Share Analysis, By Packaging Format, 2021(E) & 2031(F)
Figure 51: Mexico Industrial Chemical Packaging Market Value Share Analysis, By Material, 2021(E) & 2031(F)
Figure 52: Mexico Industrial Chemical Packaging Market Value Share Analysis, By Chemical Type, 2021(E) & 2031(F)
Figure 53: Germany Industrial Chemical Packaging Market Value Share Analysis, By Packaging Format, 2021(E) & 2031(F)
Figure 54: Germany Industrial Chemical Packaging Market Value Share Analysis, By Material, 2021(E) & 2031(F)
Figure 55: Germany Industrial Chemical Packaging Market Value Share Analysis, By Chemical Type, 2021(E) & 2031(F)
Figure 56: Italy Industrial Chemical Packaging Market Value Share Analysis, By Packaging Format, 2021(E) & 2031(F)
Figure 57: Italy Industrial Chemical Packaging Market Value Share Analysis, By Material, 2021(E) & 2031(F)
Figure 58: Italy Industrial Chemical Packaging Market Value Share Analysis, By Chemical Type, 2021(E) & 2031(F)
Figure 59: France Industrial Chemical Packaging Market Value Share Analysis, By Packaging Format, 2021(E) & 2031(F)
Figure 60: France Industrial Chemical Packaging Market Value Share Analysis, By Material, 2021(E) & 2031(F)
Figure 61: France Industrial Chemical Packaging Market Value Share Analysis, By Chemical Type, 2021(E) & 2031(F)
Figure 62: U.K. Industrial Chemical Packaging Market Value Share Analysis, By Packaging Format, 2021(E) & 2031(F)
Figure 63: U.K. Industrial Chemical Packaging Market Value Share Analysis, By Material, 2021(E) & 2031(F)
Figure 64: U.K. Industrial Chemical Packaging Market Value Share Analysis, By Chemical Type, 2021(E) & 2031(F)
Figure 65: Spain Industrial Chemical Packaging Market Value Share Analysis, By Packaging Format, 2021(E) & 2031(F)
Figure 66: Spain Industrial Chemical Packaging Market Value Share Analysis, By Material, 2021(E) & 2031(F)
Figure 67: Spain Industrial Chemical Packaging Market Value Share Analysis, By Chemical Type, 2021(E) & 2031(F)
Figure 68: Russia Industrial Chemical Packaging Market Value Share Analysis, By Packaging Format, 2021(E) & 2031(F)
Figure 69: Russia Industrial Chemical Packaging Market Value Share Analysis, By Material, 2021(E) & 2031(F)
Figure 70: Russia Industrial Chemical Packaging Market Value Share Analysis, By Chemical Type, 2021(E) & 2031(F)
Figure 71: GCC Countries Industrial Chemical Packaging Market Value Share Analysis, By Packaging Format, 2021(E) & 2031(F)
Figure 72: GCC Countries Industrial Chemical Packaging Market Value Share Analysis, By Material, 2021(E) & 2031(F)
Figure 73: GCC Countries Industrial Chemical Packaging Market Value Share Analysis, By Chemical Type, 2021(E) & 2031(F)
Figure 74: Turkey Industrial Chemical Packaging Market Value Share Analysis, By Packaging Format, 2021(E) & 2031(F)
Figure 75: Turkey Industrial Chemical Packaging Market Value Share Analysis, By Material, 2021(E) & 2031(F)
Figure 76: Turkey Industrial Chemical Packaging Market Value Share Analysis, By Chemical Type, 2021(E) & 2031(F)
Figure 77: China Industrial Chemical Packaging Market Value Share Analysis, By Packaging Format, 2021(E) & 2031(F)
Figure 78: China Industrial Chemical Packaging Market Value Share Analysis, By Material, 2021(E) & 2031(F)
Figure 79: China Industrial Chemical Packaging Market Value Share Analysis, By Chemical Type, 2021(E) & 2031(F)
Figure 80: Japan Industrial Chemical Packaging Market Value Share Analysis, By Packaging Format, 2021(E) & 2031(F)
Figure 81: Japan Industrial Chemical Packaging Market Value Share Analysis, By Material, 2021(E) & 2031(F)
Figure 82: Japan Industrial Chemical Packaging Market Value Share Analysis, By Chemical Type, 2021(E) & 2031(F)
Figure 83: India Industrial Chemical Packaging Market Value Share Analysis, By Packaging Format, 2021(E) & 2031(F)
Figure 84: India Industrial Chemical Packaging Market Value Share Analysis, By Material, 2021(E) & 2031(F)
Figure 85: India Industrial Chemical Packaging Market Value Share Analysis, By Chemical Type, 2021(E) & 2031(F)
Figure 86: Australia Industrial Chemical Packaging Market Value Share Analysis, By Packaging Format, 2021(E) & 2031(F)
Figure 87: Australia Industrial Chemical Packaging Market Value Share Analysis, By Material, 2021(E) & 2031(F)
Figure 88: Australia Industrial Chemical Packaging Market Value Share Analysis, By Chemical Type, 2021(E) & 2031(F)
Need specific information?
Request CustomizationExplore Packaging Insights
View Reports