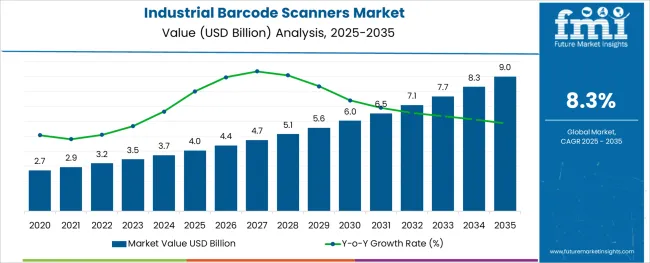
The Industrial Barcode Scanners Market is estimated to be valued at USD 4.0 billion in 2025 and is projected to reach USD 9.0 billion by 2035, registering a compound annual growth rate (CAGR) of 8.3% over the forecast period.
The industrial barcode scanners market is undergoing significant expansion as industries emphasize automation, real-time inventory tracking, and error-free identification processes. The rise of smart manufacturing and just-in-time supply chain models has amplified the demand for high-performance scanning solutions capable of operating in rugged, high-throughput environments.
Barcode scanners are being increasingly integrated with enterprise resource planning systems, warehouse management platforms, and IoT-enabled production lines. With operational efficiency, traceability, and worker productivity as top priorities, industrial end users are adopting advanced scanning technologies that offer speed, reliability, and minimal downtime.
The push toward Industry 4.0 has also accelerated the deployment of scanners with wireless connectivity, machine vision, and real-time diagnostics. As regulatory compliance and product serialization become more stringent across sectors such as automotive, electronics, and pharmaceuticals, the market is expected to benefit from continued innovation in scan engine design, housing durability, and intelligent data capture functionalities.
The market is segmented by Housing Type, Scanning Technology, and Industry Use and region. By Housing Type, the market is divided into Handheld, Stationary Industrial Barcode Scanner, and Other Industrial Barcode Scanner Types. In terms of Scanning Technology, the market is classified into Linear Imaging, Area Imaging, and Omni Directional.
Based on Industry Use, the market is segmented into Manufacturing, Food and Beverages, Retail, Transportation and Logistics, and Other Industry Uses. Regionally, the market is classified into North America, Latin America, Western Europe, Eastern Europe, Balkan & Baltic Countries, Russia & Belarus, Central Asia, East Asia, South Asia & Pacific, and the Middle East & Africa.
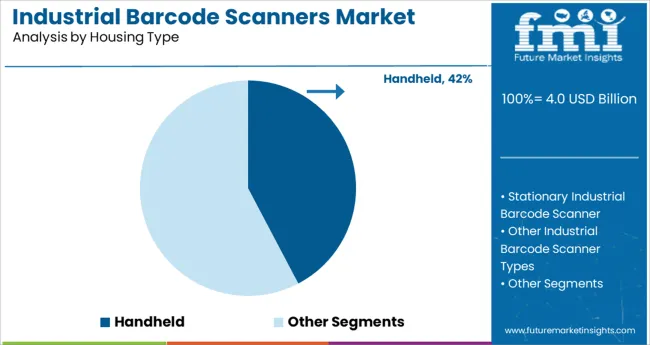
The handheld housing type is projected to account for 42.3% of revenue share in 2025, positioning it as the dominant form factor in the industrial barcode scanners market. This leadership is driven by the segment’s flexibility, ergonomic design, and suitability for dynamic work environments such as shop floors, warehouses, and assembly lines.
Handheld scanners offer enhanced mobility, allowing operators to scan items across varied sizes, shapes, and positions without requiring fixed installations. The growing use of ruggedized models with reinforced casings and resistance to dust, moisture, and drops has made handheld scanners particularly valuable in high-intensity industrial settings.
The integration of Bluetooth and Wi-Fi connectivity, along with long battery life and rapid decoding speeds, has further enhanced their operational value. As manufacturers continue prioritizing agile workflows and worker-friendly technologies, handheld scanners are expected to maintain a strong foothold in the housing type category.
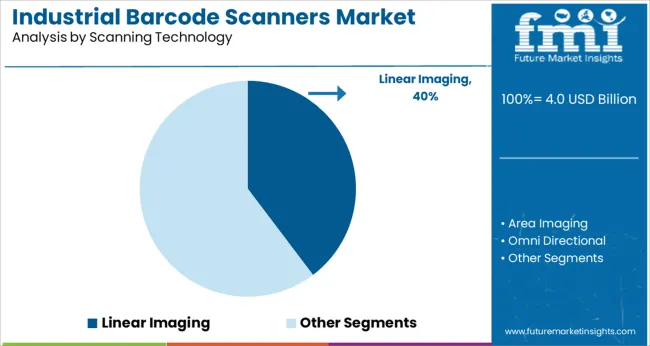
Linear imaging scanning technology is projected to contribute 39.7% of total market revenue in 2025, establishing it as the leading scanning method. This dominance is attributed to its ability to read poorly printed, damaged, or low-contrast barcodes with high precision, making it ideal for industrial environments where barcode quality may vary.
Unlike traditional laser scanners, linear imagers use advanced sensors and image-processing algorithms to capture barcodes in motion, thereby increasing throughput and reducing scan errors. Their durability and lack of moving parts result in lower maintenance requirements, which is essential for 24/7 industrial operations.
Additionally, linear imagers are more effective at reading from mobile screens and curved surfaces, broadening their use across production, packaging, and logistics. As industries move toward high-speed, camera-based data capture for better traceability, linear imaging is expected to continue leading the scanning technology segment.
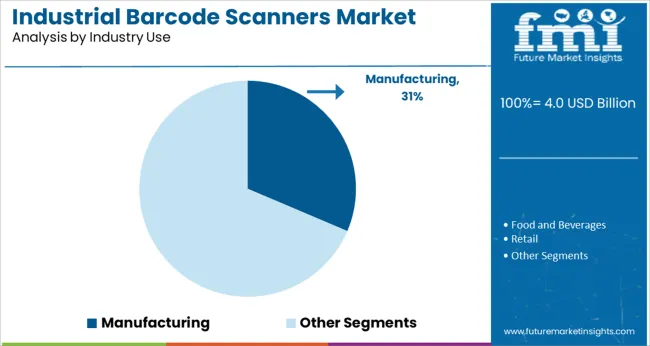
Manufacturing is expected to hold 31.4% of the total revenue share in 2025, making it the leading industry vertical in the industrial barcode scanners market. This dominance is driven by the sector’s ongoing digital transformation efforts, where real-time visibility, error reduction, and quality control are mission-critical.
Barcode scanners are widely used across production lines for component identification, process tracking, and finished goods verification. In response to lean manufacturing initiatives and compliance demands, manufacturers are deploying advanced scanning systems to enhance traceability and ensure accurate data logging.
The widespread implementation of automated material handling systems has also necessitated the use of industrial-grade scanners capable of operating in rugged and high-speed environments. Furthermore, the adoption of intelligent edge devices and machine vision in smart factories is integrating barcode scanners into broader data ecosystems. These drivers have solidified manufacturing as the primary industry use segment within the market.
The global demand for industrial barcode scanners is projected to increase at a CAGR of 8.3% during the forecast period between 2025 and 2035, reaching a total of USD 7,678.0 Million in 2035, according to a report from Future Market Insights (FMI). From 2020 to 2024, sales witnessed significant growth, registering a CAGR of 5.2%.
The adoption of barcode reader technology is expected to reduce the obstacles in supply as well as supervision of merchants in the sector in the years to come. This is likely to create a huge potential opportunity for the global barcode scanner market. In addition to that, barcode scanner technology is evolving at a rapid pace.
As such, barcode printing on most of the new goods that are read by barcode scanners is getting more common. As a consequence, the global barcode scanner industry is projected to boom in the coming years.
The proliferation of the retail sector due to mounting sales is predicted to garner handsome growth in the barcode scanner market over the 2025 to 2035 forecast period. Sport in the number of shopping malls and supermarkets in developing countries due to economic growth is indirectly fuelling the barcode scanner market.
High-volume sales in the retail sector that need to be handled electronically are spurring demand for barcode scanners. Function-wise, a barcode scanner is a core component for scanning and interpreting the data stored in a barcode.
Ushering in Digital Scanning Technology and Interpreting Inventory Data to Propel Growth
The industrial barcode scanner market is predicted to experience significant growth, due to the emergence of digital technologies for scanning and interpreting inventory of data, mainly in the retail and warehousing sector. Barcode scanners are becoming more popular in retail and warehousing industries due to their cutting-edge features and technological advantages. Furthermore, the advent of barcode technology is anticipated to reduce the difficulties in the tracking and supply of inventory for retailing and warehousing operations.
Advancements in barcode technology, along with its consistent improvement is another key factor spurring the uptake of the barcode scanner market. The increasing use of barcode technology as an impromptu identification system to reduce human errors will emerge as a chief growth propeller.
A growing number of multinational logistics service providers are another key factor fuelling the barcode scanner market. Moreover, the efficiency and effectiveness of operations of logistics provided by barcode scanners, resulting in nearly error-free tracking of inventory is spiraling the barcode scanner market. Bringing down the valuable time for tracking inventory in logistics operations is another key factor stoking the barcode scanner market.
Industry 4.0 is the current leverage of industries characterized by data exchange, automation, cloud, cyber-physical systems, robots, big data, artificial intelligence (AI), and (semi-) autonomous techniques. With the emergence of Industry 4.0, the market for barcode scanners is expected to witness an accelerated demand during the forecast period. The merging together of Industry 4.0 with devices, such as barcode and ring scanners, will continue and improve the efficiency of processes in inventory management.
Industries that use barcode scanning to great effect are manufacturing, retail, and logistics arms which augments growth in the industry. Ramping Up digitization in the midst of various industries is the primary factor driving the growth of the industrial barcode scanners market.
Amongst a cluster of industrial scanners present, 2D scanners prove their mettle over other scanners with 2D barcodes such as data matrices and QR codes highly deployed in the industry. Growth in the market is also secure with mobiles pitching in as the most trusted accessory closest to man, thus proving industry growth.
High Cost to Have a Telling Impact on Industrial Barcode Scanners Market
The high cost of Industrial barcode scanners is one of the major factors which may hinder the growth of the Industrial barcode scanners market. Moreover, the incompatibility with existing business systems and software is also a factor that may slow down the adoption of Industrial barcode scanners.
In October 2020, Honeywell International Inc. added Digimarc Barcode scanning capabilities to its handheld scanners in order to offer industry-leading performance and reliability for a wide range of applications.
In April 2020, Zebra Technologies launched its 3600 Ultra-rugged series of scanners. These scanners help the company to enhance durability, scan performance, and manageability of industrial verticals such as warehousing, retail, and manufacturing
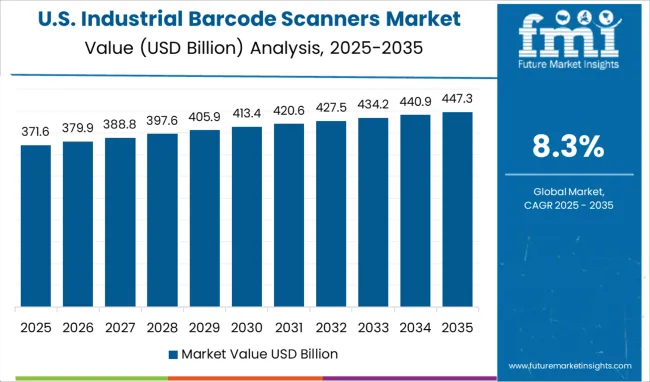
Automation trend to favor product data gathering in diverse manufacturing and retail sector
The North American industrial barcode scanners market is expected to accumulate a market share of 30.1% in 2025. On a geographic basis, North America is anticipated to be the largest market for Industrial barcode scanners market due to profound interest in automation solutions across various industries.
Smartphone sales are likely to increase, wireless communication technologies will proliferate, and the e-commerce sector will expand in the future years, all of which are projected to have a favorable impact on the industry. In the manufacturing and retail industries, barcode scanners are becoming highly popular such as Costco's, Carrefour's, and IKEA's. It has evolved into one of the most effective methods for gathering product data.
North America is the base for several manufacturing companies, such as General Motors and Ford. The region is expected to witness the increased adoption of industrial barcode scanners for operational activities. The significant investments in the automation of operations, through the integration of digitalized processes, will positively impact the demand for industrial barcode scanners from the region.
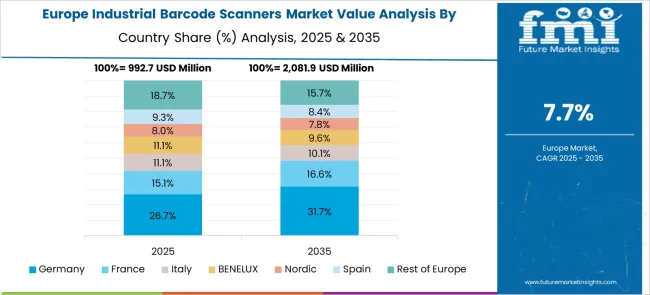
Digital Technologies to reaffirm growth in Europe
Europe is expected to accumulate a market share value of 21.5% in 2025 in the industrial barcode scanners market. Europe also offers potential growth opportunities in the Industrial barcode scanners market due to the rise in digital technologies in this region. Wireless connectivity and upward mobility of a 2D barcode reader are likely to create new opportunities for the market players of 2D barcode readers.
Nowadays, many 2D barcode readers can be connected to cell phones, mobile devices, and computers that have Bluetooth technology and can transmit data wirelessly.
This decreases the need for wired devices as it is cumbersome to carry out the billing process, which also profits with significant time-savings. Moreover, 2D barcode readers are able to read barcodes even from the screens of smartphones and thus prove to be useful for ticked events and couponing.
Manufacturing companies in Germany are very significant sectors. Several businesses are geared to adopt new and advanced technology in order to see positive growth and come to grips with the very competitive regional market. The adoption of 2D barcode scanners is enhancing in various business process optimization and gathering business intelligence.
Therefore, barcode readers are adopted in various industries due to their advantages like prevention of incorrect deliveries and reduced downtime. All these factors are expected to drive the growth of the 2D barcode scanner market in Europe.
Governments of many European counties like Germany are striving to improve the health care system. The healthcare system in Europe is very advanced, especially in relation to hospital beds, infrastructure, devices, advanced equipment, and trained staff. It also uses healthcare scanners such as wireless 1D and 2D barcode scanning.
Hence, 2D barcode readers are rapidly optimized and increasingly adopted across the healthcare sector in European countries. This gave rise to the growth of the industrial barcode scanners market decisively.
Handheld Industrial Barcode Scanners to beat Competition in Untiring Markets
From crude warehouse environments to even more testing manufacturing sites, rugged handheld, industrial-grade barcode scanners come across as the most deserving scanners to last through trying circumstances and provide superior scanning performance.
Encased in impact-ready water- and dust-resistant housings, scanners are built to tackle common challenges found in a variety of hostile environments. Whether you need a scanner for close-up, arm’s-length, or extended-range scanning, one has the ideal fit to improve scanning performance and reliability.
When you include rugged handheld scanners in your operation, you can maximize your return on investment and lower your overall cost of ownership.
Manufacturers are adopting various marketing strategies such as new product launches, geographical expansion, mergers and acquisitions, partnerships, and collaboration to identify the interest of potential buyers and create a larger customer base. For instance,
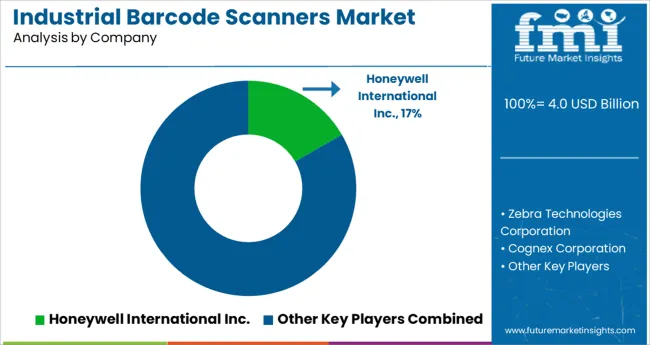
Prominent players in the industrial barcode scanners market are Honeywell International Inc., Zebra Technologies Corporation, Cognex Corporation, SATO Holdings Corporation, Toshiba TEC Corporation, Wasp Barcode Technologies, Datalogic S.P.A, Scandit AG, Juniper Systems and others.
Zebra Technologies Corporation is housed with a robust scanner embedded with a photographic eye. Its general-purpose scanners give store personnel the ability to provide great customer service with scanners that have extraordinary skills. Any type of code that comes their way - printed or electronic, torn or damaged - is read swiftly.
| Report Attribute | Details |
|---|---|
| Growth Rate | CAGR of 8.3% from 2025 to 2035 |
| Market Value in 2025 | USD 4.0 billion |
| Market Value in 2035 | USD 9.0 billion |
| Base Year for Estimation | 2024 |
| Historical Data | 2020 to 2024 |
| Forecast Period | 2025 to 2035 |
| Quantitative Units | Revenue in USD Billion and CAGR from 2025 to 2035 |
| Report Coverage | Revenue Forecast, Company Ranking, Competitive Landscape, Growth Factors, Trends, and Pricing Analysis |
| Segments Covered | Housing Type, Scanning Technology, Industry Use, Region |
| Regions Covered | North America; Latin America; Europe; Asia Pacific; Middle East and Africa |
| Key Countries Profiled | United States of America, Canada, Brazil, Mexico, Germany, United Kingdom, France, Spain, Italy, China, Japan, South Korea, Malaysia, Singapore, Australia, New Zealand, GCC Countries, South Africa, Israel |
| Key Companies Profiled | DENSO; JC Square Inc.; Toshiba TEC Corporation; Wasp Barcode Technologies; Scandit AG; SATO Holdings Corporation; Cognex Corporation; DataLogics S.P.A; Honeywell International Inc.; Zebra Technologies Corporation |
The global industrial barcode scanners market is estimated to be valued at USD 4.0 billion in 2025.
It is projected to reach USD 9.0 billion by 2035.
The market is expected to grow at a 8.3% CAGR between 2025 and 2035.
The key product types are handheld, stationary industrial barcode scanner and other industrial barcode scanner types.
linear imaging segment is expected to dominate with a 39.7% industry share in 2025.


Full Research Suite comprises of:
Market outlook & trends analysis
Interviews & case studies
Strategic recommendations
Vendor profiles & capabilities analysis
5-year forecasts
8 regions and 60+ country-level data splits
Market segment data splits
12 months of continuous data updates
DELIVERED AS:
PDF EXCEL ONLINE
Industrial Wired Routers Market Size and Share Forecast Outlook 2025 to 2035
Industrial Robot Controller Market Size and Share Forecast Outlook 2025 to 2035
Industrial Evaporative Condensers Market Size and Share Forecast Outlook 2025 to 2035
Industrial Energy Management System Market Size and Share Forecast Outlook 2025 to 2035
Industrial Insulation Market Size and Share Forecast Outlook 2025 to 2035
Industrial Safety Gloves Market Size and Share Forecast Outlook 2025 to 2035
Industrial Cleaner Market Size and Share Forecast Outlook 2025 to 2035
Industrial Dust Treatment System Market Size and Share Forecast Outlook 2025 to 2035
Industrial Vertical Washing Tower Market Size and Share Forecast Outlook 2025 to 2035
Industrial Pepper Market Size and Share Forecast Outlook 2025 to 2035
Industrial Electronics Packaging Market Forecast and Outlook 2025 to 2035
Industrial Absorbent Market Forecast and Outlook 2025 to 2035
Industrial Furnace Industry Analysis in Europe Forecast and Outlook 2025 to 2035
Industrial Denox System Market Size and Share Forecast Outlook 2025 to 2035
Industrial Electronic Pressure Switch Market Size and Share Forecast Outlook 2025 to 2035
Industrial WiFi Module Market Size and Share Forecast Outlook 2025 to 2035
Industrial Security System Market Forecast Outlook 2025 to 2035
Industrial Film Market Forecast Outlook 2025 to 2035
Industrial Floor Mat Market Forecast Outlook 2025 to 2035
Industrial Process Water Coolers Market Forecast and Outlook 2025 to 2035

Thank you!
You will receive an email from our Business Development Manager. Please be sure to check your SPAM/JUNK folder too.
Chat With
MaRIA