Industrial Alcohol Market
Market Insights on Industrial Alcohol covering sales outlook, demand forecast & up-to-date key trends
Industrial Alcohol Market by Source, Product Type, Application, Processing Method & Region - Forecast 2022 – 2032
Industrial Alcohol Market Outlook (2022-2032)
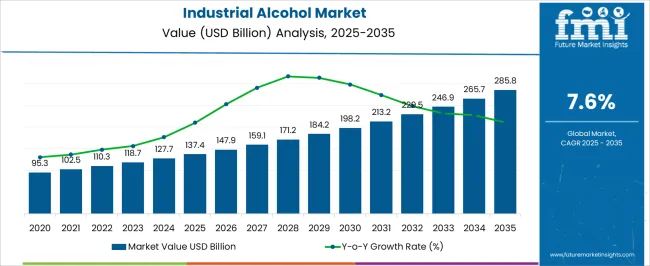
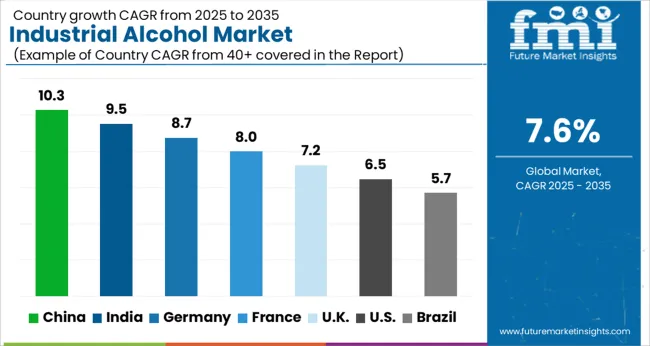
[300 Pages Report] The global industrial alcohol market size is set to be valued at US$ 110.3 Bn in 2022 and it is expected to grow at a CAGR of 7.6% from 2022 to 2032. The global market is projected to reach US$ 194.7 Bn by 2032.
Attributes |
Key Statistics |
Global Industrial Alcohol Market Estimated Size (2022E) |
US$ 110.3 Bn |
Projected Market Valuation (2032F) |
US$ 194.7 Bn |
Value-based CAGR (2022-2032) |
7.6% |
Collective Value Share: Top 3 Countries |
55.7% |
Let us know your requirement to get
100% FREE customization
2017-2021 Industrial Alcohol Demand Outlook Compared to 2022-2032 Forecast
Denatured alcohol is used in alcohol burners and camping stoves as a solvent and a fuel. A variety of denaturing and additive methods are used in the manufacturing of denatured alcohol, which is further utilizing in a wide range of applications, particularly in the industrial sector.
The most commonly used conventional additive is 10% methanol and methyl alcohol and hence it is called methylated spirits. Some of the other important additives include isopropyl alcohol, methyl ethyl ketone, acetone, and methyl isobutyl ketone.
In the U.S., denatured alcohol mixtures with a higher percentage of methanol are sold. In contrast to the biochemistry denaturation method, ethanol molecules remain intact and are not chemically altered during the denaturation process.
Rapid expansion of the E15 and flex-fuel infrastructure is expected to be largely pushed by the U.S. Department of Agriculture’s (USDA) Higher Blends Infrastructure Incentive Program (HBIIP), which provides fuel retailers with various resources to enable true fuel choice.
Spurred by the aforementioned factors, the global industrial alcohol market is expected to showcase a CAGR of 7.6% during 2022-2032, as compared to 6.2% CAGR exhibited in 2017-2021.
Country-wise Insights
Why is the Demand for Industrial Alcohol Increasing in the U.S.?
“Denatured Ethanol Manufacturers to Use Industrial Alcohol”
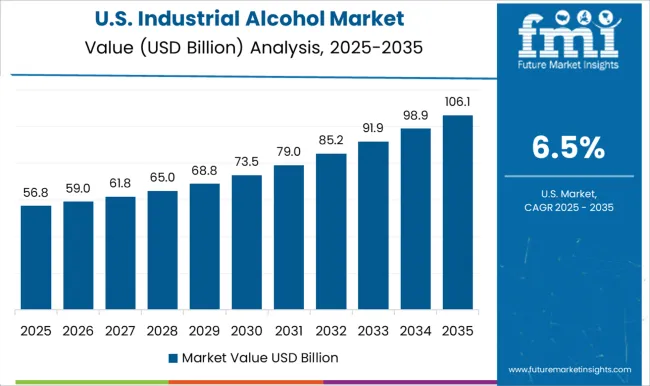
The U.S. holds more than 75.7% of share in the North America industrial alcohol market, which is predicted to increase at a CAGR of around 4.2% over the forecast period. In 2021, the U.S. held the highest share of the industrial alcohol market in North America, finds FMI.
Biogenic carbon dioxide, which is one of the industry's essential co-products that typically go unnoticed, received a lot of attention in 2020. A quarter of the U.S. ethanol plants capture CO2 and use it for various applications, right from beverage carbonation and wastewater treatment to meat processing and dry ice production.
With full potential, ethanol plants capture 3 to 3.5 million tons of CO2 per year, accounting for roughly 40% of the national supply. Ongoing development of innovative technologies for the production of ethanol is expected to push growth in the U.S.
Which Factors Are Stimulating the U.K. Industrial Alcohol Market?
“Leather Companies in the U.K. are Using Industrial Denatured Alcohol, Fueling Sales”
According to FMI, the U.K. is estimated to hold more than 17.2% of share in the Europe industrial alcohol market in 2022. It is expected to grow at a CAGR of around 5.3% in the forecast period.
Denatured alcohol serves a variety of functions for both small-scale applications and industrial applications in a wide range of end-use industries. As long as it has not been dyed, denatured alcohol is considered to be an ideal choice for use on leather products to kill mildew.
To avoid surface damage, it must be mixed equally with water for leather applications. Denatured alcohol as a cleaning agent can be used to remove dirt, paint, and debris from surface coatings. It also works well as a solvent for removing adhesives, oils, lubricants, and grime from a wide range of surfaces.
Excess adhesive or existing wax coatings on finished products such as furniture can be easily removed with a rag containing denatured alcohol. Rapid expansion of the industrial cleaners market in the U.K. is expected to create new growth opportunities for industrial alcohol manufacturers.
Why Are China and India Considered Fastest-Growing Markets for Industrial Alcohol?
“China and India Market to Benefit from Rising Industrial Alcohol Prices by Government Agencies”
China is dominating the East Asia industrial alcohol market and is currently holding a share of more than 32.5%. It is expected to grow at a CAGR of around 6.3% in the forecast period. In South Asia, on the other hand, India alcohol market is anticipated to remain at the forefront through 2032.
Rising crude oil prices is set to open new growth opportunities for biofuel manufacturers in both the countries. The Indian government is planning to surge ethanol production in the next decade.
The government has also increased its federal interest assistance scheme to facilitate new distillery capacity projects for manufacturing 5.2 million tons of ethanol annually. It has raised the prices of ethanol during December 2020-November 2021.
Find your sweet spots for generating winning opportunities in this market.
Talk to AnalystCategory-wise Insights
Which is the Leading Source of Industrial Alcohol?
“Industrial Alcohol Manufacturers to Utilize Corn as a Source”
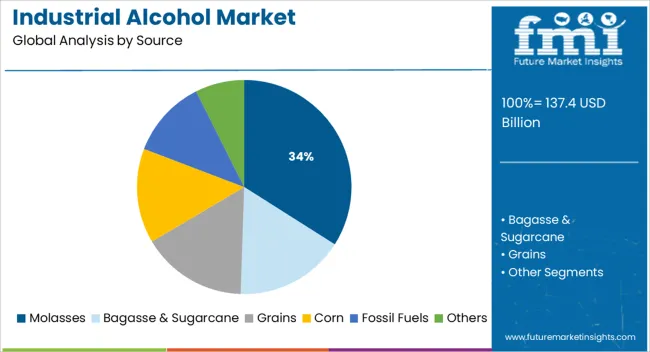
Based on source, the corn segment is set to dominate the global industrial alcohol market by holding more than 30.2% of share in 2022. It is expected to grow at a CAGR of around 4.2% over the forecast period, says FMI.
Ongoing development of the ethanol industry worldwide is expected to boost production of distillers grains and corn gluten meal. These are likely to be utilized as feedstock for biodiesel production or animal feed.
For instance, according to the Renewable Fuels Association (RFA), in 2020, ethanol producers in the U.S. generated 33.1 million metric tons (MMT) of distillers grains and gluten meal.
These bio-products are valuable protein-rich substitutes for corn, soybean meal, and other ingredients used to feed dairy cows, chickens, pigs, fish, turkeys, and other animals around the globe. These factors are likely to bolster the corn segment in the upcoming decade.
Which Product Type is Holding Maximum Share in the Global Industrial Alcohol Market?
“Preference for Ethyl Alcohol among Denatured Ethanol Manufacturers to Drive Growth”
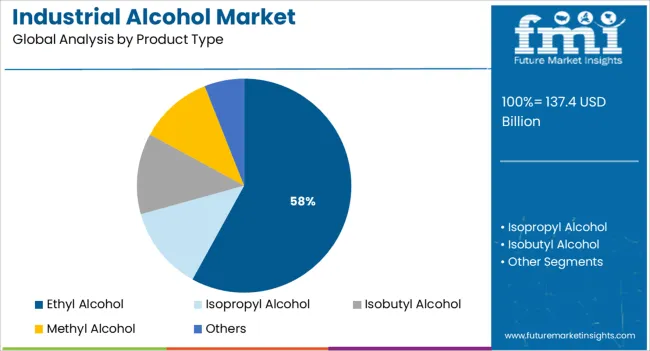
By product type, the ethyl alcohol segment is expected to dominate the global industrial alcohol market and hold more than 31.2% of share in 2022, finds FMI. It is expected to grow at a CAGR of around 3.9% over the forecast period.
Ethyl alcohol is a renewable fuel that can be blended with gasoline and has high octane content. Ethanol produced from various sources, including corn, potatoes, wheat, barley, sugar crops, and grain sorghum has the same chemical properties and is available in numerous forms.
The U.S. is considered to be a global leader in terms of corn-based ethanol production. Furthermore, increasing production of sugar in Brazil and several countries in Asia Pacific, including India and Indonesia is likely to drive the segment.
Besides, fermentation ability of sugar molasses makes them suitable for ethanol production. Sugarcane and its derivatives are the world's second-largest feedstock for ethanol production, followed by corn. Over the forecast period, Brazil is expected to be the largest producer of sugarcane-based ethanol.
Which is the Chief Application in Industrial Alcohol Market?
“Transportation Fuel Producers to Adopt Industrial Denatured Alcohol”
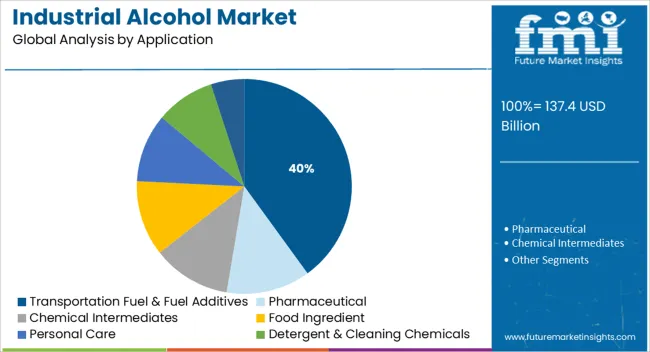
Based on application, the transportation fuel and fuel additives segment is expected to dominate the industrial alcohol market by holding more than 26.7% of share in 2022. As per FMI, it is expected to grow at a CAGR of around 4.3% over the forecast period.
Growth is mainly attributed to ongoing expansion of the automotive industry across the globe. Demand for gasoline-powered vehicles has increased significantly in Europe and Asia Pacific, which would also drive the segment.
Use of bioethanol in existing gasoline vehicles would benefit the environment as it generates fewer toxic elements than other fossil fuels such as fossil fuel-based gasoline and diesel. Besides, bioethanol can extend an engine's lifespan. Owing to increasing sales of flexible fuel vehicles, bioethanol manufacturers are expected to surge their production worldwide.
Competitive Landscape
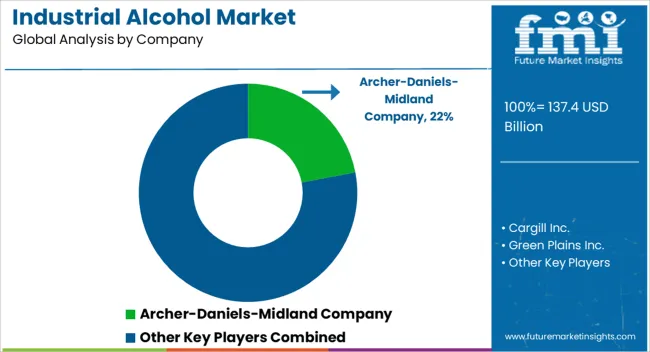
The global industrial alcohol market is highly fragmented due to the presence of various mid-sized and small competitors. Mergers and acquisitions, product innovations, and capacity expansions are some of the key strategies adopted by major players.
For instance,
- In July 2020, Green Plains Wood River LLC, a subsidiary of Green Plains Inc., announced the installation of a separate 25-million-gallon facility to produce Food Chemicals Codex (FCC) grade alcohol for export and domestic markets. The company is planning to expand its production capacity to produce United States Pharmacopeia (USP) grade alcohol within the next few months.

An unified Market Research Subscription Platform, built for today’s disparate research needs.
Scope of the Report
Attribute |
Details |
Estimated Market Size (2022) |
US$ 110.3 Bn |
Projected Market Valuation (2032) |
US$ 194.7 Bn |
Value-based CAGR (2022-2032) |
7.6% |
Forecast Period |
2022-2032 |
Historical Data Available for |
2017-2021 |
Market Analysis |
Value (US$ Bn) and Volume (MT) |
Key Regions Covered |
North America, Latin America, Europe, East Asia, South Asia, Oceania, and the Middle East & Africa |
Key Countries Covered |
US, Canada, Brazil, Mexico, Chile, Peru, Argentina, Germany, Italy, France, UK, Spain, BENELUX, Nordic, Russia, Poland, China, Japan, South Korea, India, Thailand, Indonesia, Malaysia, Singapore, Australia, New Zealand, GCC Countries, Turkey, South Africa, North Africa, and Central Africa |
Key Segments Covered |
Source, Product Type, Application, Processing Method, and Region |
Key Companies Profiled |
|
Report Coverage |
Market forecast, company share analysis, competition intelligence, DROT analysis, market dynamics and challenges, and strategic growth initiatives |
Industrial Alcohol Market Outlook by Category
By Source:
- Bagasse & Sugarcane
- Molasses
- Grains
- Corn
- Fossil Fuels
- Others
By Product Type:
- Ethyl Alcohol
- Isopropyl Alcohol
- Isobutyl Alcohol
- Methyl Alcohol
- Others
By Application:
- Pharmaceutical
- Transportation Fuel & Fuel Additives
- Chemical Intermediates
- Food Ingredient
- Personal Care
- Detergent & Cleaning Chemicals
- Others
By Processing Method:
- Fermentation
- Synthetic
By Region:
- North America
- Latin America
- Europe
- East Asia
- South Asia
- Oceania
- Middle East and Africa
Frequently Asked Questions
The global industrial alcohol market is expected to be valued at nearly US$ 110.3 Bn in 2022.
The North America industrial alcohol market is set to be valued at US$ 40.04 Bn in 2022 and is expected to grow at a CAGR of 4.3% over the forecast period.
Key manufacturers of industrial alcohol are Archer-Daniels-Midland Company, Cargill, Incorporated, MGP Ingredients, Inc., and Grain Processing Corporation.
The China industrial alcohol market is expected to grow at 6.3% CAGR between 2022 and 2032.
Table of Content
1. Executive Summary
1.1. Global Market Outlook
1.2. Demand-side Trends
1.3. Supply-side Trends
1.4. Technology Roadmap Analysis
1.5. Analysis and Recommendations
2. Market Overview
2.1. Market Coverage / Taxonomy
2.2. Market Definition / Scope / Limitations
3. Market Background
3.1. Market Dynamics
3.1.1. Drivers
3.1.2. Restraints
3.1.3. Opportunity
3.1.4. Trends
3.2. Scenario Forecast
3.2.1. Demand in Optimistic Scenario
3.2.2. Demand in Likely Scenario
3.2.3. Demand in Conservative Scenario
3.3. Product launches & Recent Developments
3.4. Product Life Cycle Analysis
3.5. Value Chain Analysis
3.5.1. Supply Side Participants and their Roles
3.5.1.1. Producers
3.5.1.2. Mid-Level Participants (Traders/ Agents/ Brokers)
3.5.1.3. Wholesalers and Distributors
3.5.2. % of Operating Margin Analysis
3.5.3. List of Raw Material Suppliers
3.5.4. List of Existing and Potential Buyer’s
3.6. Global Industrial Alcohol Market- Pricing Analysis
3.6.1. Price Point Assessment by Region
3.6.2. Price Point Assessment by Product Type
3.6.3. Price Forecast till 2032
3.6.4. Factors affecting Pricing
3.7. Forecast Factors - Relevance & Impact
3.8. PESTLE and Porter’s Analysis
3.9. Regulatory Landscape
3.9.1. Packaging & Labelling Regulations
3.9.2. Certifications and Certifying Agency Overview
3.9.3. Import/Export Policies
3.10. Regional Parent Market Outlook
3.11. Consumers Survey Analysis
3.12. Macro-Economic Factors
3.13. Product Claims & Nutritional Information Scan by Buyers
4. Global Industrial Alcohol Market Analysis 2017-2021 and Forecast, 2022-2032
4.1. Historical Market Size Value (US$ Bn) & Volume (MT) Analysis, 2017-2021
4.2. Current and Future Market Size Value (US$ Bn) & Volume (MT) Projections, 2022-2032
4.2.1. Y-o-Y Growth Trend Analysis
4.2.2. Absolute $ Opportunity Analysis
5. Global Industrial Alcohol Market Analysis 2017-2021 and Forecast 2022-2032, By Source
5.1. Introduction / Key Findings
5.2. Historical Market Size Value (US$ Bn) & Volume (MT) Analysis By Sources, 2017-2021
5.3. Current and Future Market Size Value (US$ Bn) & Volume (MT) Analysis and Forecast By Sources, 2022-2032
5.3.1. Bagasse & Sugarcane
5.3.2. Molasses
5.3.3. Grains
5.3.4. Corn
5.3.5. Fossil Fuels
5.3.6. Others
5.4. Y-o-Y Growth Trend Analysis By Sources, 2017-2021
5.5. Absolute $ Opportunity Analysis By Sources, 2022-2032
6. Global Industrial Alcohol Market Analysis 2017-2021 and Forecast 2022-2032, By Product Type
6.1. Introduction / Key Findings
6.2. Historical Market Size Value (US$ Bn) & Volume (MT) Analysis By Product Type, 2017-2021
6.3. Current and Future Market Size Value (US$ Bn) & Volume (MT) Analysis and Forecast By Product Type, 2022-2032
6.3.1. Ethyl Alcohol
6.3.2. Isopropyl Alcohol
6.3.3. Isobutyl Alcohol
6.3.4. Methyl Alcohol
6.3.5. Others
6.4. Y-o-Y Growth Trend Analysis By Product Type, 2017-2021
6.5. Absolute $ Opportunity Analysis By Product Type, 2022-2032
7. Global Industrial Alcohol Market Analysis 2017-2021 and Forecast 2022-2032, By Application
7.1. Introduction / Key Findings
7.2. Historical Market Size Value (US$ Bn) & Volume (MT) Analysis By Application, 2017-2021
7.3. Current and Future Market Size Value (US$ Bn) & Volume (MT) Analysis and Forecast By Application, 2022-2032
7.3.1. Pharmaceutical
7.3.2. Transportation Fuel & Fuel Additives
7.3.3. Chemical Intermediates
7.3.4. Food Ingredient
7.3.5. Personal Care
7.3.6. Detergent & Cleaning Chemicals
7.3.7. Others
7.4. Y-o-Y Growth Trend Analysis By Application, 2017-2021
7.5. Absolute $ Opportunity Analysis By Application, 2022-2032
8. Global Industrial Alcohol Market Analysis 2017-2021 and Forecast 2022-2032, By Processing Method
8.1. Introduction / Key Findings
8.2. Historical Market Size Value (US$ Bn) & Volume (MT) Analysis By Processing Method, 2017-2021
8.3. Current and Future Market Size Value (US$ Bn) & Volume (MT) Analysis and Forecast By Processing Method, 2022-2032
8.3.1. Fermentation
8.3.2. Synthetic
8.4. Y-o-Y Growth Trend Analysis By Processing Method, 2017-2021
8.5. Absolute $ Opportunity Analysis By Processing Method, 2022-2032
9. Global Industrial Alcohol Market Analysis 2017-2021 and Forecast 2022-2032, By Region
9.1. Introduction
9.2. Historical Market Size Value (US$ Bn) & Volume (MT) Analysis By Region, 2017-2021
9.3. Current Market Size Value (US$ Bn) & Volume (MT) Analysis and Forecast By Region, 2022-2032
9.3.1. North America
9.3.2. Latin America
9.3.3. Europe
9.3.4. East Asia
9.3.5. South Asia
9.3.6. Oceania
9.3.7. MEA
9.4. Market Attractiveness Analysis By Region
10. North America Industrial Alcohol Market Analysis 2017-2021 and Forecast 2022-2032, By Country
10.1. Historical Market Size Value (US$ Bn) & Volume (MT) Trend Analysis By Market Taxonomy, 2017-2021
10.2. Market Size Value (US$ Bn) & Volume (MT) Forecast By Market Taxonomy, 2022-2032
10.2.1. By Country
10.2.1.1. U.S.
10.2.1.2. Canada
10.2.2. By Sources
10.2.3. By Product Type
10.2.4. By Application
10.2.5. By Processing Method
10.3. Market Attractiveness Analysis
10.3.1. By Country
10.3.2. By Sources
10.3.3. By Product Type
10.3.4. By Application
10.3.5. By Processing Method
10.4. Key Takeaways
11. Latin America Industrial Alcohol Market Analysis 2017-2021 and Forecast 2022-2032, By Country
11.1. Historical Market Size Value (US$ Bn) & Volume (MT) Trend Analysis By Market Taxonomy, 2017-2021
11.2. Market Size Value (US$ Bn) & Volume (MT) Forecast By Market Taxonomy, 2022-2032
11.2.1. By Country
11.2.1.1. Brazil
11.2.1.2. Mexico
11.2.1.3. Argentina
11.2.1.4. Chile
11.2.1.5. Peru
11.2.1.6. Rest of Latin America
11.2.2. By Sources
11.2.3. By Product Type
11.2.4. By Application
11.2.5. By Processing Method
11.3. Market Attractiveness Analysis
11.3.1. By Country
11.3.2. By Sources
11.3.3. By Product Type
11.3.4. By Application
11.3.5. By Processing Method
11.4. Key Takeaways
12. Europe Industrial Alcohol Market Analysis 2017-2021 and Forecast 2022-2032, By Country
12.1. Historical Market Size Value (US$ Bn) & Volume (MT) Trend Analysis By Market Taxonomy, 2017-2021
12.2. Market Size Value (US$ Bn) & Volume (MT) Forecast By Market Taxonomy, 2022-2032
12.2.1. By Country
12.2.1.1. Germany
12.2.1.2. Italy
12.2.1.3. France
12.2.1.4. U.K.
12.2.1.5. Spain
12.2.1.6. Russia
12.2.1.7. BENELUX
12.2.1.8. Poland
12.2.1.9. Nordic Countries
12.2.1.10. Rest of Europe
12.2.2. By Sources
12.2.3. By Product Type
12.2.4. By Application
12.2.5. By Processing Method
12.3. Market Attractiveness Analysis
12.3.1. By Country
12.3.2. By Sources
12.3.3. By Product Type
12.3.4. By Application
12.3.5. By Processing Method
12.4. Key Takeaways
13. East Asia Industrial Alcohol Market Analysis 2017-2021 and Forecast 2022-2032, By Country
13.1. Historical Market Size Value (US$ Bn) & Volume (MT) Trend Analysis By Market Taxonomy, 2017-2021
13.2. Market Size Value (US$ Bn) & Volume (MT) Forecast By Market Taxonomy, 2022-2032
13.2.1. By Country
13.2.1.1. China
13.2.1.2. Japan
13.2.1.3. South Korea
13.2.2. By Sources
13.2.3. By Product Type
13.2.4. By Application
13.2.5. By Processing Method
13.3. Market Attractiveness Analysis
13.3.1. By Country
13.3.2. By Sources
13.3.3. By Product Type
13.3.4. By Application
13.3.5. By Processing Method
13.4. Key Takeaways
14. South Asia Industrial Alcohol Market Analysis 2017-2021 and Forecast 2022-2032, By Country
14.1. Historical Market Size Value (US$ Bn) & Volume (MT) Trend Analysis By Market Taxonomy, 2017-2021
14.2. Market Size Value (US$ Bn) & Volume (MT) Forecast By Market Taxonomy, 2022-2032
14.2.1. By Country
14.2.1.1. India
14.2.1.2. Thailand
14.2.1.3. Malaysia
14.2.1.4. Indonesia
14.2.1.5. Rest of South Asia
14.2.2. By Sources
14.2.3. By Product Type
14.2.4. By Application
14.2.5. By Processing Method
14.3. Market Attractiveness Analysis
14.3.1. By Country
14.3.2. By Sources
14.3.3. By Product Type
14.3.4. By Application
14.3.5. By Processing Method
14.4. Key Takeaways
15. Oceania Industrial Alcohol Market Analysis 2017-2021 and Forecast 2022-2032, By Country
15.1. Historical Market Size Value (US$ Bn) & Volume (MT) Trend Analysis By Market Taxonomy, 2017-2021
15.2. Market Size Value (US$ Bn) & Volume (MT) Forecast By Market Taxonomy, 2022-2032
15.2.1. By Country
15.2.1.1. Australia
15.2.1.2. New Zealand
15.2.2. By Sources
15.2.3. By Product Type
15.2.4. By Application
15.2.5. By Processing Method
15.3. Market Attractiveness Analysis
15.3.1. By Country
15.3.2. By Sources
15.3.3. By Product Type
15.3.4. By Application
15.3.5. By Processing Method
15.4. Key Takeaways
16. MEA Industrial Alcohol Market Analysis 2017-2021 and Forecast 2022-2032, By Country
16.1. Historical Market Size Value (US$ Bn) & Volume (MT) Trend Analysis By Market Taxonomy, 2017-2021
16.2. Market Size Value (US$ Bn) & Volume (MT) Forecast By Market Taxonomy, 2022-2032
16.2.1. By Country
16.2.1.1. GCC Countries
16.2.1.2. South Africa
16.2.1.3. Central Africa
16.2.1.4. North Africa
16.2.2. By Sources
16.2.3. By Product Type
16.2.4. By Application
16.2.5. By Processing Method
16.3. Market Attractiveness Analysis
16.3.1. By Country
16.3.2. By Sources
16.3.3. By Product Type
16.3.4. By Application
16.3.5. By Processing Method
16.4. Key Takeaways
17. Key Countries Industrial Alcohol Market Analysis
17.1. U.S.
17.1.1. Pricing Analysis
17.1.2. Market Share Analysis, 2021
17.1.2.1. By Sources
17.1.2.2. By Product Type
17.1.2.3. By Application
17.1.2.4. By Processing Method
17.2. Canada
17.2.1. Pricing Analysis
17.2.2. Market Share Analysis, 2021
17.2.2.1. By Sources
17.2.2.2. By Product Type
17.2.2.3. By Application
17.2.2.4. By Processing Method
17.3. Brazil
17.3.1. Pricing Analysis
17.3.2. Market Share Analysis, 2021
17.3.2.1. By Sources
17.3.2.2. By Product Type
17.3.2.3. By Application
17.3.2.4. By Processing Method
17.4. Mexico
17.4.1. Pricing Analysis
17.4.2. Market Share Analysis, 2021
17.4.2.1. By Sources
17.4.2.2. By Product Type
17.4.2.3. By Application
17.4.2.4. By Processing Method
17.5. Argentina
17.5.1. Pricing Analysis
17.5.2. Market Share Analysis, 2021
17.5.2.1. By Sources
17.5.2.2. By Product Type
17.5.2.3. By Application
17.5.2.4. By Processing Method
17.6. Chile
17.6.1. Pricing Analysis
17.6.2. Market Share Analysis, 2021
17.6.2.1. By Sources
17.6.2.2. By Product Type
17.6.2.3. By Application
17.6.2.4. By Processing Method
17.7. Peru
17.7.1. Pricing Analysis
17.7.2. Market Share Analysis, 2021
17.7.2.1. By Sources
17.7.2.2. By Product Type
17.7.2.3. By Application
17.7.2.4. By Processing Method
17.8. Germany
17.8.1. Pricing Analysis
17.8.2. Market Share Analysis, 2021
17.8.2.1. By Sources
17.8.2.2. By Product Type
17.8.2.3. By Application
17.8.2.4. By Processing Method
17.9. Italy
17.9.1. Pricing Analysis
17.9.2. Market Share Analysis, 2021
17.9.2.1. By Sources
17.9.2.2. By Product Type
17.9.2.3. By Application
17.9.2.4. By Processing Method
17.10. France
17.10.1. Pricing Analysis
17.10.2. Market Share Analysis, 2021
17.10.2.1. By Sources
17.10.2.2. By Product Type
17.10.2.3. By Application
17.10.2.4. By Processing Method
17.11. Spain
17.11.1. Pricing Analysis
17.11.2. Market Share Analysis, 2021
17.11.2.1. By Sources
17.11.2.2. By Product Type
17.11.2.3. By Application
17.11.2.4. By Processing Method
17.12. U.K.
17.12.1. Pricing Analysis
17.12.2. Market Share Analysis, 2021
17.12.2.1. By Sources
17.12.2.2. By Product Type
17.12.2.3. By Application
17.12.2.4. By Processing Method
17.13. Russia
17.13.1. Pricing Analysis
17.13.2. Market Share Analysis, 2021
17.13.2.1. By Sources
17.13.2.2. By Product Type
17.13.2.3. By Application
17.13.2.4. By Processing Method
17.14. Poland
17.14.1. Pricing Analysis
17.14.2. Market Share Analysis, 2021
17.14.2.1. By Sources
17.14.2.2. By Product Type
17.14.2.3. By Application
17.14.2.4. By Processing Method
17.15. BENELUX
17.15.1. Pricing Analysis
17.15.2. Market Share Analysis, 2021
17.15.2.1. By Sources
17.15.2.2. By Product Type
17.15.2.3. By Application
17.15.2.4. By Processing Method
17.16. Nordic Countries
17.16.1. Pricing Analysis
17.16.2. Market Share Analysis, 2021
17.16.2.1. By Sources
17.16.2.2. By Product Type
17.16.2.3. By Application
17.16.2.4. By Processing Method
17.17. China
17.17.1. Pricing Analysis
17.17.2. Market Share Analysis, 2021
17.17.2.1. By Sources
17.17.2.2. By Product Type
17.17.2.3. By Application
17.17.2.4. By Processing Method
17.18. Japan
17.18.1. Pricing Analysis
17.18.2. Market Share Analysis, 2021
17.18.2.1. By Sources
17.18.2.2. By Product Type
17.18.2.3. By Application
17.18.2.4. By Processing Method
17.19. South Korea
17.19.1. Pricing Analysis
17.19.2. Market Share Analysis, 2021
17.19.2.1. By Sources
17.19.2.2. By Product Type
17.19.2.3. By Application
17.19.2.4. By Processing Method
17.20. India
17.20.1. Pricing Analysis
17.20.2. Market Share Analysis, 2021
17.20.2.1. By Sources
17.20.2.2. By Product Type
17.20.2.3. By Application
17.20.2.4. By Processing Method
17.21. Thailand
17.21.1. Pricing Analysis
17.21.2. Market Share Analysis, 2021
17.21.2.1. By Sources
17.21.2.2. By Product Type
17.21.2.3. By Application
17.21.2.4. By Processing Method
17.22. Indonesia
17.22.1. Pricing Analysis
17.22.2. Market Share Analysis, 2021
17.22.2.1. By Sources
17.22.2.2. By Product Type
17.22.2.3. By Application
17.22.2.4. By Processing Method
17.23. Malaysia
17.23.1. Pricing Analysis
17.23.2. Market Share Analysis, 2021
17.23.2.1. By Sources
17.23.2.2. By Product Type
17.23.2.3. By Application
17.23.2.4. By Processing Method
17.24. Singapore
17.24.1. Pricing Analysis
17.24.2. Market Share Analysis, 2021
17.24.2.1. By Sources
17.24.2.2. By Product Type
17.24.2.3. By Application
17.24.2.4. By Processing Method
17.25. GCC Countries
17.25.1. Pricing Analysis
17.25.2. Market Share Analysis, 2021
17.25.2.1. By Sources
17.25.2.2. By Product Type
17.25.2.3. By Application
17.25.2.4. By Processing Method
17.26. South Africa
17.26.1. Pricing Analysis
17.26.2. Market Share Analysis, 2021
17.26.2.1. By Sources
17.26.2.2. By Product Type
17.26.2.3. By Application
17.26.2.4. By Processing Method
17.27. Central Africa
17.27.1. Pricing Analysis
17.27.2. Market Share Analysis, 2021
17.27.2.1. By Sources
17.27.2.2. By Product Type
17.27.2.3. By Application
17.27.2.4. By Processing Method
17.28. North Africa
17.28.1. Pricing Analysis
17.28.2. Market Share Analysis, 2021
17.28.2.1. By Sources
17.28.2.2. By Product Type
17.28.2.3. By Application
17.28.2.4. By Processing Method
18. Market Structure Analysis
18.1. Competition Dashboard
18.2. Competition Benchmarking
18.3. Market Share Analysis of Top Players
18.3.1. By Regional
18.3.2. By Sources
18.3.3. By Product Type
18.3.4. By Application
18.3.5. By Processing Method
19. Competition Analysis
19.1. Competition Deep Dive
19.1.1. Cargill Inc.
19.1.1.1. Overview
19.1.1.2. Product Portfolio
19.1.1.3. Profitability by Market Segments (Product/Age /Sales Channel/Region)
19.1.1.4. Sales Footprint
19.1.1.5. Strategy Overview
19.1.1.5.1. Marketing Strategy
19.1.1.5.2. Product Strategy
19.1.1.5.3. Channel Strategy
19.1.2. Archer-Daniels-Midland Company
19.1.2.1. Overview
19.1.2.2. Product Portfolio
19.1.2.3. Profitability by Market Segments (Product/Age /Sales Channel/Region)
19.1.2.4. Sales Footprint
19.1.2.5. Strategy Overview
19.1.2.5.1. Marketing Strategy
19.1.2.5.2. Product Strategy
19.1.2.5.3. Channel Strategy
19.1.3. Green Plains Inc.
19.1.3.1. Overview
19.1.3.2. Product Portfolio
19.1.3.3. Profitability by Market Segments (Product/Age /Sales Channel/Region)
19.1.3.4. Sales Footprint
19.1.3.5. Strategy Overview
19.1.3.5.1. Marketing Strategy
19.1.3.5.2. Product Strategy
19.1.3.5.3. Channel Strategy
19.1.4. Grain Millers Inc.
19.1.4.1. Overview
19.1.4.2. Product Portfolio
19.1.4.3. Profitability by Market Segments (Product/Age /Sales Channel/Region)
19.1.4.4. Sales Footprint
19.1.4.5. Strategy Overview
19.1.4.5.1. Marketing Strategy
19.1.4.5.2. Product Strategy
19.1.4.5.3. Channel Strategy
19.1.5. Willmar Group
19.1.5.1. Overview
19.1.5.2. Product Portfolio
19.1.5.3. Profitability by Market Segments (Product/Age /Sales Channel/Region)
19.1.5.4. Sales Footprint
19.1.5.5. Strategy Overview
19.1.5.5.1. Marketing Strategy
19.1.5.5.2. Product Strategy
19.1.5.5.3. Channel Strategy
19.1.6. MGP Ingredients, Inc.
19.1.6.1. Overview
19.1.6.2. Product Portfolio
19.1.6.3. Profitability by Market Segments (Product/Age /Sales Channel/Region)
19.1.6.4. Sales Footprint
19.1.6.5. Strategy Overview
19.1.6.5.1. Marketing Strategy
19.1.6.5.2. Product Strategy
19.1.6.5.3. Channel Strategy
19.1.7. Cristalco
19.1.7.1. Overview
19.1.7.2. Product Portfolio
19.1.7.3. Profitability by Market Segments (Product/Age /Sales Channel/Region)
19.1.7.4. Sales Footprint
19.1.7.5. Strategy Overview
19.1.7.5.1. Marketing Strategy
19.1.7.5.2. Product Strategy
19.1.7.5.3. Channel Strategy
19.1.8. Royal Dutch Shell Plc
19.1.8.1. Overview
19.1.8.2. Product Portfolio
19.1.8.3. Profitability by Market Segments (Product/Age /Sales Channel/Region)
19.1.8.4. Sales Footprint
19.1.8.5. Strategy Overview
19.1.8.5.1. Marketing Strategy
19.1.8.5.2. Product Strategy
19.1.8.5.3. Channel Strategy
19.1.9. Raizen Energia
19.1.9.1. Overview
19.1.9.2. Product Portfolio
19.1.9.3. Profitability by Market Segments (Product/Age /Sales Channel/Region)
19.1.9.4. Sales Footprint
19.1.9.5. Strategy Overview
19.1.9.5.1. Marketing Strategy
19.1.9.5.2. Product Strategy
19.1.9.5.3. Channel Strategy
19.1.10. GREENFIELD SPECIALTY ALCOHOLS
19.1.10.1. Overview
19.1.10.2. Product Portfolio
19.1.10.3. Profitability by Market Segments (Product/Age /Sales Channel/Region)
19.1.10.4. Sales Footprint
19.1.10.5. Strategy Overview
19.1.10.5.1. Marketing Strategy
19.1.10.5.2. Product Strategy
19.1.10.5.3. Channel Strategy
19.1.11. Flinyt Hill Resources
19.1.11.1. Overview
19.1.11.2. Product Portfolio
19.1.11.3. Profitability by Market Segments (Product/Age /Sales Channel/Region)
19.1.11.4. Sales Footprint
19.1.11.5. Strategy Overview
19.1.11.5.1. Marketing Strategy
19.1.11.5.2. Product Strategy
19.1.11.5.3. Channel Strategy
19.1.12. Sigma Aldrich
19.1.12.1. Overview
19.1.12.2. Product Portfolio
19.1.12.3. Profitability by Market Segments (Product/Age /Sales Channel/Region)
19.1.12.4. Sales Footprint
19.1.12.5. Strategy Overview
19.1.12.5.1. Marketing Strategy
19.1.12.5.2. Product Strategy
19.1.12.5.3. Channel Strategy
19.1.13. Univar Solutions
19.1.13.1. Overview
19.1.13.2. Product Portfolio
19.1.13.3. Profitability by Market Segments (Product/Age /Sales Channel/Region)
19.1.13.4. Sales Footprint
19.1.13.5. Strategy Overview
19.1.13.5.1. Marketing Strategy
19.1.13.5.2. Product Strategy
19.1.13.5.3. Channel Strategy
19.1.14. Linde Plc
19.1.14.1. Overview
19.1.14.2. Product Portfolio
19.1.14.3. Profitability by Market Segments (Product/Age /Sales Channel/Region)
19.1.14.4. Sales Footprint
19.1.14.5. Strategy Overview
19.1.14.5.1. Marketing Strategy
19.1.14.5.2. Product Strategy
19.1.14.5.3. Channel Strategy
19.1.15. Dow Chemical Company
19.1.15.1. Overview
19.1.15.2. Product Portfolio
19.1.15.3. Profitability by Market Segments (Product/Age /Sales Channel/Region)
19.1.15.4. Sales Footprint
19.1.15.5. Strategy Overview
19.1.15.5.1. Marketing Strategy
19.1.15.5.2. Product Strategy
19.1.15.5.3. Channel Strategy
19.1.16. Other (on additional request)
20. Assumptions & Acronyms Used
21. Research Methodology
Let us know your requirement to get
100% FREE customization
List of Tables
Table 1: Global Industrial Alcohol Market Value (US$ Bn) Forecast by Region, 2017-2032
Table 2: Global Industrial Alcohol Market Volume (MT) Forecast by Region, 2017-2032
Table 3: Global Industrial Alcohol Market Value (US$ Bn) Forecast by Sources, 2017-2032
Table 4: Global Industrial Alcohol Market Volume (MT) Forecast by Sources, 2017-2032
Table 5: Global Industrial Alcohol Market Value (US$ Bn) Forecast by Product Type, 2017-2032
Table 6: Global Industrial Alcohol Market Volume (MT) Forecast by Product Type, 2017-2032
Table 7: Global Industrial Alcohol Market Value (US$ Bn) Forecast by Application, 2017-2032
Table 8: Global Industrial Alcohol Market Volume (MT) Forecast by Application, 2017-2032
Table 9: Global Industrial Alcohol Market Value (US$ Bn) Forecast by Processing Method, 2017-2032
Table 10: Global Industrial Alcohol Market Volume (MT) Forecast by Processing Method, 2017-2032
Table 11: North America Industrial Alcohol Market Value (US$ Bn) Forecast by Country, 2017-2032
Table 12: North America Industrial Alcohol Market Volume (MT) Forecast by Country, 2017-2032
Table 13: North America Industrial Alcohol Market Value (US$ Bn) Forecast by Sources, 2017-2032
Table 14: North America Industrial Alcohol Market Volume (MT) Forecast by Sources, 2017-2032
Table 15: North America Industrial Alcohol Market Value (US$ Bn) Forecast by Product Type, 2017-2032
Table 16: North America Industrial Alcohol Market Volume (MT) Forecast by Product Type, 2017-2032
Table 17: North America Industrial Alcohol Market Value (US$ Bn) Forecast by Application, 2017-2032
Table 18: North America Industrial Alcohol Market Volume (MT) Forecast by Application, 2017-2032
Table 19: North America Industrial Alcohol Market Value (US$ Bn) Forecast by Processing Method, 2017-2032
Table 20: North America Industrial Alcohol Market Volume (MT) Forecast by Processing Method, 2017-2032
Table 21: Latin America Industrial Alcohol Market Value (US$ Bn) Forecast by Country, 2017-2032
Table 22: Latin America Industrial Alcohol Market Volume (MT) Forecast by Country, 2017-2032
Table 23: Latin America Industrial Alcohol Market Value (US$ Bn) Forecast by Sources, 2017-2032
Table 24: Latin America Industrial Alcohol Market Volume (MT) Forecast by Sources, 2017-2032
Table 25: Latin America Industrial Alcohol Market Value (US$ Bn) Forecast by Product Type, 2017-2032
Table 26: Latin America Industrial Alcohol Market Volume (MT) Forecast by Product Type, 2017-2032
Table 27: Latin America Industrial Alcohol Market Value (US$ Bn) Forecast by Application, 2017-2032
Table 28: Latin America Industrial Alcohol Market Volume (MT) Forecast by Application, 2017-2032
Table 29: Latin America Industrial Alcohol Market Value (US$ Bn) Forecast by Processing Method, 2017-2032
Table 30: Latin America Industrial Alcohol Market Volume (MT) Forecast by Processing Method, 2017-2032
Table 31: Europe Industrial Alcohol Market Value (US$ Bn) Forecast by Country, 2017-2032
Table 32: Europe Industrial Alcohol Market Volume (MT) Forecast by Country, 2017-2032
Table 33: Europe Industrial Alcohol Market Value (US$ Bn) Forecast by Sources, 2017-2032
Table 34: Europe Industrial Alcohol Market Volume (MT) Forecast by Sources, 2017-2032
Table 35: Europe Industrial Alcohol Market Value (US$ Bn) Forecast by Product Type, 2017-2032
Table 36: Europe Industrial Alcohol Market Volume (MT) Forecast by Product Type, 2017-2032
Table 37: Europe Industrial Alcohol Market Value (US$ Bn) Forecast by Application, 2017-2032
Table 38: Europe Industrial Alcohol Market Volume (MT) Forecast by Application, 2017-2032
Table 39: Europe Industrial Alcohol Market Value (US$ Bn) Forecast by Processing Method, 2017-2032
Table 40: Europe Industrial Alcohol Market Volume (MT) Forecast by Processing Method, 2017-2032
Table 41: East Asia Industrial Alcohol Market Value (US$ Bn) Forecast by Country, 2017-2032
Table 42: East Asia Industrial Alcohol Market Volume (MT) Forecast by Country, 2017-2032
Table 43: East Asia Industrial Alcohol Market Value (US$ Bn) Forecast by Sources, 2017-2032
Table 44: East Asia Industrial Alcohol Market Volume (MT) Forecast by Sources, 2017-2032
Table 45: East Asia Industrial Alcohol Market Value (US$ Bn) Forecast by Product Type, 2017-2032
Table 46: East Asia Industrial Alcohol Market Volume (MT) Forecast by Product Type, 2017-2032
Table 47: East Asia Industrial Alcohol Market Value (US$ Bn) Forecast by Application, 2017-2032
Table 48: East Asia Industrial Alcohol Market Volume (MT) Forecast by Application, 2017-2032
Table 49: East Asia Industrial Alcohol Market Value (US$ Bn) Forecast by Processing Method, 2017-2032
Table 50: East Asia Industrial Alcohol Market Volume (MT) Forecast by Processing Method, 2017-2032
Table 51: South Asia Industrial Alcohol Market Value (US$ Bn) Forecast by Country, 2017-2032
Table 52: South Asia Industrial Alcohol Market Volume (MT) Forecast by Country, 2017-2032
Table 53: South Asia Industrial Alcohol Market Value (US$ Bn) Forecast by Sources, 2017-2032
Table 54: South Asia Industrial Alcohol Market Volume (MT) Forecast by Sources, 2017-2032
Table 55: South Asia Industrial Alcohol Market Value (US$ Bn) Forecast by Product Type, 2017-2032
Table 56: South Asia Industrial Alcohol Market Volume (MT) Forecast by Product Type, 2017-2032
Table 57: South Asia Industrial Alcohol Market Value (US$ Bn) Forecast by Application, 2017-2032
Table 58: South Asia Industrial Alcohol Market Volume (MT) Forecast by Application, 2017-2032
Table 59: South Asia Industrial Alcohol Market Value (US$ Bn) Forecast by Processing Method, 2017-2032
Table 60: South Asia Industrial Alcohol Market Volume (MT) Forecast by Processing Method, 2017-2032
Table 61: Oceania Industrial Alcohol Market Value (US$ Bn) Forecast by Country, 2017-2032
Table 62: Oceania Industrial Alcohol Market Volume (MT) Forecast by Country, 2017-2032
Table 63: Oceania Industrial Alcohol Market Value (US$ Bn) Forecast by Sources, 2017-2032
Table 64: Oceania Industrial Alcohol Market Volume (MT) Forecast by Sources, 2017-2032
Table 65: Oceania Industrial Alcohol Market Value (US$ Bn) Forecast by Product Type, 2017-2032
Table 66: Oceania Industrial Alcohol Market Volume (MT) Forecast by Product Type, 2017-2032
Table 67: Oceania Industrial Alcohol Market Value (US$ Bn) Forecast by Application, 2017-2032
Table 68: Oceania Industrial Alcohol Market Volume (MT) Forecast by Application, 2017-2032
Table 69: Oceania Industrial Alcohol Market Value (US$ Bn) Forecast by Processing Method, 2017-2032
Table 70: Oceania Industrial Alcohol Market Volume (MT) Forecast by Processing Method, 2017-2032
Table 71: MEA Industrial Alcohol Market Value (US$ Bn) Forecast by Country, 2017-2032
Table 72: MEA Industrial Alcohol Market Volume (MT) Forecast by Country, 2017-2032
Table 73: MEA Industrial Alcohol Market Value (US$ Bn) Forecast by Sources, 2017-2032
Table 74: MEA Industrial Alcohol Market Volume (MT) Forecast by Sources, 2017-2032
Table 75: MEA Industrial Alcohol Market Value (US$ Bn) Forecast by Product Type, 2017-2032
Table 76: MEA Industrial Alcohol Market Volume (MT) Forecast by Product Type, 2017-2032
Table 77: MEA Industrial Alcohol Market Value (US$ Bn) Forecast by Application, 2017-2032
Table 78: MEA Industrial Alcohol Market Volume (MT) Forecast by Application, 2017-2032
Table 79: MEA Industrial Alcohol Market Value (US$ Bn) Forecast by Processing Method, 2017-2032
Table 80: MEA Industrial Alcohol Market Volume (MT) Forecast by Processing Method, 2017-2032
Find your sweet spots for generating winning opportunities in this market.
Talk to AnalystList of Charts
Figure 1: Global Industrial Alcohol Market Value (US$ Bn) by Sources, 2022-2032
Figure 2: Global Industrial Alcohol Market Value (US$ Bn) by Product Type, 2022-2032
Figure 3: Global Industrial Alcohol Market Value (US$ Bn) by Application, 2022-2032
Figure 4: Global Industrial Alcohol Market Value (US$ Bn) by Processing Method, 2022-2032
Figure 5: Global Industrial Alcohol Market Value (US$ Bn) by Region, 2022-2032
Figure 6: Global Industrial Alcohol Market Value (US$ Bn) Analysis by Region, 2017-2032
Figure 7: Global Industrial Alcohol Market Volume (MT) Analysis by Region, 2017-2032
Figure 8: Global Industrial Alcohol Market Value Share (%) and BPS Analysis by Region, 2022-2032
Figure 9: Global Industrial Alcohol Market Y-o-Y Growth (%) Projections by Region, 2022-2032
Figure 10: Global Industrial Alcohol Market Value (US$ Bn) Analysis by Sources, 2017-2032
Figure 11: Global Industrial Alcohol Market Volume (MT) Analysis by Sources, 2017-2032
Figure 12: Global Industrial Alcohol Market Value Share (%) and BPS Analysis by Sources, 2022-2032
Figure 13: Global Industrial Alcohol Market Y-o-Y Growth (%) Projections by Sources, 2022-2032
Figure 14: Global Industrial Alcohol Market Value (US$ Bn) Analysis by Product Type, 2017-2032
Figure 15: Global Industrial Alcohol Market Volume (MT) Analysis by Product Type, 2017-2032
Figure 16: Global Industrial Alcohol Market Value Share (%) and BPS Analysis by Product Type, 2022-2032
Figure 17: Global Industrial Alcohol Market Y-o-Y Growth (%) Projections by Product Type, 2022-2032
Figure 18: Global Industrial Alcohol Market Value (US$ Bn) Analysis by Application, 2017-2032
Figure 19: Global Industrial Alcohol Market Volume (MT) Analysis by Application, 2017-2032
Figure 20: Global Industrial Alcohol Market Value Share (%) and BPS Analysis by Application, 2022-2032
Figure 21: Global Industrial Alcohol Market Y-o-Y Growth (%) Projections by Application, 2022-2032
Figure 22: Global Industrial Alcohol Market Value (US$ Bn) Analysis by Processing Method, 2017-2032
Figure 23: Global Industrial Alcohol Market Volume (MT) Analysis by Processing Method, 2017-2032
Figure 24: Global Industrial Alcohol Market Value Share (%) and BPS Analysis by Processing Method, 2022-2032
Figure 25: Global Industrial Alcohol Market Y-o-Y Growth (%) Projections by Processing Method, 2022-2032
Figure 26: Global Industrial Alcohol Market Attractiveness by Sources, 2022-2032
Figure 27: Global Industrial Alcohol Market Attractiveness by Product Type, 2022-2032
Figure 28: Global Industrial Alcohol Market Attractiveness by Application, 2022-2032
Figure 29: Global Industrial Alcohol Market Attractiveness by Processing Method, 2022-2032
Figure 30: Global Industrial Alcohol Market Attractiveness by Region, 2022-2032
Figure 31: North America Industrial Alcohol Market Value (US$ Bn) by Sources, 2022-2032
Figure 32: North America Industrial Alcohol Market Value (US$ Bn) by Product Type, 2022-2032
Figure 33: North America Industrial Alcohol Market Value (US$ Bn) by Application, 2022-2032
Figure 34: North America Industrial Alcohol Market Value (US$ Bn) by Processing Method, 2022-2032
Figure 35: North America Industrial Alcohol Market Value (US$ Bn) by Country, 2022-2032
Figure 36: North America Industrial Alcohol Market Value (US$ Bn) Analysis by Country, 2017-2032
Figure 37: North America Industrial Alcohol Market Volume (MT) Analysis by Country, 2017-2032
Figure 38: North America Industrial Alcohol Market Value Share (%) and BPS Analysis by Country, 2022-2032
Figure 39: North America Industrial Alcohol Market Y-o-Y Growth (%) Projections by Country, 2022-2032
Figure 40: North America Industrial Alcohol Market Value (US$ Bn) Analysis by Sources, 2017-2032
Figure 41: North America Industrial Alcohol Market Volume (MT) Analysis by Sources, 2017-2032
Figure 42: North America Industrial Alcohol Market Value Share (%) and BPS Analysis by Sources, 2022-2032
Figure 43: North America Industrial Alcohol Market Y-o-Y Growth (%) Projections by Sources, 2022-2032
Figure 44: North America Industrial Alcohol Market Value (US$ Bn) Analysis by Product Type, 2017-2032
Figure 45: North America Industrial Alcohol Market Volume (MT) Analysis by Product Type, 2017-2032
Figure 46: North America Industrial Alcohol Market Value Share (%) and BPS Analysis by Product Type, 2022-2032
Figure 47: North America Industrial Alcohol Market Y-o-Y Growth (%) Projections by Product Type, 2022-2032
Figure 48: North America Industrial Alcohol Market Value (US$ Bn) Analysis by Application, 2017-2032
Figure 49: North America Industrial Alcohol Market Volume (MT) Analysis by Application, 2017-2032
Figure 50: North America Industrial Alcohol Market Value Share (%) and BPS Analysis by Application, 2022-2032
Figure 51: North America Industrial Alcohol Market Y-o-Y Growth (%) Projections by Application, 2022-2032
Figure 52: North America Industrial Alcohol Market Value (US$ Bn) Analysis by Processing Method, 2017-2032
Figure 53: North America Industrial Alcohol Market Volume (MT) Analysis by Processing Method, 2017-2032
Figure 54: North America Industrial Alcohol Market Value Share (%) and BPS Analysis by Processing Method, 2022-2032
Figure 55: North America Industrial Alcohol Market Y-o-Y Growth (%) Projections by Processing Method, 2022-2032
Figure 56: North America Industrial Alcohol Market Attractiveness by Sources, 2022-2032
Figure 57: North America Industrial Alcohol Market Attractiveness by Product Type, 2022-2032
Figure 58: North America Industrial Alcohol Market Attractiveness by Application, 2022-2032
Figure 59: North America Industrial Alcohol Market Attractiveness by Processing Method, 2022-2032
Figure 60: North America Industrial Alcohol Market Attractiveness by Country, 2022-2032
Figure 61: Latin America Industrial Alcohol Market Value (US$ Bn) by Sources, 2022-2032
Figure 62: Latin America Industrial Alcohol Market Value (US$ Bn) by Product Type, 2022-2032
Figure 63: Latin America Industrial Alcohol Market Value (US$ Bn) by Application, 2022-2032
Figure 64: Latin America Industrial Alcohol Market Value (US$ Bn) by Processing Method, 2022-2032
Figure 65: Latin America Industrial Alcohol Market Value (US$ Bn) by Country, 2022-2032
Figure 66: Latin America Industrial Alcohol Market Value (US$ Bn) Analysis by Country, 2017-2032
Figure 67: Latin America Industrial Alcohol Market Volume (MT) Analysis by Country, 2017-2032
Figure 68: Latin America Industrial Alcohol Market Value Share (%) and BPS Analysis by Country, 2022-2032
Figure 69: Latin America Industrial Alcohol Market Y-o-Y Growth (%) Projections by Country, 2022-2032
Figure 70: Latin America Industrial Alcohol Market Value (US$ Bn) Analysis by Sources, 2017-2032
Figure 71: Latin America Industrial Alcohol Market Volume (MT) Analysis by Sources, 2017-2032
Figure 72: Latin America Industrial Alcohol Market Value Share (%) and BPS Analysis by Sources, 2022-2032
Figure 73: Latin America Industrial Alcohol Market Y-o-Y Growth (%) Projections by Sources, 2022-2032
Figure 74: Latin America Industrial Alcohol Market Value (US$ Bn) Analysis by Product Type, 2017-2032
Figure 75: Latin America Industrial Alcohol Market Volume (MT) Analysis by Product Type, 2017-2032
Figure 76: Latin America Industrial Alcohol Market Value Share (%) and BPS Analysis by Product Type, 2022-2032
Figure 77: Latin America Industrial Alcohol Market Y-o-Y Growth (%) Projections by Product Type, 2022-2032
Figure 78: Latin America Industrial Alcohol Market Value (US$ Bn) Analysis by Application, 2017-2032
Figure 79: Latin America Industrial Alcohol Market Volume (MT) Analysis by Application, 2017-2032
Figure 80: Latin America Industrial Alcohol Market Value Share (%) and BPS Analysis by Application, 2022-2032
Figure 81: Latin America Industrial Alcohol Market Y-o-Y Growth (%) Projections by Application, 2022-2032
Figure 82: Latin America Industrial Alcohol Market Value (US$ Bn) Analysis by Processing Method, 2017-2032
Figure 83: Latin America Industrial Alcohol Market Volume (MT) Analysis by Processing Method, 2017-2032
Figure 84: Latin America Industrial Alcohol Market Value Share (%) and BPS Analysis by Processing Method, 2022-2032
Figure 85: Latin America Industrial Alcohol Market Y-o-Y Growth (%) Projections by Processing Method, 2022-2032
Figure 86: Latin America Industrial Alcohol Market Attractiveness by Sources, 2022-2032
Figure 87: Latin America Industrial Alcohol Market Attractiveness by Product Type, 2022-2032
Figure 88: Latin America Industrial Alcohol Market Attractiveness by Application, 2022-2032
Figure 89: Latin America Industrial Alcohol Market Attractiveness by Processing Method, 2022-2032
Figure 90: Latin America Industrial Alcohol Market Attractiveness by Country, 2022-2032
Figure 91: Europe Industrial Alcohol Market Value (US$ Bn) by Sources, 2022-2032
Figure 92: Europe Industrial Alcohol Market Value (US$ Bn) by Product Type, 2022-2032
Figure 93: Europe Industrial Alcohol Market Value (US$ Bn) by Application, 2022-2032
Figure 94: Europe Industrial Alcohol Market Value (US$ Bn) by Processing Method, 2022-2032
Figure 95: Europe Industrial Alcohol Market Value (US$ Bn) by Country, 2022-2032
Figure 96: Europe Industrial Alcohol Market Value (US$ Bn) Analysis by Country, 2017-2032
Figure 97: Europe Industrial Alcohol Market Volume (MT) Analysis by Country, 2017-2032
Figure 98: Europe Industrial Alcohol Market Value Share (%) and BPS Analysis by Country, 2022-2032
Figure 99: Europe Industrial Alcohol Market Y-o-Y Growth (%) Projections by Country, 2022-2032
Figure 100: Europe Industrial Alcohol Market Value (US$ Bn) Analysis by Sources, 2017-2032
Figure 101: Europe Industrial Alcohol Market Volume (MT) Analysis by Sources, 2017-2032
Figure 102: Europe Industrial Alcohol Market Value Share (%) and BPS Analysis by Sources, 2022-2032
Figure 103: Europe Industrial Alcohol Market Y-o-Y Growth (%) Projections by Sources, 2022-2032
Figure 104: Europe Industrial Alcohol Market Value (US$ Bn) Analysis by Product Type, 2017-2032
Figure 105: Europe Industrial Alcohol Market Volume (MT) Analysis by Product Type, 2017-2032
Figure 106: Europe Industrial Alcohol Market Value Share (%) and BPS Analysis by Product Type, 2022-2032
Figure 107: Europe Industrial Alcohol Market Y-o-Y Growth (%) Projections by Product Type, 2022-2032
Figure 108: Europe Industrial Alcohol Market Value (US$ Bn) Analysis by Application, 2017-2032
Figure 109: Europe Industrial Alcohol Market Volume (MT) Analysis by Application, 2017-2032
Figure 110: Europe Industrial Alcohol Market Value Share (%) and BPS Analysis by Application, 2022-2032
Figure 111: Europe Industrial Alcohol Market Y-o-Y Growth (%) Projections by Application, 2022-2032
Figure 112: Europe Industrial Alcohol Market Value (US$ Bn) Analysis by Processing Method, 2017-2032
Figure 113: Europe Industrial Alcohol Market Volume (MT) Analysis by Processing Method, 2017-2032
Figure 114: Europe Industrial Alcohol Market Value Share (%) and BPS Analysis by Processing Method, 2022-2032
Figure 115: Europe Industrial Alcohol Market Y-o-Y Growth (%) Projections by Processing Method, 2022-2032
Figure 116: Europe Industrial Alcohol Market Attractiveness by Sources, 2022-2032
Figure 117: Europe Industrial Alcohol Market Attractiveness by Product Type, 2022-2032
Figure 118: Europe Industrial Alcohol Market Attractiveness by Application, 2022-2032
Figure 119: Europe Industrial Alcohol Market Attractiveness by Processing Method, 2022-2032
Figure 120: Europe Industrial Alcohol Market Attractiveness by Country, 2022-2032
Figure 121: East Asia Industrial Alcohol Market Value (US$ Bn) by Sources, 2022-2032
Figure 122: East Asia Industrial Alcohol Market Value (US$ Bn) by Product Type, 2022-2032
Figure 123: East Asia Industrial Alcohol Market Value (US$ Bn) by Application, 2022-2032
Figure 124: East Asia Industrial Alcohol Market Value (US$ Bn) by Processing Method, 2022-2032
Figure 125: East Asia Industrial Alcohol Market Value (US$ Bn) by Country, 2022-2032
Figure 126: East Asia Industrial Alcohol Market Value (US$ Bn) Analysis by Country, 2017-2032
Figure 127: East Asia Industrial Alcohol Market Volume (MT) Analysis by Country, 2017-2032
Figure 128: East Asia Industrial Alcohol Market Value Share (%) and BPS Analysis by Country, 2022-2032
Figure 129: East Asia Industrial Alcohol Market Y-o-Y Growth (%) Projections by Country, 2022-2032
Figure 130: East Asia Industrial Alcohol Market Value (US$ Bn) Analysis by Sources, 2017-2032
Figure 131: East Asia Industrial Alcohol Market Volume (MT) Analysis by Sources, 2017-2032
Figure 132: East Asia Industrial Alcohol Market Value Share (%) and BPS Analysis by Sources, 2022-2032
Figure 133: East Asia Industrial Alcohol Market Y-o-Y Growth (%) Projections by Sources, 2022-2032
Figure 134: East Asia Industrial Alcohol Market Value (US$ Bn) Analysis by Product Type, 2017-2032
Figure 135: East Asia Industrial Alcohol Market Volume (MT) Analysis by Product Type, 2017-2032
Figure 136: East Asia Industrial Alcohol Market Value Share (%) and BPS Analysis by Product Type, 2022-2032
Figure 137: East Asia Industrial Alcohol Market Y-o-Y Growth (%) Projections by Product Type, 2022-2032
Figure 138: East Asia Industrial Alcohol Market Value (US$ Bn) Analysis by Application, 2017-2032
Figure 139: East Asia Industrial Alcohol Market Volume (MT) Analysis by Application, 2017-2032
Figure 140: East Asia Industrial Alcohol Market Value Share (%) and BPS Analysis by Application, 2022-2032
Figure 141: East Asia Industrial Alcohol Market Y-o-Y Growth (%) Projections by Application, 2022-2032
Figure 142: East Asia Industrial Alcohol Market Value (US$ Bn) Analysis by Processing Method, 2017-2032
Figure 143: East Asia Industrial Alcohol Market Volume (MT) Analysis by Processing Method, 2017-2032
Figure 144: East Asia Industrial Alcohol Market Value Share (%) and BPS Analysis by Processing Method, 2022-2032
Figure 145: East Asia Industrial Alcohol Market Y-o-Y Growth (%) Projections by Processing Method, 2022-2032
Figure 146: East Asia Industrial Alcohol Market Attractiveness by Sources, 2022-2032
Figure 147: East Asia Industrial Alcohol Market Attractiveness by Product Type, 2022-2032
Figure 148: East Asia Industrial Alcohol Market Attractiveness by Application, 2022-2032
Figure 149: East Asia Industrial Alcohol Market Attractiveness by Processing Method, 2022-2032
Figure 150: East Asia Industrial Alcohol Market Attractiveness by Country, 2022-2032
Figure 151: South Asia Industrial Alcohol Market Value (US$ Bn) by Sources, 2022-2032
Figure 152: South Asia Industrial Alcohol Market Value (US$ Bn) by Product Type, 2022-2032
Figure 153: South Asia Industrial Alcohol Market Value (US$ Bn) by Application, 2022-2032
Figure 154: South Asia Industrial Alcohol Market Value (US$ Bn) by Processing Method, 2022-2032
Figure 155: South Asia Industrial Alcohol Market Value (US$ Bn) by Country, 2022-2032
Figure 156: South Asia Industrial Alcohol Market Value (US$ Bn) Analysis by Country, 2017-2032
Figure 157: South Asia Industrial Alcohol Market Volume (MT) Analysis by Country, 2017-2032
Figure 158: South Asia Industrial Alcohol Market Value Share (%) and BPS Analysis by Country, 2022-2032
Figure 159: South Asia Industrial Alcohol Market Y-o-Y Growth (%) Projections by Country, 2022-2032
Figure 160: South Asia Industrial Alcohol Market Value (US$ Bn) Analysis by Sources, 2017-2032
Figure 161: South Asia Industrial Alcohol Market Volume (MT) Analysis by Sources, 2017-2032
Figure 162: South Asia Industrial Alcohol Market Value Share (%) and BPS Analysis by Sources, 2022-2032
Figure 163: South Asia Industrial Alcohol Market Y-o-Y Growth (%) Projections by Sources, 2022-2032
Figure 164: South Asia Industrial Alcohol Market Value (US$ Bn) Analysis by Product Type, 2017-2032
Figure 165: South Asia Industrial Alcohol Market Volume (MT) Analysis by Product Type, 2017-2032
Figure 166: South Asia Industrial Alcohol Market Value Share (%) and BPS Analysis by Product Type, 2022-2032
Figure 167: South Asia Industrial Alcohol Market Y-o-Y Growth (%) Projections by Product Type, 2022-2032
Figure 168: South Asia Industrial Alcohol Market Value (US$ Bn) Analysis by Application, 2017-2032
Figure 169: South Asia Industrial Alcohol Market Volume (MT) Analysis by Application, 2017-2032
Figure 170: South Asia Industrial Alcohol Market Value Share (%) and BPS Analysis by Application, 2022-2032
Figure 171: South Asia Industrial Alcohol Market Y-o-Y Growth (%) Projections by Application, 2022-2032
Figure 172: South Asia Industrial Alcohol Market Value (US$ Bn) Analysis by Processing Method, 2017-2032
Figure 173: South Asia Industrial Alcohol Market Volume (MT) Analysis by Processing Method, 2017-2032
Figure 174: South Asia Industrial Alcohol Market Value Share (%) and BPS Analysis by Processing Method, 2022-2032
Figure 175: South Asia Industrial Alcohol Market Y-o-Y Growth (%) Projections by Processing Method, 2022-2032
Figure 176: South Asia Industrial Alcohol Market Attractiveness by Sources, 2022-2032
Figure 177: South Asia Industrial Alcohol Market Attractiveness by Product Type, 2022-2032
Figure 178: South Asia Industrial Alcohol Market Attractiveness by Application, 2022-2032
Figure 179: South Asia Industrial Alcohol Market Attractiveness by Processing Method, 2022-2032
Figure 180: South Asia Industrial Alcohol Market Attractiveness by Country, 2022-2032
Figure 181: Oceania Industrial Alcohol Market Value (US$ Bn) by Sources, 2022-2032
Figure 182: Oceania Industrial Alcohol Market Value (US$ Bn) by Product Type, 2022-2032
Figure 183: Oceania Industrial Alcohol Market Value (US$ Bn) by Application, 2022-2032
Figure 184: Oceania Industrial Alcohol Market Value (US$ Bn) by Processing Method, 2022-2032
Figure 185: Oceania Industrial Alcohol Market Value (US$ Bn) by Country, 2022-2032
Figure 186: Oceania Industrial Alcohol Market Value (US$ Bn) Analysis by Country, 2017-2032
Figure 187: Oceania Industrial Alcohol Market Volume (MT) Analysis by Country, 2017-2032
Figure 188: Oceania Industrial Alcohol Market Value Share (%) and BPS Analysis by Country, 2022-2032
Figure 189: Oceania Industrial Alcohol Market Y-o-Y Growth (%) Projections by Country, 2022-2032
Figure 190: Oceania Industrial Alcohol Market Value (US$ Bn) Analysis by Sources, 2017-2032
Figure 191: Oceania Industrial Alcohol Market Volume (MT) Analysis by Sources, 2017-2032
Figure 192: Oceania Industrial Alcohol Market Value Share (%) and BPS Analysis by Sources, 2022-2032
Figure 193: Oceania Industrial Alcohol Market Y-o-Y Growth (%) Projections by Sources, 2022-2032
Figure 194: Oceania Industrial Alcohol Market Value (US$ Bn) Analysis by Product Type, 2017-2032
Figure 195: Oceania Industrial Alcohol Market Volume (MT) Analysis by Product Type, 2017-2032
Figure 196: Oceania Industrial Alcohol Market Value Share (%) and BPS Analysis by Product Type, 2022-2032
Figure 197: Oceania Industrial Alcohol Market Y-o-Y Growth (%) Projections by Product Type, 2022-2032
Figure 198: Oceania Industrial Alcohol Market Value (US$ Bn) Analysis by Application, 2017-2032
Figure 199: Oceania Industrial Alcohol Market Volume (MT) Analysis by Application, 2017-2032
Figure 200: Oceania Industrial Alcohol Market Value Share (%) and BPS Analysis by Application, 2022-2032
Figure 201: Oceania Industrial Alcohol Market Y-o-Y Growth (%) Projections by Application, 2022-2032
Figure 202: Oceania Industrial Alcohol Market Value (US$ Bn) Analysis by Processing Method, 2017-2032
Figure 203: Oceania Industrial Alcohol Market Volume (MT) Analysis by Processing Method, 2017-2032
Figure 204: Oceania Industrial Alcohol Market Value Share (%) and BPS Analysis by Processing Method, 2022-2032
Figure 205: Oceania Industrial Alcohol Market Y-o-Y Growth (%) Projections by Processing Method, 2022-2032
Figure 206: Oceania Industrial Alcohol Market Attractiveness by Sources, 2022-2032
Figure 207: Oceania Industrial Alcohol Market Attractiveness by Product Type, 2022-2032
Figure 208: Oceania Industrial Alcohol Market Attractiveness by Application, 2022-2032
Figure 209: Oceania Industrial Alcohol Market Attractiveness by Processing Method, 2022-2032
Figure 210: Oceania Industrial Alcohol Market Attractiveness by Country, 2022-2032
Figure 211: MEA Industrial Alcohol Market Value (US$ Bn) by Sources, 2022-2032
Figure 212: MEA Industrial Alcohol Market Value (US$ Bn) by Product Type, 2022-2032
Figure 213: MEA Industrial Alcohol Market Value (US$ Bn) by Application, 2022-2032
Figure 214: MEA Industrial Alcohol Market Value (US$ Bn) by Processing Method, 2022-2032
Figure 215: MEA Industrial Alcohol Market Value (US$ Bn) by Country, 2022-2032
Figure 216: MEA Industrial Alcohol Market Value (US$ Bn) Analysis by Country, 2017-2032
Figure 217: MEA Industrial Alcohol Market Volume (MT) Analysis by Country, 2017-2032
Figure 218: MEA Industrial Alcohol Market Value Share (%) and BPS Analysis by Country, 2022-2032
Figure 219: MEA Industrial Alcohol Market Y-o-Y Growth (%) Projections by Country, 2022-2032
Figure 220: MEA Industrial Alcohol Market Value (US$ Bn) Analysis by Sources, 2017-2032
Figure 221: MEA Industrial Alcohol Market Volume (MT) Analysis by Sources, 2017-2032
Figure 222: MEA Industrial Alcohol Market Value Share (%) and BPS Analysis by Sources, 2022-2032
Figure 223: MEA Industrial Alcohol Market Y-o-Y Growth (%) Projections by Sources, 2022-2032
Figure 224: MEA Industrial Alcohol Market Value (US$ Bn) Analysis by Product Type, 2017-2032
Figure 225: MEA Industrial Alcohol Market Volume (MT) Analysis by Product Type, 2017-2032
Figure 226: MEA Industrial Alcohol Market Value Share (%) and BPS Analysis by Product Type, 2022-2032
Figure 227: MEA Industrial Alcohol Market Y-o-Y Growth (%) Projections by Product Type, 2022-2032
Figure 228: MEA Industrial Alcohol Market Value (US$ Bn) Analysis by Application, 2017-2032
Figure 229: MEA Industrial Alcohol Market Volume (MT) Analysis by Application, 2017-2032
Figure 230: MEA Industrial Alcohol Market Value Share (%) and BPS Analysis by Application, 2022-2032
Figure 231: MEA Industrial Alcohol Market Y-o-Y Growth (%) Projections by Application, 2022-2032
Figure 232: MEA Industrial Alcohol Market Value (US$ Bn) Analysis by Processing Method, 2017-2032
Figure 233: MEA Industrial Alcohol Market Volume (MT) Analysis by Processing Method, 2017-2032
Figure 234: MEA Industrial Alcohol Market Value Share (%) and BPS Analysis by Processing Method, 2022-2032
Figure 235: MEA Industrial Alcohol Market Y-o-Y Growth (%) Projections by Processing Method, 2022-2032
Figure 236: MEA Industrial Alcohol Market Attractiveness by Sources, 2022-2032
Figure 237: MEA Industrial Alcohol Market Attractiveness by Product Type, 2022-2032
Figure 238: MEA Industrial Alcohol Market Attractiveness by Application, 2022-2032
Figure 239: MEA Industrial Alcohol Market Attractiveness by Processing Method, 2022-2032
Figure 240: MEA Industrial Alcohol Market Attractiveness by Country, 2022-2032
Need specific information?
Request CustomizationExplore Food and Beverage Insights
View Reports