Industrial Food Milling Machine Market Outlook (2023 to 2033)

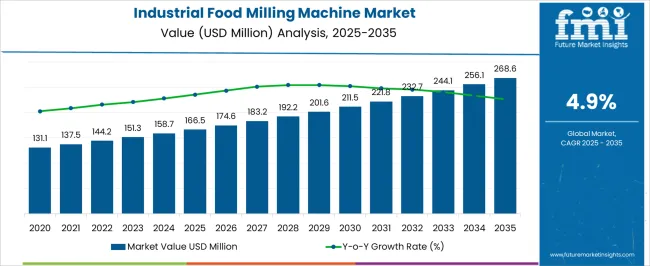
The global industrial food milling machine market size is projected to grow from US$ 151.3 Million in 2023 to US$ 244.0 Million by 2033, with overall sales accelerating at 4.9% CAGR throughout the forecast period (2023 to 2033). Rising adoption across various industries is a key factor boosting sales of industrial food milling machines globally.

An industrial food milling machine is the equipment used to process and grind food products on an industrial scale. The raw materials are fed into the machine through a hopper and are milled and ground into the desired finished product.

Industrial food milling machines can be used to process a wide variety of food products, including flour, spices, sugar, grains, and nuts. These machines are extensively used in the food processing and manufacturing industries for a variety of tasks, including grinding, milling, pulverizing, and chopping.

Industrial food milling machines come in various sizes and can be used for both commercial and home applications. They help to increase the efficiency of the production process by breaking down the food particles into uniform sizes. Growth in the market is being driven by the increasing demand for processed foods, the need for better food safety, and the desire for more efficient production processes.

The food industry is constantly changing and evolving in order to meet the ever-changing demands of consumers. As it is important for companies within the industry to keep up with the latest trends and market changes, they are continuously installing machinery like industrial food milling machines in their facilities. This will continue to boost sales of industrial food milling machines.

Industrial food milling machines enable industries to increase their productivity and efficiency, reduce labor costs, and enhance food safety. Hence, their demand will eventually rise during the next ten years due to the implementation of stringent food safety regulations.

Similarly, increasing demand for healthy and organic products, growing sales through online platforms, and integration of advanced technologies in food milling machines are expected to boost the global industrial food milling machine market during the next ten years.

Attribute Key Insights
Industrial Food Milling Machine Market Estimated Value (2023) US$ 151.3 Million
Projected Market Value (2033) US$ 244.0 Million
Value-based CAGR (2023 to 2033) 4.9% CAGR
Market Share of USA 32.7%

Don't pay for what you don't need

Customize your report by selecting specific countries or regions and save 30%!

2018 to 2022 Global Industrial Food Milling Machine Market Outlook Compared to 2023 to 2033 Forecast

The global demand for industrial food milling machines is expected to grow at a CAGR of 4.9% during the forecast period (2023 to 2033), in comparison to the 4.2% CAGR registered from 2018 to 2022.

Growing demand for processed and packaged foods, the increasing popularity of healthy and nutritious food, and the rising adoption of advanced food processing machines in the food & beverage industry are some of the key factors driving the global industrial food milling machine market.

Industrial food milling machines have gained immense traction across the food industry due to their various benefits. These machines can help to improve the quality of finished products, reduce contamination, and increase the efficiency of the production process. As a result, they are being increasingly employed across food manufacturing and processing industries.

Regionally, the Asia-Pacific region is projected to emerge as the fastest-growing industrial food milling machine market owing to a rapidly growing population, rising disposable incomes, and expansion of the food processing industry.

Industrial Food Milling Machine Market

Market-o-Nomics - Highlighting the Key Trends

A number of influential factors have been identified that are expected to spur growth in the global industrial food milling machine market during the projection period (2023 to 2033). Besides the proliferating aspects prevailing in the market, the analysts at FMI have also analyzed the restraining elements, lucrative opportunities, and upcoming threats that can somehow influence industrial food milling machine sales.

The drivers, restraints, opportunities, and threats (DROTs) identified are as follows:

DRIVERS

  • The rising usage of industrial food milling machines in the food industry is a key factor driving the global market forward.
  • Growing demand for flout and spices across the world is expected to boost sales in the market during the forecast period.

RESTRAINTS

  • The high cost of industrial food milling machines is restraining the growth of the global market, particularly in low-income regions.

OPPORTUNITIES

  • The growing need for improving food quality to comply with stringent food regulations is expected to generate lucrative opportunities for the growth of the industrial food milling machine market over the next decade.
  • The development of clean, efficient, and low-energy-consuming machines is likely to create growth prospects for the market.

THREATS

  • Rising energy concerns are likely to inhibit the growth of the market during the forecast period.
Nandini Roy Choudhury

Principal Consultant

Talk to Analyst

Find your sweet spots for generating winning opportunities in this market.

Country-wise Insights

What Makes the USA a Prominent Industrial Food Milling Machine Market?

Growing Adoption of Advanced Food Processing Technologies Driving the USA Market

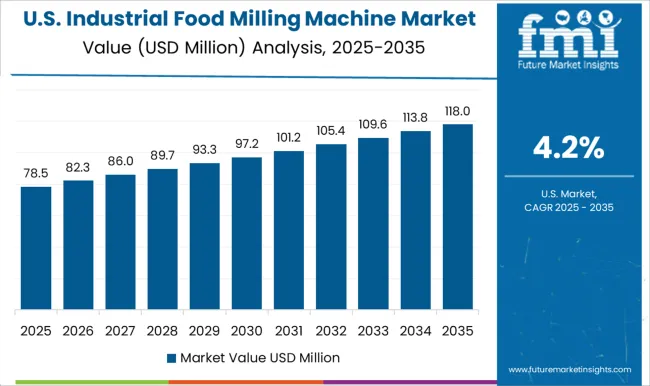
As per FMI, the USA will continue to remain the most dominant industrial food milling machine market during the forecast period, owing to the rising adoption of advanced food milling machines across the food industry.

Similarly, the growing focus on improving food quality and safety and the strong presence of leading manufacturers are expected to generate high demand for industrial food milling machines in the USA during the projection period.

Industrial food milling machines are large equipment used to process and grind various food products. In the USA, these machines are commonly used in commercial kitchens and restaurants.

They allow companies to increase their productivity, reduce costs, and minimize the risk of food contamination. As a result, more and more industries are installing them. This will boost the USA market over the next ten years.

What is India Emerging as a Lucrative Industrial Food Milling Machine Market?

Rapid Expansion of Food Processing Industry Generating Demand in India

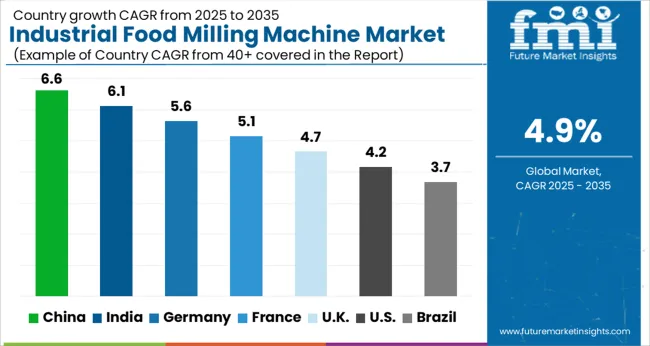
According to the FMI, the industrial food milling machine market in India will grow at a robust CAGR of 6.3% during the forecast period, making it one of the fastest-growing markets across South Asia. A rapidly growing population, increasing consumer spending on processed food products and favorable government support are driving the Indian market.

Industrial food milling machines are an important piece of equipment for any food processing facility. India is a country with a rapidly growing food processing industry, and the demand for industrial food milling machines is on the rise. There are many different types and models of industrial food milling machines available on the market, and each has its own unique set of features and benefits.

Some of the most popular brands of industrial food milling machines include Buhler, Fritsch, GEA Group, JASTA, Kady International, and Netzsch. These manufacturers offer a wide variety of machines with different features and price points.
Why is Germany Dictating the Course of the European Industrial Food Milling Machine Market?

Presence of Leading Food Milling Machine Positioning Germany in Front Seat

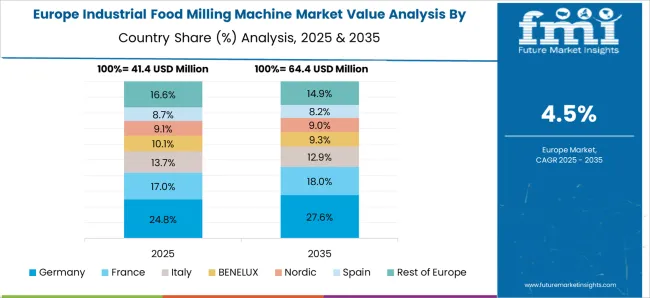
Germany is likely to remain at the top of the ladder in the Europe industrial food milling machine market during the forecast period, owing to the rising demand for packaged and ready-to-eat food products and the heavy presence of leading manufacturers such as Ziermann Holvrieka.

The German company, Ziemann Holvrieka, is the leading manufacturer of food milling machines in Europe. With a market share of over 50%, the company has a significant advantage over its competitors. The company's products are used in a variety of industries, including the food and beverage industry, where they are used to process and package food products.

Ziemann Holvrieka has been able to maintain its position as the leading manufacturer of food milling machines in Europe due to its innovative designs and high-quality products. The company's products are constantly being updated and improved to meet the needs of its customers. In addition, Ziemann Holvrieka offers a wide range of services to its customers, including technical support and training.

Category-wise Insights

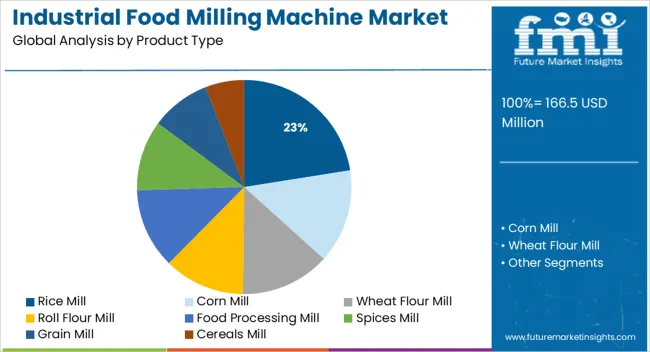
Which Product Type is Highly Popular in the Industrial Food Milling Machine Market? How Online Distribution Channels are Influencing the Sales of Industrial Food Milling Machines?

Various Benefits of Online Distribution Channels Making Them Ideal for Purchasing These Machines

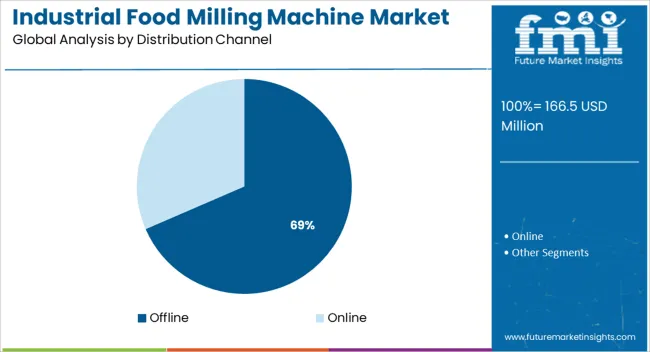
Based on the distribution channel, the online segment is likely to grow at the highest pace during the forecast period, owing to the increasing penetration of online shopping platforms and rising consumer inclination towards purchasing these food processing machines through online mode.

Online sales channels have played a major role in driving the growth of industrial food milling machines. These channels offer a convenient way for customers to purchase products like industrial food milling machines and have helped to reach a wider audience.
Get the data you need at a Fraction of the cost

Personalize your report by choosing insights you need
and save 40%!

Competitive Landscape

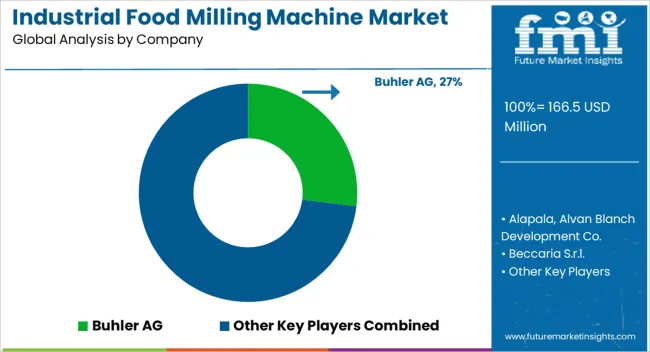
Key players operating in the global market include Alapala, Alvan Blanch Development Co., Beccaria S.r.l., Brabender GmbH and Co. KG, Buhler AG, Erich NETZSCH GmbH and Co. Holding KG, FRITSCH GmBH, FUCHS Maschinen AG, Glen Mills Inc., Hosokawa Micron Corp., IDEX Corp., IKA Werke GmbH and CO. KG, Isimsan Muh. San ve Tic. A.S., Jas Enterprises, Kice Industries Inc., Mill Powder Tech Co. Ltd., Omas Srl, ProXES GmbH, Royal Duyvis Wiener BV, and Satake Corp. among others.

These players are constantly adopting various strategies such as new product launches, partnerships, mergers, acquisitions, facility expansions, and collaborations to increase their revenue and gain a competitive edge in the market. For instance,

  • In February 2019 - Satake Corporation launched a new product brand named REACH. The product lineup consists of semi-assembled rice processing plants in different processing capacities
  • Rieco launched RACAM- Air Classifying Action Mill that is big on capacity, big on efficiency but low on noise, at ANUTEC 2021.

Searching for the Right Food Milling Tool! Get Novel Milling Technologies of Buhler AG and Satake Corp. for Better Experience!

With the growing need for improving product quality and production efficiency, food manufacturing and processing industries are increasingly installing industrial food milling solutions in their facilities. This has generated huge demand in this space and to meet this burgeoning demand, manufacturers are coming up with new products with advanced features.

Founded in 1896 as the first motorized rice milling machine manufacturer in Japan, Satake Corp. has become a leading manufacturer and supplier of industrial food milling machines. The company operates in over 150 countries. Its products range from rice milling systems, flour milling machinery, microbial analyzers for ballast water, and biomass gasification systems to packaged rice for the food industry.

Satake is continuously adopting various tactics such as new product launches, mergers, acquisitions, and facility expansion to increase its revenues and customer bases. For instance, in September 2019, a new addition to its oversea product brand REACH, SYSTEM 3.0, a semi-assembled rice milling plant geared towards smaller-scale rice processors mainly in Asian and African regions was announced by Satake. Similarly, in August 2022, Satake announced the opening of a new office in the Middle East region to further accelerate sales growth.

Another prominent manufacturer and supplier of food milling machines are Buhler AG. The company develops the best process solutions for a wide range of industries. It is estimated that around 2 billion people consume foods such as flour, rice, pasta, beer, coffee, and beer, that are made with Buhler processes on a daily basis.

In November 2020, Buhler launched Arrius, a fully integrated grinding technology for milling wheat, rye, barley, corn, and durum. With this new launch, Buhler has entered into a new milling era. The new integrated and self-adjusting grinding system is set to drive product quality, consistency, and profits in the milling industry.

Industrial Food Milling Machine Market Report Scope

Attribute Details
Estimated Market Size (2023) US$ 151.3 Million
Projected Market Size (2033) US$ 244.0 Million
Anticipated Growth Rate (2023 to 2033) 4.9% CAGR
Forecast Period 2023 to 2033
Historical Data Available for 2018 to 2022
Market Analysis US$ Million for Value and Units for Volume
Key Regions Covered
  • North America
  • Latin America
  • Europe
  • Asia Pacific
  • Oceania
  • Middle East and Africa (MEA)
Key Countries Covered
  • USA
  • Canada
  • Mexico
  • Germany
  • UK
  • France
  • Italy
  • Spain
  • China
  • Japan
  • India
  • South Korea
  • Australia
  • Brazil
  • Argentina
  • South Africa
  • UAE
Key Segments Covered
  • Product Type
  • Application
  • Distribution Channel
  • Region
Key Companies Profiled
  • Alapala
  • Alvan Blanch Development Co.
  • Beccaria S.r.l.
  • Brabender GmbH and Co. KG Buhler AG
  • Erich NETZSCH GmbH and Co. Holding KG
  • FRITSCH GmBH
  • FUCHS Maschinen AG
  • Glen Mills Inc.
  • Hosokawa Micron Corp.
  • IDEX Corp.
  • IKA Werke GmbH and CO. KG
  • Isimsan Muh. San ve Tic. A.S.
  • Jas Enterprises
  • Kice Industries Inc.
  • Mill Powder Tech Co. Ltd.
  • Omas Srl
  • ProXES GmbH
  • Royal Duyvis Wiener BV
  • Satake Corp
Report Coverage Market Forecast, Company Share Analysis, Competitive Landscape, Drivers, Restraints, Opportunities and Threats Analysis, Market Dynamics and Challenges, and Strategic Growth Initiatives

Industrial Food Milling Machine Market by Category

By Product Type:

  • Rice Mill
  • Corn Mill
  • Wheat Flour Mill
  • Roll Flour Mill
  • Food Processing Mill
  • Spices Mill
  • Grain Mill
  • Cereals Mill

By Application:

  • Commercial Purpose
  • Industrial Purpose

By Distribution Channel:

  • Online
  • Offline

By Region:

  • North America
  • Latin America
  • Europe
  • East Asia
  • South Asia
  • Oceania
  • Middle East and Africa (MEA)

Frequently Asked Questions

How big is the industrial food milling machine market?

The global industrial food milling machine market size is expected to reach US$ 151.3 Million in 2023.

At what rate is the industrial food milling machine market expected to rise?

As per FMI, the industrial food milling machine market is expected to rise at a CAGR of 4.9% during the forecast period (2023 to 2033).

What is the projected valuation for the industrial food milling machine market?

The global industrial food milling machine market is projected to surpass a valuation of US$ 244.0 Million by 2033.

What is the North America industrial food milling machine market Outlook?

North America is expected to hold around 38% share of the global market in 2023.

Which are the major countries driving demand for industrial food milling machines?

The USA, China, Canada, Germany, and Mexico are the major countries driving demand for industrial food milling machines.

At what rate will the China industrial food milling machine market grow?

China’s industrial food milling machine market is projected to grow at a CAGR of 5.7% during the projection period.

What is the growth projection for the UK industrial food milling machine market?

The UK market is projected to grow at 5.3% CAGR through 2033.

At what rate will the India market grow?

The industrial food milling machine market in India is projected to grow at a CAGR of 6.3% during the forecast period.

Table of Content
1. Executive Summary | Industrial Food Milling Machine Market

    1.1. Global Market Outlook

    1.2. Demand-side Trends

    1.3. Supply-side Trends

    1.4. Technology Roadmap Analysis

    1.5. Analysis and Recommendations

2. Market Overview

    2.1. Market Coverage / Taxonomy

    2.2. Market Definition / Scope / Limitations

3. Market Background

    3.1. Market Dynamics

        3.1.1. Drivers

        3.1.2. Restraints

        3.1.3. Opportunity

        3.1.4. Trends

    3.2. Scenario Forecast

        3.2.1. Demand in Optimistic Scenario

        3.2.2. Demand in Likely Scenario

        3.2.3. Demand in Conservative Scenario

    3.3. Product launches & Recent Developments

    3.4. Product Life Cycle Analysis

    3.5. Value Chain Analysis

        3.5.1. Supply Side Participants and their Roles

            3.5.1.1. Producers

            3.5.1.2. Mid-Level Participants (Traders/ Agents/ Brokers)

            3.5.1.3. Wholesalers and Distributors

        3.5.2. % of Operating Margin Analysis

        3.5.3. List of Raw Material Suppliers

        3.5.4. List of Existing and Potential Buyers

    3.6. Global Market - Pricing Analysis

        3.6.1. Price Point Assessment by Region

        3.6.2. Price Point Assessment by Product Type

        3.6.3. Price Forecast till 2033

        3.6.4. Factors affecting pricing

    3.7. Forecast Factors - Relevance & Impact

    3.8. PESTLE and Porter’s Analysis

    3.9. Regulatory Landscape

        3.9.1. Packaging & Labelling Regulations

        3.9.2. Certifications and Certifying Agency Overview

        3.9.3. Import/Export Policies

    3.10. Regional Parent Market Outlook

    3.11. Production and Consumption Statistics

    3.12. Import and Export Statistics

    3.13. Consumers Survey Analysis

    3.14. Macro-Economic Factors

    3.15. Product Claims & Nutritional Information scanned by Buyers

4. Global Analysis 2018 to 2022 and Forecast, 2023 to 2033

    4.1. Historical Market Size Value (US$ Million) & Volume (MT) Analysis, 2018 to 2022

    4.2. Current and Future Market Size Value (US$ Million) & Volume (MT) Projections, 2023 to 2033

        4.2.1. Y-o-Y Growth Trend Analysis

        4.2.2. Absolute $ Opportunity Analysis

5. Global Analysis 2018 to 2022 and Forecast 2023 to 2033, By Product Type

    5.1. Introduction / Key Findings

    5.2. Historical Market Size Value (US$ Million) & Volume (MT) Analysis By Product Type, 2018 to 2022

    5.3. Current and Future Market Size Value (US$ Million) & Volume (MT) Analysis and Forecast By Product Type, 2023 to 2033

        5.3.1. Rice Mill

        5.3.2. Corn Mill

        5.3.3. Wheat Flour Mill

        5.3.4. Roll Flour Mill

        5.3.5. Food Processing Mill

        5.3.6. Spices Mill

        5.3.7. Grain Mill

        5.3.8. Cereals Mill

    5.4. Y-o-Y Growth Trend Analysis By Product Type, 2018 to 2022

    5.5. Absolute $ Opportunity Analysis By Product Type, 2023 to 2033

6. Global Analysis 2018 to 2022 and Forecast 2023 to 2033, By Application

    6.1. Introduction / Key Findings

    6.2. Historical Market Size Value (US$ Million) & Volume (MT) Analysis By Application, 2018 to 2022

    6.3. Current and Future Market Size Value (US$ Million) & Volume (MT) Analysis and Forecast By Application, 2023 to 2033

        6.3.1. Commercial Purpose

        6.3.2. Industrial Purpose

    6.4. Y-o-Y Growth Trend Analysis By Application, 2018 to 2022

    6.5. Absolute $ Opportunity Analysis By Application, 2023 to 2033

7. Global Analysis 2018 to 2022 and Forecast 2023 to 2033, By Distribution Channel

    7.1. Introduction / Key Findings

    7.2. Historical Market Size Value (US$ Million) & Volume (MT) Analysis By Distribution Channel, 2018 to 2022

    7.3. Current and Future Market Size Value (US$ Million) & Volume (MT) Analysis and Forecast By Distribution Channel, 2023 to 2033

        7.3.1. Online

        7.3.2. Offline

    7.4. Y-o-Y Growth Trend Analysis By Distribution Channel, 2018 to 2022

    7.5. Absolute $ Opportunity Analysis By Distribution Channel, 2023 to 2033

8. Global Analysis 2018 to 2022 and Forecast 2023 to 2033, By Region

    8.1. Introduction

    8.2. Historical Market Size Value (US$ Million) & Volume (MT) Analysis By Region, 2018 to 2022

    8.3. Current Market Size Value (US$ Million) & Volume (MT) Analysis and Forecast By Region, 2023 to 2033

        8.3.1. North America

        8.3.2. Latin America

        8.3.3. Europe

        8.3.4. East Asia

        8.3.5. South Asia

        8.3.6. Oceania

        8.3.7. Middle East and Africa (MEA)

    8.4. Market Attractiveness Analysis By Region

9. North America Analysis 2018 to 2022 and Forecast 2023 to 2033, By Country

    9.1. Historical Market Size Value (US$ Million) & Volume (MT) Trend Analysis By Market Taxonomy, 2018 to 2022

    9.2. Market Size Value (US$ Million) & Volume (MT) Forecast By Market Taxonomy, 2023 to 2033

        9.2.1. By Country

            9.2.1.1.United States of America

            9.2.1.2. Canada

        9.2.2. By Product Type

        9.2.3. By Application

        9.2.4. By Distribution Channel

    9.3. Market Attractiveness Analysis

        9.3.1. By Country

        9.3.2. By Product Type

        9.3.3. By Application

        9.3.4. By Distribution Channel

    9.4. Key Takeaways

10. Latin America Analysis 2018 to 2022 and Forecast 2023 to 2033, By Country

    10.1. Historical Market Size Value (US$ Million) & Volume (MT) Trend Analysis By Market Taxonomy, 2018 to 2022

    10.2. Market Size Value (US$ Million) & Volume (MT) Forecast By Market Taxonomy, 2023 to 2033

        10.2.1. By Country

            10.2.1.1. Brazil

            10.2.1.2. Mexico

            10.2.1.3. Argentina

            10.2.1.4. Chile

            10.2.1.5. Peru

            10.2.1.6. Rest of Latin America

        10.2.2. By Product Type

        10.2.3. By Application

        10.2.4. By Distribution Channel

    10.3. Market Attractiveness Analysis

        10.3.1. By Country

        10.3.2. By Product Type

        10.3.3. By Application

        10.3.4. By Distribution Channel

    10.4. Key Takeaways

11. Europe Analysis 2018 to 2022 and Forecast 2023 to 2033, By Country

    11.1. Historical Market Size Value (US$ Million) & Volume (MT) Trend Analysis By Market Taxonomy, 2018 to 2022

    11.2. Market Size Value (US$ Million) & Volume (MT) Forecast By Market Taxonomy, 2023 to 2033

        11.2.1. By Country

            11.2.1.1. Germany

            11.2.1.2. Italy

            11.2.1.3. France

            11.2.1.4. United Kingdom

            11.2.1.5. Spain

            11.2.1.6. Russia

            11.2.1.7. BENELUX

            11.2.1.8. Poland

            11.2.1.9. Nordic Countries

            11.2.1.10. Rest of Europe

        11.2.2. By Product Type

        11.2.3. By Application

        11.2.4. By Distribution Channel

    11.3. Market Attractiveness Analysis

        11.3.1. By Country

        11.3.2. By Product Type

        11.3.3. By Application

        11.3.4. By Distribution Channel

    11.4. Key Takeaways

12. East Asia Analysis 2018 to 2022 and Forecast 2023 to 2033, By Country

    12.1. Historical Market Size Value (US$ Million) & Volume (MT) Trend Analysis By Market Taxonomy, 2018 to 2022

    12.2. Market Size Value (US$ Million) & Volume (MT) Forecast By Market Taxonomy, 2023 to 2033

        12.2.1. By Country

            12.2.1.1. China

            12.2.1.2. Japan

            12.2.1.3. South Korea

        12.2.2. By Product Type

        12.2.3. By Application

        12.2.4. By Distribution Channel

    12.3. Market Attractiveness Analysis

        12.3.1. By Country

        12.3.2. By Product Type

        12.3.3. By Application

        12.3.4. By Distribution Channel

    12.4. Key Takeaways

13. South Asia Analysis 2018 to 2022 and Forecast 2023 to 2033, By Country

    13.1. Historical Market Size Value (US$ Million) & Volume (MT) Trend Analysis By Market Taxonomy, 2018 to 2022

    13.2. Market Size Value (US$ Million) & Volume (MT) Forecast By Market Taxonomy, 2023 to 2033

        13.2.1. By Country

            13.2.1.1. India

            13.2.1.2. Thailand

            13.2.1.3. Malaysia

            13.2.1.4. Indonesia

            13.2.1.5. Singapore

            13.2.1.6. Rest of South Asia

        13.2.2. By Product Type

        13.2.3. By Application

        13.2.4. By Distribution Channel

    13.3. Market Attractiveness Analysis

        13.3.1. By Country

        13.3.2. By Product Type

        13.3.3. By Application

        13.3.4. By Distribution Channel

    13.4. Key Takeaways

14. Oceania Analysis 2018 to 2022 and Forecast 2023 to 2033, By Country

    14.1. Historical Market Size Value (US$ Million) & Volume (MT) Trend Analysis By Market Taxonomy, 2018 to 2022

    14.2. Market Size Value (US$ Million) & Volume (MT) Forecast By Market Taxonomy, 2023 to 2033

        14.2.1. By Country

            14.2.1.1. Australia

            14.2.1.2. New Zealand

        14.2.2. By Product Type

        14.2.3. By Application

        14.2.4. By Distribution Channel

    14.3. Market Attractiveness Analysis

        14.3.1. By Country

        14.3.2. By Product Type

        14.3.3. By Application

        14.3.4. By Distribution Channel

    14.4. Key Takeaways

15. MEA Analysis 2018 to 2022 and Forecast 2023 to 2033, By Country

    15.1. Historical Market Size Value (US$ Million) & Volume (MT) Trend Analysis By Market Taxonomy, 2018 to 2022

    15.2. Market Size Value (US$ Million) & Volume (MT) Forecast By Market Taxonomy, 2023 to 2033

        15.2.1. By Country

            15.2.1.1. GCC Countries

            15.2.1.2. South Africa

            15.2.1.3. Central Africa

            15.2.1.4. North Africa

        15.2.2. By Product Type

        15.2.3. By Application

        15.2.4. By Distribution Channel

    15.3. Market Attractiveness Analysis

        15.3.1. By Country

        15.3.2. By Product Type

        15.3.3. By Application

        15.3.4. By Distribution Channel

    15.4. Key Takeaways

16. Key Countries Analysis

    16.1. United States of America

        16.1.1. Pricing Analysis

        16.1.2. Market Share Analysis, 2023

            16.1.2.1. By Product Type

            16.1.2.2. By Application

            16.1.2.3. By Distribution Channel

    16.2. Canada

        16.2.1. Pricing Analysis

        16.2.2. Market Share Analysis, 2023

            16.2.2.1. By Product Type

            16.2.2.2. By Application

            16.2.2.3. By Distribution Channel

    16.3. Brazil

        16.3.1. Pricing Analysis

        16.3.2. Market Share Analysis, 2023

            16.3.2.1. By Product Type

            16.3.2.2. By Application

            16.3.2.3. By Distribution Channel

    16.4. Mexico

        16.4.1. Pricing Analysis

        16.4.2. Market Share Analysis, 2023

            16.4.2.1. By Product Type

            16.4.2.2. By Application

            16.4.2.3. By Distribution Channel

    16.5. Argentina

        16.5.1. Pricing Analysis

        16.5.2. Market Share Analysis, 2023

            16.5.2.1. By Product Type

            16.5.2.2. By Application

            16.5.2.3. By Distribution Channel

    16.6. Chile

        16.6.1. Pricing Analysis

        16.6.2. Market Share Analysis, 2023

            16.6.2.1. By Product Type

            16.6.2.2. By Application

            16.6.2.3. By Distribution Channel

    16.7. Peru

        16.7.1. Pricing Analysis

        16.7.2. Market Share Analysis, 2023

            16.7.2.1. By Product Type

            16.7.2.2. By Application

            16.7.2.3. By Distribution Channel

    16.8. Germany

        16.8.1. Pricing Analysis

        16.8.2. Market Share Analysis, 2023

            16.8.2.1. By Product Type

            16.8.2.2. By Application

            16.8.2.3. By Distribution Channel

    16.9. Italy

        16.9.1. Pricing Analysis

        16.9.2. Market Share Analysis, 2023

            16.9.2.1. By Product Type

            16.9.2.2. By Application

            16.9.2.3. By Distribution Channel

    16.10. France

        16.10.1. Pricing Analysis

        16.10.2. Market Share Analysis, 2023

            16.10.2.1. By Product Type

            16.10.2.2. By Application

            16.10.2.3. By Distribution Channel

    16.11. Spain

        16.11.1. Pricing Analysis

        16.11.2. Market Share Analysis, 2023

            16.11.2.1. By Product Type

            16.11.2.2. By Application

            16.11.2.3. By Distribution Channel

    16.12. United Kingdom

        16.12.1. Pricing Analysis

        16.12.2. Market Share Analysis, 2023

            16.12.2.1. By Product Type

            16.12.2.2. By Application

            16.12.2.3. By Distribution Channel

    16.13. Russia

        16.13.1. Pricing Analysis

        16.13.2. Market Share Analysis, 2023

            16.13.2.1. By Product Type

            16.13.2.2. By Application

            16.13.2.3. By Distribution Channel

    16.14. Poland

        16.14.1. Pricing Analysis

        16.14.2. Market Share Analysis, 2023

            16.14.2.1. By Product Type

            16.14.2.2. By Application

            16.14.2.3. By Distribution Channel

    16.15. BENELUX

        16.15.1. Pricing Analysis

        16.15.2. Market Share Analysis, 2023

            16.15.2.1. By Product Type

            16.15.2.2. By Application

            16.15.2.3. By Distribution Channel

    16.16. Nordic Countries

        16.16.1. Pricing Analysis

        16.16.2. Market Share Analysis, 2023

            16.16.2.1. By Product Type

            16.16.2.2. By Application

            16.16.2.3. By Distribution Channel

    16.17. China

        16.17.1. Pricing Analysis

        16.17.2. Market Share Analysis, 2023

            16.17.2.1. By Product Type

            16.17.2.2. By Application

            16.17.2.3. By Distribution Channel

    16.18. Japan

        16.18.1. Pricing Analysis

        16.18.2. Market Share Analysis, 2023

            16.18.2.1. By Product Type

            16.18.2.2. By Application

            16.18.2.3. By Distribution Channel

    16.19. South Korea

        16.19.1. Pricing Analysis

        16.19.2. Market Share Analysis, 2023

            16.19.2.1. By Product Type

            16.19.2.2. By Application

            16.19.2.3. By Distribution Channel

    16.20. India

        16.20.1. Pricing Analysis

        16.20.2. Market Share Analysis, 2023

            16.20.2.1. By Product Type

            16.20.2.2. By Application

            16.20.2.3. By Distribution Channel

    16.21. Thailand

        16.21.1. Pricing Analysis

        16.21.2. Market Share Analysis, 2023

            16.21.2.1. By Product Type

            16.21.2.2. By Application

            16.21.2.3. By Distribution Channel

    16.22. Indonesia

        16.22.1. Pricing Analysis

        16.22.2. Market Share Analysis, 2023

            16.22.2.1. By Product Type

            16.22.2.2. By Application

            16.22.2.3. By Distribution Channel

    16.23. Malaysia

        16.23.1. Pricing Analysis

        16.23.2. Market Share Analysis, 2023

            16.23.2.1. By Product Type

            16.23.2.2. By Application

            16.23.2.3. By Distribution Channel

    16.24. Singapore

        16.24.1. Pricing Analysis

        16.24.2. Market Share Analysis, 2023

            16.24.2.1. By Product Type

            16.24.2.2. By Application

            16.24.2.3. By Distribution Channel

    16.25. Australia

        16.25.1. Pricing Analysis

        16.25.2. Market Share Analysis, 2023

            16.25.2.1. By Product Type

            16.25.2.2. By Application

            16.25.2.3. By Distribution Channel

    16.26. New Zealand

        16.26.1. Pricing Analysis

        16.26.2. Market Share Analysis, 2023

            16.26.2.1. By Product Type

            16.26.2.2. By Application

            16.26.2.3. By Distribution Channel

    16.27. GCC Countries

        16.27.1. Pricing Analysis

        16.27.2. Market Share Analysis, 2023

            16.27.2.1. By Product Type

            16.27.2.2. By Application

            16.27.2.3. By Distribution Channel

    16.28. South Africa

        16.28.1. Pricing Analysis

        16.28.2. Market Share Analysis, 2023

            16.28.2.1. By Product Type

            16.28.2.2. By Application

            16.28.2.3. By Distribution Channel

    16.29. North Africa

        16.29.1. Pricing Analysis

        16.29.2. Market Share Analysis, 2023

            16.29.2.1. By Product Type

            16.29.2.2. By Application

            16.29.2.3. By Distribution Channel

    16.30. Central Africa

        16.30.1. Pricing Analysis

        16.30.2. Market Share Analysis, 2023

            16.30.2.1. By Product Type

            16.30.2.2. By Application

            16.30.2.3. By Distribution Channel

17. Market Structure Analysis

    17.1. Competition Dashboard

    17.2. Competition Benchmarking

    17.3. Market Share Analysis of Top Players

        17.3.1. By Regional

        17.3.2. By Product Type

        17.3.3. By Application

        17.3.4. By Distribution Channel

18. Competition Analysis

    18.1. Competition Deep Dive

        18.1.1. Alapala, Alvan Blanch Development Co.

            18.1.1.1. Overview

            18.1.1.2. Product Portfolio

            18.1.1.3. Profitability by Market Segments (Product/Age /Sales Channel/Region)

            18.1.1.4. Sales Footprint

            18.1.1.5. Strategy Overview

                18.1.1.5.1. Marketing Strategy

                18.1.1.5.2. Product Strategy

                18.1.1.5.3. Channel Strategy

        18.1.2. Beccaria S.r.l.

            18.1.2.1. Overview

            18.1.2.2. Product Portfolio

            18.1.2.3. Profitability by Market Segments (Product/Age /Sales Channel/Region)

            18.1.2.4. Sales Footprint

            18.1.2.5. Strategy Overview

                18.1.2.5.1. Marketing Strategy

                18.1.2.5.2. Product Strategy

                18.1.2.5.3. Channel Strategy

        18.1.3. Brabender GmbH and Co. KG Buhler AG

            18.1.3.1. Overview

            18.1.3.2. Product Portfolio

            18.1.3.3. Profitability by Market Segments (Product/Age /Sales Channel/Region)

            18.1.3.4. Sales Footprint

            18.1.3.5. Strategy Overview

                18.1.3.5.1. Marketing Strategy

                18.1.3.5.2. Product Strategy

                18.1.3.5.3. Channel Strategy

        18.1.4. Erich NETZSCH GmbH and Co. Holding KG

            18.1.4.1. Overview

            18.1.4.2. Product Portfolio

            18.1.4.3. Profitability by Market Segments (Product/Age /Sales Channel/Region)

            18.1.4.4. Sales Footprint

            18.1.4.5. Strategy Overview

                18.1.4.5.1. Marketing Strategy

                18.1.4.5.2. Product Strategy

                18.1.4.5.3. Channel Strategy

        18.1.5. FRITSCH GmBH

            18.1.5.1. Overview

            18.1.5.2. Product Portfolio

            18.1.5.3. Profitability by Market Segments (Product/Age /Sales Channel/Region)

            18.1.5.4. Sales Footprint

            18.1.5.5. Strategy Overview

                18.1.5.5.1. Marketing Strategy

                18.1.5.5.2. Product Strategy

                18.1.5.5.3. Channel Strategy

        18.1.6. FUCHS Maschinen AG

            18.1.6.1. Overview

            18.1.6.2. Product Portfolio

            18.1.6.3. Profitability by Market Segments (Product/Age /Sales Channel/Region)

            18.1.6.4. Sales Footprint

            18.1.6.5. Strategy Overview

                18.1.6.5.1. Marketing Strategy

                18.1.6.5.2. Product Strategy

                18.1.6.5.3. Channel Strategy

        18.1.7. Glen Mills Inc.

            18.1.7.1. Overview

            18.1.7.2. Product Portfolio

            18.1.7.3. Profitability by Market Segments (Product/Age /Sales Channel/Region)

            18.1.7.4. Sales Footprint

            18.1.7.5. Strategy Overview

                18.1.7.5.1. Marketing Strategy

                18.1.7.5.2. Product Strategy

                18.1.7.5.3. Channel Strategy

        18.1.8. Hosokawa Micron Corp.

            18.1.8.1. Overview

            18.1.8.2. Product Portfolio

            18.1.8.3. Profitability by Market Segments (Product/Age /Sales Channel/Region)

            18.1.8.4. Sales Footprint

            18.1.8.5. Strategy Overview

                18.1.8.5.1. Marketing Strategy

                18.1.8.5.2. Product Strategy

                18.1.8.5.3. Channel Strategy

        18.1.9. IDEX Corp.

            18.1.9.1. Overview

            18.1.9.2. Product Portfolio

            18.1.9.3. Profitability by Market Segments (Product/Age /Sales Channel/Region)

            18.1.9.4. Sales Footprint

            18.1.9.5. Strategy Overview

                18.1.9.5.1. Marketing Strategy

                18.1.9.5.2. Product Strategy

                18.1.9.5.3. Channel Strategy

        18.1.10. IKA Werke GmbH and CO. KG

            18.1.10.1. Overview

            18.1.10.2. Product Portfolio

            18.1.10.3. Profitability by Market Segments (Product/Age /Sales Channel/Region)

            18.1.10.4. Sales Footprint

            18.1.10.5. Strategy Overview

                18.1.10.5.1. Marketing Strategy

                18.1.10.5.2. Product Strategy

                18.1.10.5.3. Channel Strategy

        18.1.11. Isimsan Muh. San ve Tic. A.S.

            18.1.11.1. Overview

            18.1.11.2. Product Portfolio

            18.1.11.3. Profitability by Market Segments (Product/Age /Sales Channel/Region)

            18.1.11.4. Sales Footprint

            18.1.11.5. Strategy Overview

                18.1.11.5.1. Marketing Strategy

                18.1.11.5.2. Product Strategy

                18.1.11.5.3. Channel Strategy

        18.1.12. Jas Enterprises

            18.1.12.1. Overview

            18.1.12.2. Product Portfolio

            18.1.12.3. Profitability by Market Segments (Product/Age /Sales Channel/Region)

            18.1.12.4. Sales Footprint

            18.1.12.5. Strategy Overview

                18.1.12.5.1. Marketing Strategy

                18.1.12.5.2. Product Strategy

                18.1.12.5.3. Channel Strategy

        18.1.13. Kice Industries Inc.

            18.1.13.1. Overview

            18.1.13.2. Product Portfolio

            18.1.13.3. Profitability by Market Segments (Product/Age /Sales Channel/Region)

            18.1.13.4. Sales Footprint

            18.1.13.5. Strategy Overview

                18.1.13.5.1. Marketing Strategy

                18.1.13.5.2. Product Strategy

                18.1.13.5.3. Channel Strategy

        18.1.14. Mill Powder Tech Co. Ltd.

            18.1.14.1. Overview

            18.1.14.2. Product Portfolio

            18.1.14.3. Profitability by Market Segments (Product/Age /Sales Channel/Region)

            18.1.14.4. Sales Footprint

            18.1.14.5. Strategy Overview

                18.1.14.5.1. Marketing Strategy

                18.1.14.5.2. Product Strategy

                18.1.14.5.3. Channel Strategy

        18.1.15. Omas Srl

            18.1.15.1. Overview

            18.1.15.2. Product Portfolio

            18.1.15.3. Profitability by Market Segments (Product/Age /Sales Channel/Region)

            18.1.15.4. Sales Footprint

            18.1.15.5. Strategy Overview

                18.1.15.5.1. Marketing Strategy

                18.1.15.5.2. Product Strategy

                18.1.15.5.3. Channel Strategy

        18.1.16. ProXES GmbH

            18.1.16.1. Overview

            18.1.16.2. Product Portfolio

            18.1.16.3. Profitability by Market Segments (Product/Age /Sales Channel/Region)

            18.1.16.4. Sales Footprint

            18.1.16.5. Strategy Overview

                18.1.16.5.1. Marketing Strategy

                18.1.16.5.2. Product Strategy

                18.1.16.5.3. Channel Strategy

        18.1.17. Royal Duyvis Wiener BV

            18.1.17.1. Overview

            18.1.17.2. Product Portfolio

            18.1.17.3. Profitability by Market Segments (Product/Age /Sales Channel/Region)

            18.1.17.4. Sales Footprint

            18.1.17.5. Strategy Overview

                18.1.17.5.1. Marketing Strategy

                18.1.17.5.2. Product Strategy

                18.1.17.5.3. Channel Strategy

        18.1.18. Satake Corp

            18.1.18.1. Overview

            18.1.18.2. Product Portfolio

            18.1.18.3. Profitability by Market Segments (Product/Age /Sales Channel/Region)

            18.1.18.4. Sales Footprint

            18.1.18.5. Strategy Overview

                18.1.18.5.1. Marketing Strategy

                18.1.18.5.2. Product Strategy

                18.1.18.5.3. Channel Strategy

19. Assumptions & Acronyms Used

20. Research Methodology

Explore Process Automation Insights

View Reports
Future Market Insights

Industrial Food Milling Machine Market