Industrial Hose Assembly Market Size and Forecast Outlook 2025 to 2035

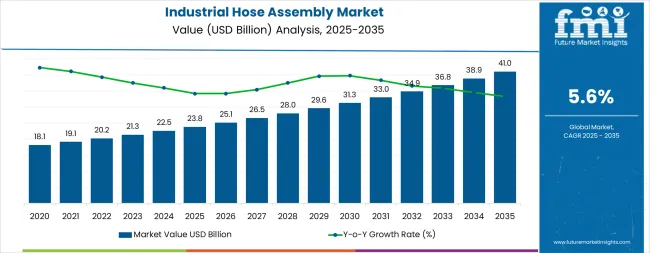
The global industrial hose assembly market is poised to expand from USD 23.8 billion in 2025 to USD 40.9 billion by 2035, reflecting a steady CAGR of 5.6% over the forecast period. The market is driven by rising demand across diverse industries, including oil & gas, chemicals, construction, automotive, and food & beverage.

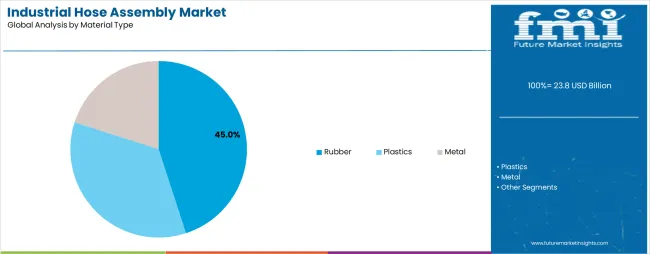
As industries move toward automation and advanced fluid transfer technologies, industrial hose assemblies continue to gain prominence due to their versatility, pressure resistance, and material diversity. Rubber remains the dominant material type, accounting for over 57.4% of the market due to its durability and suitability for a wide range of operational conditions.

A key driver of the market is the expanding application scope in sanitation-sensitive industries such as food processing and pharmaceuticals, where FDA-approved and high-sanitization hoses are now essential.

Additionally, the surge in construction and mining activities, especially in emerging markets, has pushed demand for medium-pressure hoses that balance cost, flexibility, and performance. With regional growth led by India and Southeast Asia, manufacturers are investing in capacity expansion and regional distribution to meet localized demand.

Government regulations in the industrial hose assembly market primarily revolve around safety, environmental compliance, and material standards, especially for applications involving food, pharmaceuticals, chemicals, and hazardous fluids.

Regulatory bodies such as the Occupational Safetyand Health Administration (OSHA) and the Environmental Protection Agency (EPA)in the United States, along with international standards like ISO 18752 and REACH, mandate strict guidelines on pressure ratings, material composition, and chemical resistance. For food and beverage applications, FDA approval is required for hoses that come in contact with consumables, ensuring non-toxicity and hygiene.

Moreover, environmental legislation is pushing for low-emission, recyclable materials and extended product lifecycle requirements, particularly in Europe and North America. Compliance with these evolving standards is crucial for manufacturers to maintain global market access and minimize liability risks.

Metric Value
Industry Size (2025E) USD 23.8 billion
Industry Value (2035F) USD 40.9 billion
CAGR (2025 to 2035) 5.6%

Industrial Hose Assembly Market Analyzed by Top Investment Segments

The market is segmented by material type into rubber, plastics, and metal; byproduct type into low pressure, medium pressure, and high pressure; and bycomponent type into industrial hose assemblies and industrial hose fittings.

Based on end user, the market is categorized into food & beverages, construction & mining, chemical & pharmaceuticals, oil & gas, automotive, agriculture, general manufacturing, and others (marine & shipbuilding, HVAC, power generation, waste management, pulp & paper, and textile industries). Regionally, the market is analyzed across North America, Latin America, Western Europe, Eastern Europe, South Asia, and Pacific, East Asia, and the Middle East and Africa.

Industrial Hose Assembly Market Analysis by Material Type

By material type, rubber hoses dominate the market, with an estimated valuation of USD 13.6 billion in 2025, projected to reach USD 23.8 billion by 2035, growing at a CAGR of 5.8%. Rubber’s superior flexibility, resistance to abrasion, and suitability for a wide range of temperatures and pressures make it ideal for applications in construction, oil & gas, and food processing.

Natural rubber, nitrile, and styrene-butadiene variants are widely adopted across the general manufacturing and chemical sectors. However, rubber hoses face challenges in UV exposure and chemical compatibility, requiring additional coatings or reinforcements.

Plastic hoses, including polyurethane (PU), polyvinyl chloride (PVC), and thermoplastic variants, are preferred for their lightweight structure, low cost, and corrosion resistance drive adoption in medium-pressure applications and portable systems, particularly in agriculture and food & beverage. Limitations around temperature resistance and mechanical wear, however, restrict their usage in heavy-duty applications.

Metal hoses are also anticipated to gain significant traction. Stainless steel and other metallic constructions are preferred in high-pressure and high-temperature environments, such as in refineries, chemical processing, and aerospace. Despite their durability and performance under extreme conditions, high cost and lack of flexibility compared to rubber or plastic variants limit broader use in cost-sensitive sectors.

Material Type CAGR (2025 to 2035)
Rubber 5.8%

Industrial Hose Assembly Market Analysis by Product Type

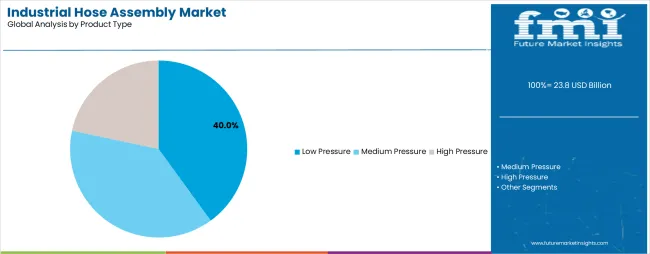
By product type, medium pressure hosesare preferred for their optimal balance between durability, weight, and cost makes them highly suitable for food & beverage, agriculture, and general industrial applications. Materials like thermoplastic rubber, PVC, and polyurethane are commonly used due to their flexibility and hygiene compliance, especially in food-grade environments. The segment benefits from increasing demand for sanitary fluid transfer and cost-effective solutions in mid-range operating conditions.

Low-pressure hoses are projected to observe significant demand. These hoses are primarily used in applications with minimal mechanical stress, such as air ventilation, dust collection, and drainage. While cost-effective and lightweight, their limited applicability to heavy-duty or high-temperature settings is a growth restraint.

High-pressure hoses are projected to rise from USD 5.2 billion in 2025 to USD 9.1 billion by 2035, registering a CAGR of 5.7%. They are extensively used in construction, mining, oil & gas, and hydraulic applications due to their strength and resistance to extreme conditions. Reinforced with steel wire or aramid fiber, these hoses offer superior performance but face challenges around weight and higher manufacturing costs, which can limit adoption in lower-budget segments.

Product Type CAGR (2025 to 2035)
High Pressure 5.7%

Industrial Hose Assembly Market Analysis by Component Type

By component type, industrial hose assemblies form the larger market segment, estimated at USD 15.9 billion in 2025 and projected to reach USD 27.7 billion by 2035, growing at a CAGR of 5.7%. These assemblies, which include the hose, couplings, and any reinforcements, are widely used across industries due to their ready-to-install nature, improved operational efficiency, and compatibility with a variety of pressure ratings and materials.

Their popularity is driven by the increasing need for integrated, leak-proof systems in sectors like oil & gas, construction, and chemicals. However, customization complexity and higher upfront costs for bespoke solutions can be a constraint.

Industrial hose fittingsare critical for connecting hoses to machinery, pipelines, or storage tanks, with precision and material compatibility being crucial for preventing system failures. Growth is supported by retrofitting needs in legacy systems and rising demand for corrosion-resistant materials like stainless steel and brass. However, increased reliance on prefabricated assemblies in some industries may reduce standalone fitting demand over time.

Component Type CAGR (2025 to 2035)
Industrial Hose Assemblies 5.7%

Industrial Hose Assembly Market Analysis by End User

By end user, the construction & mining segment leads the market, valued at USD 5.9 billion in 2025 and forecast to reach USD 10.6 billion by 2035, growing at a CAGR of 6.1%. This growth is driven by expanding infrastructure development and mining activities in Asia-Pacific, the Middle East, and Africa. The need for high-pressure, abrasion-resistant hoses in excavation, slurry transfer, and hydraulic systems fuels demand. However, fluctuating raw material prices and project delays in developing regions can restrain growth.

Industrial hose assemblies are extensively used across food & beverages, chemicals & pharmaceuticals, oil & gas, automotive, agriculture, general manufacturing, and related sectors due to their versatility and ability to handle diverse materials under varying pressure, temperature, and chemical conditions. In the food & beverage industry, hose assemblies ensure hygienic fluid transfer, meeting stringent sanitation standards for ingredients and cleaning agents.

The chemical and pharmaceutical sectors rely on specialized hoses for safe conveyance of corrosive, volatile, or sterile compounds, where material compatibility and contamination prevention are critical. Oil & gas operations use robust hose assemblies for drilling muds, fuel, hydraulic fluids, and chemical injection, where extreme pressure and rugged durability are essential. Automotive applications include coolant, fuel, and brake line transfer, demanding high flexibility and resistance to abrasion.

In agriculture, hose assemblies aid in irrigation, pesticide application, and fluid delivery to farming machinery. General manufacturing uses hoses for compressed air, water, and lubrication, supporting varied production processes. These assemblies also offer modularity, easy installation, and low maintenance, making them indispensable across sectors seeking reliability and efficiency in fluid and gas transfer systems.

End User CAGR (2025 to 2035)
Construction & Mining 6.1%

Industrial Hose Assembly Market Analysis by Top Countries

China

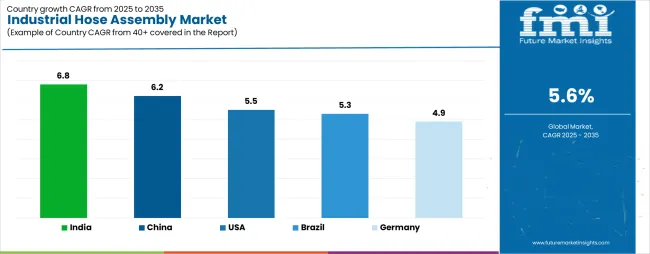
China industrial hose assembly market is projected to grow at a CAGR of 6.2% from 2025 to 2035, China is expected to maintain its position as the largest market through the forecast period. The country’s dominance in the construction, mining, and automotive sectors is the key contributor to rising hose assembly consumption, particularly medium and high-pressure variants.

Additionally, China’s rapid adoption of automation and clean energy practices necessitates technologically advanced hose systems with high chemical resistance and durability. The growing adoption of hydraulic systems in mining and agricultural equipment also boosts demand.

However, challenges such as raw material volatility and increasing regulatory pressure on industrial emissions may pose constraints. Yet, local manufacturing capabilities and robust infrastructure initiatives under China’s Five-Year Plans will likely sustain momentum and keep the country at the forefront of global sales.

Country CAGR (2025 to 2035)
China 6.2%

United States

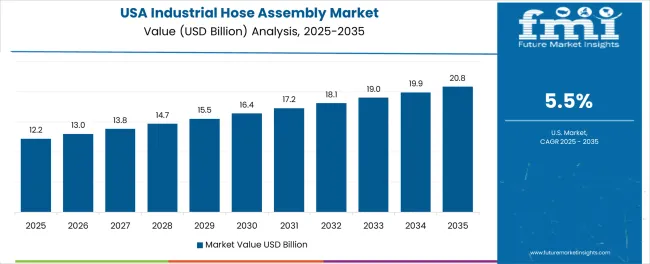
The United States industrial hose assembly market is likely to grow at a CAGR of 5.5%from 2025 to 2035. Key drivers include a well-developed oil & gas industry, an advanced manufacturing sector, and consistent investments in infrastructure upgrades. High-pressure hose assemblies are in significant demand across hydraulic fracturing, chemical processing, and construction applications.

The USA also has stringent OSHA and EPA regulations, encouraging the use of high-compliance, durable hose systems across critical sectors. Furthermore, a robust aftermarket for industrial parts and equipment supports the steady growth of hose fittings and assemblies in MRO (Maintenance, Repair, and Operations) applications.

The country’s leadership in innovation, particularly from firms like Gates Corporation and Parker Hannifin, ensures continuous development in hose material technology. However, competition from low-cost imports and fluctuating demand in cyclical industries may introduce short-term volatility, though long-term growth remains stable.

Country CAGR (2025 to 2035)
United States 5.5%

India

India’s industrial hose assembly market is likely to grow at a CAGR of 6.8%from 2025 to 2035, making it the fastest-growing among the top 10 countries. The growth is fueled by rising demand in the construction, agriculture, and chemical processing sectors. Government initiatives such as “Make in India” and large-scale infrastructure investments are bolstering local manufacturing and driving higher hose assembly consumption.

India’s increasing mechanization in agriculture and rapid growth in mining activities across states like Odisha, Jharkhand, and Chhattisgarh are further contributing to demand for medium and high-pressure hoses. The need for sanitary-grade hoses in the booming pharmaceutical and food processing sectors is also rising.

Challenges remain around standardization and fragmented distribution networks, but improving regulations and foreign direct investments are accelerating market maturity. Indian manufacturers like Polyhose India Pvt. Ltd. are expanding capacity and exports, contributing to both domestic and global supply chains.

Country CAGR (2025 to 2035)
India 6.8%

Germany

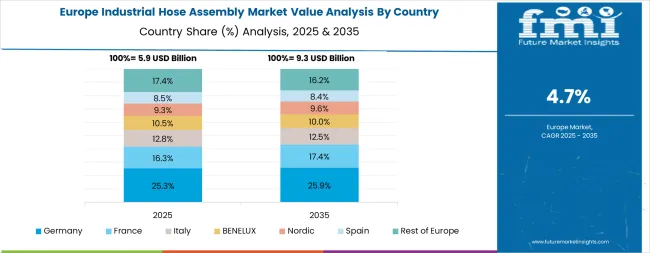
Germany’s industrial hose assembly market is expected to grow at a CAGR of 4.9% during the forecast period. As Europe's largest industrial economy, Germany’s dominance in the automotive, engineering, and chemical sectors underpins its high demand for precision hose assemblies. The country places strong emphasis on safety, durability, and environmental compliance, boosting the use of high-performance rubber and metal hose assemblies.

German manufacturers often require highly specialized hose systems that can handle extreme pressures, temperatures, and corrosive environments, particularly in sectors like automotive R&D and specialty chemicals. Leading global players like Semperit and Trelleborg AB maintain a strong presence in the country.

However, the market faces cost pressures and regulatory shifts due to the EU’s Green Deal policies, which aim for industrial decarbonization. While growth is steady, Germany’s mature industrial base offers limited room for volume expansion, but it remains a key innovation hub for advanced hose technologies.

Country CAGR (2025 to 2035)
Germany 4.9%

Japan

Japan’s industrial hose assembly market is projected at grow at a CAGR of 4.7%from 2025 to 2035. The country’s mature manufacturing ecosystem, especially in automotive, electronics, and shipbuilding, drives the demand for high-precision, compact hose assemblies. Japan’s manufacturing firms place a premium on lightweight materials, vibration resistance, and long service life, encouraging the adoption of advanced thermoplastics and composite materials.

The government’s push for smart factory automation and increased energy efficiency across industries further fuels demand for technically superior hose assemblies. While growth is moderate compared to emerging economies, Japan maintains a consistent replacement cycle and demand for retrofitting solutions in existing equipment.

Domestic suppliers often specialize in high-margin, application-specific solutions, reducing price sensitivity and ensuring stability. However, demographic challenges and outsourcing trends pose moderate headwinds for sustained expansion. Still, Japan remains a benchmark for product quality and innovation in this industry.

Country CAGR (2025 to 2035)
Japan 4.7%

Brazil

Brazil’s industrial hose assembly market is estimated to grow at a CAGR of 5.3%from 2025 to 2035. As the largest economy in Latin America, Brazil’s demand is primarily driven by its robust mining, agriculture, and oil & gas sectors. Extensive use of hose assemblies in applications such as slurry transfer, irrigation systems, and oil transportation pipelines underpins market performance.

The government’s focus on infrastructure modernization and investment in renewable energy has further catalyzed demand for hose fittings and assemblies, especially in remote industrial operations. However, Brazil faces structural challenges, including fluctuating commodity prices and regulatory delays, which may hinder consistent project execution.

Despite this, domestic manufacturers and distributors are expanding networks to better serve rural and industrial zones. Partnerships with international hose brands have also improved product availability and compliance with global standards, positioning Brazil as a strategic hub for regional growth.

Country CAGR (2025 to 2035)
Brazil 5.3%

South Korea

South Korea’s industrial hose assembly market is likely to grow at aCAGR of 5% from 2025 to 2035. Known for its high-tech manufacturing base in electronics, automotive, and shipbuilding, South Korea drives demand for precision-engineered hose assemblies.

The country’s growing emphasis on environmental compliance and energy efficiency has led to the adoption of lightweight, low-emission materials in hose construction. Industrial automation and robotics integration also boost the need for customized hose systems that can support rapid motion and high-pressure applications. While domestic production remains strong, high reliance on imports for specialized fittings and raw materials can introduce supply chain risks.

Nevertheless, government support for innovation, especially in green industries and smart factories, is likely to ensure continued demand. South Korea also plays a key role in global electronics and semiconductor supply chains, where precision hose applications are critical for chemical handling and cooling systems.

Country CAGR (2025 to 2035)
South Korea 5%

France

France’s industrial hose assembly market is set to grow at a CAGR of 4.6% through 2035. The country benefits from a diversified industrial economy encompassing pharmaceuticals, food & beverage, automotive, and aerospace. In particular, France's stringent hygiene and safety regulations fuel demand for FDA-approved and EU-compliant hose assemblies in sensitive applications.

High adoption of automation and robotics in manufacturing processes also increases the need for flexible, durable hose assemblies capable of operating in dynamic environments. Although the market is relatively mature, steady replacement cycles and demand for retrofitting existing equipment keep aftermarket sales strong. Government-driven sustainability goals are also prompting a shift toward recyclable materials and energy-efficient systems.

French manufacturers tend to prioritize reliability, lifecycle cost, and regulatory compliance, maintaining demand for high-quality products. Despite moderate growth, the country remains a key market for value-added industrial hose solutions within the broader European landscape.

Country CAGR (2025 to 2035)
France 4.6%

United Kingdom

The United Kingdom’s industrial hose assembly market is likely to grow at a CAGR of 4.5% forecast through 2035. The UK’s market is anchored by sectors like chemicals, pharmaceuticals, food processing, and construction. With strong adherence to quality and safety regulations, especially post-Brexit, the demand for standardized, traceable industrial hose components has risen.

The UK’s chemical and pharmaceutical industries require hoses capable of high chemical resistance and sanitary compliance. Additionally, efforts to modernize infrastructure and invest in renewable energy are boosting adoption in the construction and utilities sectors. However, inflationary pressures, post-Brexit trade uncertainties, and labor shortages have introduced constraints to market fluidity.

Despite this, innovation in materials and customization is helping UK-based suppliers remain competitive. Demand is expected to remain steady in high-value applications, and collaboration with EU and global suppliers continues to ensure access to advanced technologies.

Country CAGR (2025 to 2035)
United Kingdom 4.5%

Italy

Italy’s industrial hose assembly market is projected to grow at a CAGR of 4.3%. Italy’s strength lies in its extensive base of small and medium-sized enterprises (SMEs) operating in machinery, automotive, and food processing. These sectors heavily rely on low to medium pressure hose assemblies for conveying fluids, compressed air, and food-grade materials. Italian manufacturers are known for precision engineering and export a significant share of hose assemblies across Europe.

However, domestic demand growth is somewhat constrained by a slow pace of industrial modernization and regulatory bottlenecks. That said, Italy is investing in energy-efficient technologies and upgrading factory equipment, which could revitalize demand for high-performance hose systems. The country’s strategic position within the EU and strong integration into European supply chains ensure sustained market relevance, though the growth trajectory remains moderate relative to larger or more rapidly industrializing economies.

Country CAGR (2025 to 2035)
Italy 4.3%

Industrial Hose Assembly Market Players’ Share and Strategy Analysis

Company Name Estimated Market Share
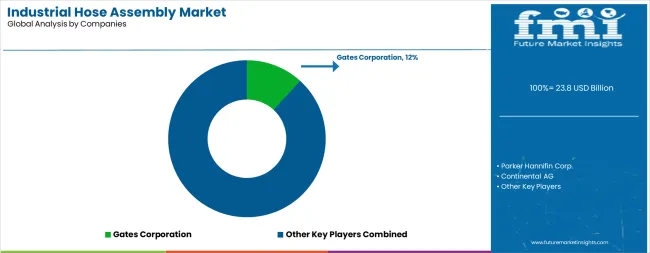
Gates Corporation 15%
Parker Hannifin Corp. 12%
Continental AG 10%
Eaton Corporation Plc. 6%
Trelleborg AB 5%

The global industrial hose assembly market is moderately consolidated, with the top five companies collectively accounting for approximately 45-50% of global revenues. Gates Corporation holds the leading position with an estimated market share of around 15%, driven by its global distribution network, robust R&D investments, and broad product portfolio covering high-pressure and specialty hose applications.

Parker Hannifin Corp. follows closely with a share of approximately 12%, leveraging its presence in fluid and motion control technologies across automotive, aerospace, and industrial sectors. Continental AG commands nearly 10%, benefiting from its material science expertise and proprietary high-performance rubber compounds. Eaton Corporation Plc. and Trelleborg AB round out the top five, with shares of 6% and 5% respectively, focusing on high-value applications and custom-engineered systems in oil & gas, construction, and marine sectors.

Leading players in this market focus on several key strategies to retain a competitive advantage. First, they are actively investing in product innovation, particularly around high-durability and specialty hoses for demanding environments, chemical handling, offshore operations, and cleanroom settings.

Second, global players emphasize strategic acquisitions to expand geographic reach and enhance capabilities. For instance, Trelleborg's acquisition of VB Seals has strengthened its sealing solutions and regional footprint in North America. Additionally, digital transformation initiatives such as predictive maintenance technologies and smart hose tracking systems are gaining traction to increase customer retention and value-added services.

In contrast, small and mid-sized players such as Polyhose India Pvt. Ltd., RYCO Hydraulics, and RADCOFLEX Australia Pty Ltd. are carving out market space through niche specialization, price competitiveness, and regional partnerships. These companies focus on customized hose assemblies, rapid turnaround times, and adaptability to local industry requirements. They often operate in markets underserved by global giants and offer flexible service models that cater to OEMs and small distributors.

The competitive landscape is further shaped by regional demand dynamics, compliance standards, and logistical efficiency. As end-use industries become more performance-sensitive, both multinational and regional players are under pressure to offer durable, certified, and cost-effective hose solutions.

While major players continue to push forward with innovation and global scale, smaller players remain resilient by capitalizing on agility, relationship-building, and aftermarket service excellence. This balance keeps the market dynamic and provides customers with a wide spectrum of product and service options.

Report Scope for the Global Industrial Hose Assembly Market

Attribute Details
Current Total Market Size (2025) USD 23.8 billion
Projected Market Size (2035) USD 40.9 billion
CAGR (2025 to 2035) 5.6%
Base Year for Estimation 2024
Historical Period 2020 to 2024
Projections Period 2025 to 2035
Report Parameter Revenue in USD billion
By Material Type Rubber, Plastics, and Metal
By Product Type Low Pressure, Medium Pressure, and High Pressure
By Component Type Industrial Hose Assemblies and Industrial Hose Fittings
By End User Food & Beverages, Construction & Mining, Chemical & Pharmaceuticals, Oil & Gas, Automotive, Agriculture, General Manufacturing, and Others ( marine & shipbuilding, HVAC, power generation, waste management, pulp & paper, and textile industries)
Regions Covered North America, Latin America, Western Europe, South Asia, East Asia, Eastern Europe, and the Middle East & Africa
Countries Covered United States, Japan, Germany, India, United Kingdom, France, Italy, Brazil, Canada, South Korea, Australia, Spain, Netherlands, Saudi Arabia, Switzerland
Key Players Gates Corporation, Parker Hannifin Corp., Semperit AG Holding, Campbell Fittings, Inc., United Flexible, Continental AG, Eaton Corporation Plc, Polyhose India Pvt. Ltd., Trelleborg AB, RYCO Hydraulics, and RADCOFLEX Australia Pty Ltd.
Additional Attributes Dollar sales by value, market share analysis by region, and country-wise analysis

Segmentation

By Material Type:

  • Rubber
  • Plastics
  • Metal

By Product Type:

  • Low Pressure
  • Medium Pressure
  • High Pressure

By Component Type:

  • Industrial Hose Assemblies
  • Industrial Hose Fittings

By End User:

  • Food & Beverages
  • Construction & Mining
  • Chemical & Pharmaceuticals
  • Oil & Gas
  • Automotive
  • Agriculture
  • General Manufacturing
  • Others (Marine & Shipbuilding, HVAC, Power Generation, Waste Management, Pulp & Paper, And Textile Industries)

By Region:

  • North America
  • Latin America
  • Western Europe
  • Eastern Europe
  • South Asia and Pacific
  • East Asia
  • Middle East and Africa

Table of Content

  1. Executive Summary
  2. Market Overview
  3. Market Background
  4. Global Market Analysis 2020 to 2024 and Forecast, 2025 to 2035
  5. Global Market Analysis 2020 to 2024 and Forecast 2025 to 2035, By Material Type
    • Rubber
    • Plastics
    • Metal
  6. Global Market Analysis 2020 to 2024 and Forecast 2025 to 2035, By Product Type
    • Low Pressure
    • Medium Pressure
    • High Pressure
  7. Global Market Analysis 2020 to 2024 and Forecast 2025 to 2035, By Component Type
    • Industrial Hose Assemblies
    • Industrial Hose Fittings
  8. Global Market Analysis 2020 to 2024 and Forecast 2025 to 2035, By End User
    • Food & Beverages
    • Construction & Mining
    • Chemical & Pharmaceuticals
    • Oil & Gas
    • Automotive
    • Agriculture
    • General Manufacturing
    • Others (Marine & Shipbuilding, HVAC, Power Generation, Waste Management, Pulp & Paper, And Textile Industries)
  9. Global Market Analysis 2020 to 2024 and Forecast 2025 to 2035, By Region
    • North America
    • Latin America
    • Western Europe
    • Eastern Europe
    • South Asia and Pacific
    • East Asia
    • Middle East and Africa
  10. North America Market Analysis 2020 to 2024 and Forecast 2025 to 2035, By Country
  11. Latin America Market Analysis 2020 to 2024 and Forecast 2025 to 2035, By Country
  12. Western Europe Market Analysis 2020 to 2024 and Forecast 2025 to 2035, By Country
  13. Eastern Europe Market Analysis 2020 to 2024 and Forecast 2025 to 2035, By Country
  14. South Asia and Pacific Market Analysis 2020 to 2024 and Forecast 2025 to 2035, By Country
  15. East Asia Market Analysis 2020 to 2024 and Forecast 2025 to 2035, By Country
  16. Middle East and Africa Market Analysis 2020 to 2024 and Forecast 2025 to 2035, By Country
  17. Key Countries Market Analysis
  18. Market Structure Analysis
  19. Competition Analysis
    • Gates Corporation
    • Parker Hannifin Corp.
    • Semperit AG Holding
    • Campbell Fittings, Inc.
    • United Flexible
    • Continental AG
    • Eaton Corporation Plc.
    • Polyhose India Pvt. Ltd.
    • Trelleborg AB
    • RYCO Hydraulics
    • RADCOFLEX Australia Pty Ltd.
  20. Assumptions & Acronyms Used
  21. Research Methodology

List of Tables

Table 1: Global Market Value (US$ Million) Forecast by Region, 2019 to 2034

Table 2: Global Market Volume (Units) Forecast by Region, 2019 to 2034

Table 3: Global Market Value (US$ Million) Forecast by Material Type, 2019 to 2034

Table 4: Global Market Volume (Units) Forecast by Material Type, 2019 to 2034

Table 5: Global Market Value (US$ Million) Forecast by Product Type, 2019 to 2034

Table 6: Global Market Volume (Units) Forecast by Product Type, 2019 to 2034

Table 7: Global Market Value (US$ Million) Forecast by Component Type, 2019 to 2034

Table 8: Global Market Volume (Units) Forecast by Component Type, 2019 to 2034

Table 9: Global Market Value (US$ Million) Forecast by End User, 2019 to 2034

Table 10: Global Market Volume (Units) Forecast by End User, 2019 to 2034

Table 11: North America Market Value (US$ Million) Forecast by Country, 2019 to 2034

Table 12: North America Market Volume (Units) Forecast by Country, 2019 to 2034

Table 13: North America Market Value (US$ Million) Forecast by Material Type, 2019 to 2034

Table 14: North America Market Volume (Units) Forecast by Material Type, 2019 to 2034

Table 15: North America Market Value (US$ Million) Forecast by Product Type, 2019 to 2034

Table 16: North America Market Volume (Units) Forecast by Product Type, 2019 to 2034

Table 17: North America Market Value (US$ Million) Forecast by Component Type, 2019 to 2034

Table 18: North America Market Volume (Units) Forecast by Component Type, 2019 to 2034

Table 19: North America Market Value (US$ Million) Forecast by End User, 2019 to 2034

Table 20: North America Market Volume (Units) Forecast by End User, 2019 to 2034

Table 21: Latin America Market Value (US$ Million) Forecast by Country, 2019 to 2034

Table 22: Latin America Market Volume (Units) Forecast by Country, 2019 to 2034

Table 23: Latin America Market Value (US$ Million) Forecast by Material Type, 2019 to 2034

Table 24: Latin America Market Volume (Units) Forecast by Material Type, 2019 to 2034

Table 25: Latin America Market Value (US$ Million) Forecast by Product Type, 2019 to 2034

Table 26: Latin America Market Volume (Units) Forecast by Product Type, 2019 to 2034

Table 27: Latin America Market Value (US$ Million) Forecast by Component Type, 2019 to 2034

Table 28: Latin America Market Volume (Units) Forecast by Component Type, 2019 to 2034

Table 29: Latin America Market Value (US$ Million) Forecast by End User, 2019 to 2034

Table 30: Latin America Market Volume (Units) Forecast by End User, 2019 to 2034

Table 31: Western Europe Market Value (US$ Million) Forecast by Country, 2019 to 2034

Table 32: Western Europe Market Volume (Units) Forecast by Country, 2019 to 2034

Table 33: Western Europe Market Value (US$ Million) Forecast by Material Type, 2019 to 2034

Table 34: Western Europe Market Volume (Units) Forecast by Material Type, 2019 to 2034

Table 35: Western Europe Market Value (US$ Million) Forecast by Product Type, 2019 to 2034

Table 36: Western Europe Market Volume (Units) Forecast by Product Type, 2019 to 2034

Table 37: Western Europe Market Value (US$ Million) Forecast by Component Type, 2019 to 2034

Table 38: Western Europe Market Volume (Units) Forecast by Component Type, 2019 to 2034

Table 39: Western Europe Market Value (US$ Million) Forecast by End User, 2019 to 2034

Table 40: Western Europe Market Volume (Units) Forecast by End User, 2019 to 2034

Table 41: Eastern Europe Market Value (US$ Million) Forecast by Country, 2019 to 2034

Table 42: Eastern Europe Market Volume (Units) Forecast by Country, 2019 to 2034

Table 43: Eastern Europe Market Value (US$ Million) Forecast by Material Type, 2019 to 2034

Table 44: Eastern Europe Market Volume (Units) Forecast by Material Type, 2019 to 2034

Table 45: Eastern Europe Market Value (US$ Million) Forecast by Product Type, 2019 to 2034

Table 46: Eastern Europe Market Volume (Units) Forecast by Product Type, 2019 to 2034

Table 47: Eastern Europe Market Value (US$ Million) Forecast by Component Type, 2019 to 2034

Table 48: Eastern Europe Market Volume (Units) Forecast by Component Type, 2019 to 2034

Table 49: Eastern Europe Market Value (US$ Million) Forecast by End User, 2019 to 2034

Table 50: Eastern Europe Market Volume (Units) Forecast by End User, 2019 to 2034

Table 51: South Asia and Pacific Market Value (US$ Million) Forecast by Country, 2019 to 2034

Table 52: South Asia and Pacific Market Volume (Units) Forecast by Country, 2019 to 2034

Table 53: South Asia and Pacific Market Value (US$ Million) Forecast by Material Type, 2019 to 2034

Table 54: South Asia and Pacific Market Volume (Units) Forecast by Material Type, 2019 to 2034

Table 55: South Asia and Pacific Market Value (US$ Million) Forecast by Product Type, 2019 to 2034

Table 56: South Asia and Pacific Market Volume (Units) Forecast by Product Type, 2019 to 2034

Table 57: South Asia and Pacific Market Value (US$ Million) Forecast by Component Type, 2019 to 2034

Table 58: South Asia and Pacific Market Volume (Units) Forecast by Component Type, 2019 to 2034

Table 59: South Asia and Pacific Market Value (US$ Million) Forecast by End User, 2019 to 2034

Table 60: South Asia and Pacific Market Volume (Units) Forecast by End User, 2019 to 2034

Table 61: East Asia Market Value (US$ Million) Forecast by Country, 2019 to 2034

Table 62: East Asia Market Volume (Units) Forecast by Country, 2019 to 2034

Table 63: East Asia Market Value (US$ Million) Forecast by Material Type, 2019 to 2034

Table 64: East Asia Market Volume (Units) Forecast by Material Type, 2019 to 2034

Table 65: East Asia Market Value (US$ Million) Forecast by Product Type, 2019 to 2034

Table 66: East Asia Market Volume (Units) Forecast by Product Type, 2019 to 2034

Table 67: East Asia Market Value (US$ Million) Forecast by Component Type, 2019 to 2034

Table 68: East Asia Market Volume (Units) Forecast by Component Type, 2019 to 2034

Table 69: East Asia Market Value (US$ Million) Forecast by End User, 2019 to 2034

Table 70: East Asia Market Volume (Units) Forecast by End User, 2019 to 2034

Table 71: Middle East and Africa Market Value (US$ Million) Forecast by Country, 2019 to 2034

Table 72: Middle East and Africa Market Volume (Units) Forecast by Country, 2019 to 2034

Table 73: Middle East and Africa Market Value (US$ Million) Forecast by Material Type, 2019 to 2034

Table 74: Middle East and Africa Market Volume (Units) Forecast by Material Type, 2019 to 2034

Table 75: Middle East and Africa Market Value (US$ Million) Forecast by Product Type, 2019 to 2034

Table 76: Middle East and Africa Market Volume (Units) Forecast by Product Type, 2019 to 2034

Table 77: Middle East and Africa Market Value (US$ Million) Forecast by Component Type, 2019 to 2034

Table 78: Middle East and Africa Market Volume (Units) Forecast by Component Type, 2019 to 2034

Table 79: Middle East and Africa Market Value (US$ Million) Forecast by End User, 2019 to 2034

Table 80: Middle East and Africa Market Volume (Units) Forecast by End User, 2019 to 2034

List of Figures

Figure 1: Global Market Value (US$ Million) by Material Type, 2024 to 2034

Figure 2: Global Market Value (US$ Million) by Product Type, 2024 to 2034

Figure 3: Global Market Value (US$ Million) by Component Type, 2024 to 2034

Figure 4: Global Market Value (US$ Million) by End User, 2024 to 2034

Figure 5: Global Market Value (US$ Million) by Region, 2024 to 2034

Figure 6: Global Market Value (US$ Million) Analysis by Region, 2019 to 2034

Figure 7: Global Market Volume (Units) Analysis by Region, 2019 to 2034

Figure 8: Global Market Value Share (%) and BPS Analysis by Region, 2024 to 2034

Figure 9: Global Market Y-o-Y Growth (%) Projections by Region, 2024 to 2034

Figure 10: Global Market Value (US$ Million) Analysis by Material Type, 2019 to 2034

Figure 11: Global Market Volume (Units) Analysis by Material Type, 2019 to 2034

Figure 12: Global Market Value Share (%) and BPS Analysis by Material Type, 2024 to 2034

Figure 13: Global Market Y-o-Y Growth (%) Projections by Material Type, 2024 to 2034

Figure 14: Global Market Value (US$ Million) Analysis by Product Type, 2019 to 2034

Figure 15: Global Market Volume (Units) Analysis by Product Type, 2019 to 2034

Figure 16: Global Market Value Share (%) and BPS Analysis by Product Type, 2024 to 2034

Figure 17: Global Market Y-o-Y Growth (%) Projections by Product Type, 2024 to 2034

Figure 18: Global Market Value (US$ Million) Analysis by Component Type, 2019 to 2034

Figure 19: Global Market Volume (Units) Analysis by Component Type, 2019 to 2034

Figure 20: Global Market Value Share (%) and BPS Analysis by Component Type, 2024 to 2034

Figure 21: Global Market Y-o-Y Growth (%) Projections by Component Type, 2024 to 2034

Figure 22: Global Market Value (US$ Million) Analysis by End User, 2019 to 2034

Figure 23: Global Market Volume (Units) Analysis by End User, 2019 to 2034

Figure 24: Global Market Value Share (%) and BPS Analysis by End User, 2024 to 2034

Figure 25: Global Market Y-o-Y Growth (%) Projections by End User, 2024 to 2034

Figure 26: Global Market Attractiveness by Material Type, 2024 to 2034

Figure 27: Global Market Attractiveness by Product Type, 2024 to 2034

Figure 28: Global Market Attractiveness by Component Type, 2024 to 2034

Figure 29: Global Market Attractiveness by End User, 2024 to 2034

Figure 30: Global Market Attractiveness by Region, 2024 to 2034

Figure 31: North America Market Value (US$ Million) by Material Type, 2024 to 2034

Figure 32: North America Market Value (US$ Million) by Product Type, 2024 to 2034

Figure 33: North America Market Value (US$ Million) by Component Type, 2024 to 2034

Figure 34: North America Market Value (US$ Million) by End User, 2024 to 2034

Figure 35: North America Market Value (US$ Million) by Country, 2024 to 2034

Figure 36: North America Market Value (US$ Million) Analysis by Country, 2019 to 2034

Figure 37: North America Market Volume (Units) Analysis by Country, 2019 to 2034

Figure 38: North America Market Value Share (%) and BPS Analysis by Country, 2024 to 2034

Figure 39: North America Market Y-o-Y Growth (%) Projections by Country, 2024 to 2034

Figure 40: North America Market Value (US$ Million) Analysis by Material Type, 2019 to 2034

Figure 41: North America Market Volume (Units) Analysis by Material Type, 2019 to 2034

Figure 42: North America Market Value Share (%) and BPS Analysis by Material Type, 2024 to 2034

Figure 43: North America Market Y-o-Y Growth (%) Projections by Material Type, 2024 to 2034

Figure 44: North America Market Value (US$ Million) Analysis by Product Type, 2019 to 2034

Figure 45: North America Market Volume (Units) Analysis by Product Type, 2019 to 2034

Figure 46: North America Market Value Share (%) and BPS Analysis by Product Type, 2024 to 2034

Figure 47: North America Market Y-o-Y Growth (%) Projections by Product Type, 2024 to 2034

Figure 48: North America Market Value (US$ Million) Analysis by Component Type, 2019 to 2034

Figure 49: North America Market Volume (Units) Analysis by Component Type, 2019 to 2034

Figure 50: North America Market Value Share (%) and BPS Analysis by Component Type, 2024 to 2034

Figure 51: North America Market Y-o-Y Growth (%) Projections by Component Type, 2024 to 2034

Figure 52: North America Market Value (US$ Million) Analysis by End User, 2019 to 2034

Figure 53: North America Market Volume (Units) Analysis by End User, 2019 to 2034

Figure 54: North America Market Value Share (%) and BPS Analysis by End User, 2024 to 2034

Figure 55: North America Market Y-o-Y Growth (%) Projections by End User, 2024 to 2034

Figure 56: North America Market Attractiveness by Material Type, 2024 to 2034

Figure 57: North America Market Attractiveness by Product Type, 2024 to 2034

Figure 58: North America Market Attractiveness by Component Type, 2024 to 2034

Figure 59: North America Market Attractiveness by End User, 2024 to 2034

Figure 60: North America Market Attractiveness by Country, 2024 to 2034

Figure 61: Latin America Market Value (US$ Million) by Material Type, 2024 to 2034

Figure 62: Latin America Market Value (US$ Million) by Product Type, 2024 to 2034

Figure 63: Latin America Market Value (US$ Million) by Component Type, 2024 to 2034

Figure 64: Latin America Market Value (US$ Million) by End User, 2024 to 2034

Figure 65: Latin America Market Value (US$ Million) by Country, 2024 to 2034

Figure 66: Latin America Market Value (US$ Million) Analysis by Country, 2019 to 2034

Figure 67: Latin America Market Volume (Units) Analysis by Country, 2019 to 2034

Figure 68: Latin America Market Value Share (%) and BPS Analysis by Country, 2024 to 2034

Figure 69: Latin America Market Y-o-Y Growth (%) Projections by Country, 2024 to 2034

Figure 70: Latin America Market Value (US$ Million) Analysis by Material Type, 2019 to 2034

Figure 71: Latin America Market Volume (Units) Analysis by Material Type, 2019 to 2034

Figure 72: Latin America Market Value Share (%) and BPS Analysis by Material Type, 2024 to 2034

Figure 73: Latin America Market Y-o-Y Growth (%) Projections by Material Type, 2024 to 2034

Figure 74: Latin America Market Value (US$ Million) Analysis by Product Type, 2019 to 2034

Figure 75: Latin America Market Volume (Units) Analysis by Product Type, 2019 to 2034

Figure 76: Latin America Market Value Share (%) and BPS Analysis by Product Type, 2024 to 2034

Figure 77: Latin America Market Y-o-Y Growth (%) Projections by Product Type, 2024 to 2034

Figure 78: Latin America Market Value (US$ Million) Analysis by Component Type, 2019 to 2034

Figure 79: Latin America Market Volume (Units) Analysis by Component Type, 2019 to 2034

Figure 80: Latin America Market Value Share (%) and BPS Analysis by Component Type, 2024 to 2034

Figure 81: Latin America Market Y-o-Y Growth (%) Projections by Component Type, 2024 to 2034

Figure 82: Latin America Market Value (US$ Million) Analysis by End User, 2019 to 2034

Figure 83: Latin America Market Volume (Units) Analysis by End User, 2019 to 2034

Figure 84: Latin America Market Value Share (%) and BPS Analysis by End User, 2024 to 2034

Figure 85: Latin America Market Y-o-Y Growth (%) Projections by End User, 2024 to 2034

Figure 86: Latin America Market Attractiveness by Material Type, 2024 to 2034

Figure 87: Latin America Market Attractiveness by Product Type, 2024 to 2034

Figure 88: Latin America Market Attractiveness by Component Type, 2024 to 2034

Figure 89: Latin America Market Attractiveness by End User, 2024 to 2034

Figure 90: Latin America Market Attractiveness by Country, 2024 to 2034

Figure 91: Western Europe Market Value (US$ Million) by Material Type, 2024 to 2034

Figure 92: Western Europe Market Value (US$ Million) by Product Type, 2024 to 2034

Figure 93: Western Europe Market Value (US$ Million) by Component Type, 2024 to 2034

Figure 94: Western Europe Market Value (US$ Million) by End User, 2024 to 2034

Figure 95: Western Europe Market Value (US$ Million) by Country, 2024 to 2034

Figure 96: Western Europe Market Value (US$ Million) Analysis by Country, 2019 to 2034

Figure 97: Western Europe Market Volume (Units) Analysis by Country, 2019 to 2034

Figure 98: Western Europe Market Value Share (%) and BPS Analysis by Country, 2024 to 2034

Figure 99: Western Europe Market Y-o-Y Growth (%) Projections by Country, 2024 to 2034

Figure 100: Western Europe Market Value (US$ Million) Analysis by Material Type, 2019 to 2034

Figure 101: Western Europe Market Volume (Units) Analysis by Material Type, 2019 to 2034

Figure 102: Western Europe Market Value Share (%) and BPS Analysis by Material Type, 2024 to 2034

Figure 103: Western Europe Market Y-o-Y Growth (%) Projections by Material Type, 2024 to 2034

Figure 104: Western Europe Market Value (US$ Million) Analysis by Product Type, 2019 to 2034

Figure 105: Western Europe Market Volume (Units) Analysis by Product Type, 2019 to 2034

Figure 106: Western Europe Market Value Share (%) and BPS Analysis by Product Type, 2024 to 2034

Figure 107: Western Europe Market Y-o-Y Growth (%) Projections by Product Type, 2024 to 2034

Figure 108: Western Europe Market Value (US$ Million) Analysis by Component Type, 2019 to 2034

Figure 109: Western Europe Market Volume (Units) Analysis by Component Type, 2019 to 2034

Figure 110: Western Europe Market Value Share (%) and BPS Analysis by Component Type, 2024 to 2034

Figure 111: Western Europe Market Y-o-Y Growth (%) Projections by Component Type, 2024 to 2034

Figure 112: Western Europe Market Value (US$ Million) Analysis by End User, 2019 to 2034

Figure 113: Western Europe Market Volume (Units) Analysis by End User, 2019 to 2034

Figure 114: Western Europe Market Value Share (%) and BPS Analysis by End User, 2024 to 2034

Figure 115: Western Europe Market Y-o-Y Growth (%) Projections by End User, 2024 to 2034

Figure 116: Western Europe Market Attractiveness by Material Type, 2024 to 2034

Figure 117: Western Europe Market Attractiveness by Product Type, 2024 to 2034

Figure 118: Western Europe Market Attractiveness by Component Type, 2024 to 2034

Figure 119: Western Europe Market Attractiveness by End User, 2024 to 2034

Figure 120: Western Europe Market Attractiveness by Country, 2024 to 2034

Figure 121: Eastern Europe Market Value (US$ Million) by Material Type, 2024 to 2034

Figure 122: Eastern Europe Market Value (US$ Million) by Product Type, 2024 to 2034

Figure 123: Eastern Europe Market Value (US$ Million) by Component Type, 2024 to 2034

Figure 124: Eastern Europe Market Value (US$ Million) by End User, 2024 to 2034

Figure 125: Eastern Europe Market Value (US$ Million) by Country, 2024 to 2034

Figure 126: Eastern Europe Market Value (US$ Million) Analysis by Country, 2019 to 2034

Figure 127: Eastern Europe Market Volume (Units) Analysis by Country, 2019 to 2034

Figure 128: Eastern Europe Market Value Share (%) and BPS Analysis by Country, 2024 to 2034

Figure 129: Eastern Europe Market Y-o-Y Growth (%) Projections by Country, 2024 to 2034

Figure 130: Eastern Europe Market Value (US$ Million) Analysis by Material Type, 2019 to 2034

Figure 131: Eastern Europe Market Volume (Units) Analysis by Material Type, 2019 to 2034

Figure 132: Eastern Europe Market Value Share (%) and BPS Analysis by Material Type, 2024 to 2034

Figure 133: Eastern Europe Market Y-o-Y Growth (%) Projections by Material Type, 2024 to 2034

Figure 134: Eastern Europe Market Value (US$ Million) Analysis by Product Type, 2019 to 2034

Figure 135: Eastern Europe Market Volume (Units) Analysis by Product Type, 2019 to 2034

Figure 136: Eastern Europe Market Value Share (%) and BPS Analysis by Product Type, 2024 to 2034

Figure 137: Eastern Europe Market Y-o-Y Growth (%) Projections by Product Type, 2024 to 2034

Figure 138: Eastern Europe Market Value (US$ Million) Analysis by Component Type, 2019 to 2034

Figure 139: Eastern Europe Market Volume (Units) Analysis by Component Type, 2019 to 2034

Figure 140: Eastern Europe Market Value Share (%) and BPS Analysis by Component Type, 2024 to 2034

Figure 141: Eastern Europe Market Y-o-Y Growth (%) Projections by Component Type, 2024 to 2034

Figure 142: Eastern Europe Market Value (US$ Million) Analysis by End User, 2019 to 2034

Figure 143: Eastern Europe Market Volume (Units) Analysis by End User, 2019 to 2034

Figure 144: Eastern Europe Market Value Share (%) and BPS Analysis by End User, 2024 to 2034

Figure 145: Eastern Europe Market Y-o-Y Growth (%) Projections by End User, 2024 to 2034

Figure 146: Eastern Europe Market Attractiveness by Material Type, 2024 to 2034

Figure 147: Eastern Europe Market Attractiveness by Product Type, 2024 to 2034

Figure 148: Eastern Europe Market Attractiveness by Component Type, 2024 to 2034

Figure 149: Eastern Europe Market Attractiveness by End User, 2024 to 2034

Figure 150: Eastern Europe Market Attractiveness by Country, 2024 to 2034

Figure 151: South Asia and Pacific Market Value (US$ Million) by Material Type, 2024 to 2034

Figure 152: South Asia and Pacific Market Value (US$ Million) by Product Type, 2024 to 2034

Figure 153: South Asia and Pacific Market Value (US$ Million) by Component Type, 2024 to 2034

Figure 154: South Asia and Pacific Market Value (US$ Million) by End User, 2024 to 2034

Figure 155: South Asia and Pacific Market Value (US$ Million) by Country, 2024 to 2034

Figure 156: South Asia and Pacific Market Value (US$ Million) Analysis by Country, 2019 to 2034

Figure 157: South Asia and Pacific Market Volume (Units) Analysis by Country, 2019 to 2034

Figure 158: South Asia and Pacific Market Value Share (%) and BPS Analysis by Country, 2024 to 2034

Figure 159: South Asia and Pacific Market Y-o-Y Growth (%) Projections by Country, 2024 to 2034

Figure 160: South Asia and Pacific Market Value (US$ Million) Analysis by Material Type, 2019 to 2034

Figure 161: South Asia and Pacific Market Volume (Units) Analysis by Material Type, 2019 to 2034

Figure 162: South Asia and Pacific Market Value Share (%) and BPS Analysis by Material Type, 2024 to 2034

Figure 163: South Asia and Pacific Market Y-o-Y Growth (%) Projections by Material Type, 2024 to 2034

Figure 164: South Asia and Pacific Market Value (US$ Million) Analysis by Product Type, 2019 to 2034

Figure 165: South Asia and Pacific Market Volume (Units) Analysis by Product Type, 2019 to 2034

Figure 166: South Asia and Pacific Market Value Share (%) and BPS Analysis by Product Type, 2024 to 2034

Figure 167: South Asia and Pacific Market Y-o-Y Growth (%) Projections by Product Type, 2024 to 2034

Figure 168: South Asia and Pacific Market Value (US$ Million) Analysis by Component Type, 2019 to 2034

Figure 169: South Asia and Pacific Market Volume (Units) Analysis by Component Type, 2019 to 2034

Figure 170: South Asia and Pacific Market Value Share (%) and BPS Analysis by Component Type, 2024 to 2034

Figure 171: South Asia and Pacific Market Y-o-Y Growth (%) Projections by Component Type, 2024 to 2034

Figure 172: South Asia and Pacific Market Value (US$ Million) Analysis by End User, 2019 to 2034

Figure 173: South Asia and Pacific Market Volume (Units) Analysis by End User, 2019 to 2034

Figure 174: South Asia and Pacific Market Value Share (%) and BPS Analysis by End User, 2024 to 2034

Figure 175: South Asia and Pacific Market Y-o-Y Growth (%) Projections by End User, 2024 to 2034

Figure 176: South Asia and Pacific Market Attractiveness by Material Type, 2024 to 2034

Figure 177: South Asia and Pacific Market Attractiveness by Product Type, 2024 to 2034

Figure 178: South Asia and Pacific Market Attractiveness by Component Type, 2024 to 2034

Figure 179: South Asia and Pacific Market Attractiveness by End User, 2024 to 2034

Figure 180: South Asia and Pacific Market Attractiveness by Country, 2024 to 2034

Figure 181: East Asia Market Value (US$ Million) by Material Type, 2024 to 2034

Figure 182: East Asia Market Value (US$ Million) by Product Type, 2024 to 2034

Figure 183: East Asia Market Value (US$ Million) by Component Type, 2024 to 2034

Figure 184: East Asia Market Value (US$ Million) by End User, 2024 to 2034

Figure 185: East Asia Market Value (US$ Million) by Country, 2024 to 2034

Figure 186: East Asia Market Value (US$ Million) Analysis by Country, 2019 to 2034

Figure 187: East Asia Market Volume (Units) Analysis by Country, 2019 to 2034

Figure 188: East Asia Market Value Share (%) and BPS Analysis by Country, 2024 to 2034

Figure 189: East Asia Market Y-o-Y Growth (%) Projections by Country, 2024 to 2034

Figure 190: East Asia Market Value (US$ Million) Analysis by Material Type, 2019 to 2034

Figure 191: East Asia Market Volume (Units) Analysis by Material Type, 2019 to 2034

Figure 192: East Asia Market Value Share (%) and BPS Analysis by Material Type, 2024 to 2034

Figure 193: East Asia Market Y-o-Y Growth (%) Projections by Material Type, 2024 to 2034

Figure 194: East Asia Market Value (US$ Million) Analysis by Product Type, 2019 to 2034

Figure 195: East Asia Market Volume (Units) Analysis by Product Type, 2019 to 2034

Figure 196: East Asia Market Value Share (%) and BPS Analysis by Product Type, 2024 to 2034

Figure 197: East Asia Market Y-o-Y Growth (%) Projections by Product Type, 2024 to 2034

Figure 198: East Asia Market Value (US$ Million) Analysis by Component Type, 2019 to 2034

Figure 199: East Asia Market Volume (Units) Analysis by Component Type, 2019 to 2034

Figure 200: East Asia Market Value Share (%) and BPS Analysis by Component Type, 2024 to 2034

Figure 201: East Asia Market Y-o-Y Growth (%) Projections by Component Type, 2024 to 2034

Figure 202: East Asia Market Value (US$ Million) Analysis by End User, 2019 to 2034

Figure 203: East Asia Market Volume (Units) Analysis by End User, 2019 to 2034

Figure 204: East Asia Market Value Share (%) and BPS Analysis by End User, 2024 to 2034

Figure 205: East Asia Market Y-o-Y Growth (%) Projections by End User, 2024 to 2034

Figure 206: East Asia Market Attractiveness by Material Type, 2024 to 2034

Figure 207: East Asia Market Attractiveness by Product Type, 2024 to 2034

Figure 208: East Asia Market Attractiveness by Component Type, 2024 to 2034

Figure 209: East Asia Market Attractiveness by End User, 2024 to 2034

Figure 210: East Asia Market Attractiveness by Country, 2024 to 2034

Figure 211: Middle East and Africa Market Value (US$ Million) by Material Type, 2024 to 2034

Figure 212: Middle East and Africa Market Value (US$ Million) by Product Type, 2024 to 2034

Figure 213: Middle East and Africa Market Value (US$ Million) by Component Type, 2024 to 2034

Figure 214: Middle East and Africa Market Value (US$ Million) by End User, 2024 to 2034

Figure 215: Middle East and Africa Market Value (US$ Million) by Country, 2024 to 2034

Figure 216: Middle East and Africa Market Value (US$ Million) Analysis by Country, 2019 to 2034

Figure 217: Middle East and Africa Market Volume (Units) Analysis by Country, 2019 to 2034

Figure 218: Middle East and Africa Market Value Share (%) and BPS Analysis by Country, 2024 to 2034

Figure 219: Middle East and Africa Market Y-o-Y Growth (%) Projections by Country, 2024 to 2034

Figure 220: Middle East and Africa Market Value (US$ Million) Analysis by Material Type, 2019 to 2034

Figure 221: Middle East and Africa Market Volume (Units) Analysis by Material Type, 2019 to 2034

Figure 222: Middle East and Africa Market Value Share (%) and BPS Analysis by Material Type, 2024 to 2034

Figure 223: Middle East and Africa Market Y-o-Y Growth (%) Projections by Material Type, 2024 to 2034

Figure 224: Middle East and Africa Market Value (US$ Million) Analysis by Product Type, 2019 to 2034

Figure 225: Middle East and Africa Market Volume (Units) Analysis by Product Type, 2019 to 2034

Figure 226: Middle East and Africa Market Value Share (%) and BPS Analysis by Product Type, 2024 to 2034

Figure 227: Middle East and Africa Market Y-o-Y Growth (%) Projections by Product Type, 2024 to 2034

Figure 228: Middle East and Africa Market Value (US$ Million) Analysis by Component Type, 2019 to 2034

Figure 229: Middle East and Africa Market Volume (Units) Analysis by Component Type, 2019 to 2034

Figure 230: Middle East and Africa Market Value Share (%) and BPS Analysis by Component Type, 2024 to 2034

Figure 231: Middle East and Africa Market Y-o-Y Growth (%) Projections by Component Type, 2024 to 2034

Figure 232: Middle East and Africa Market Value (US$ Million) Analysis by End User, 2019 to 2034

Figure 233: Middle East and Africa Market Volume (Units) Analysis by End User, 2019 to 2034

Figure 234: Middle East and Africa Market Value Share (%) and BPS Analysis by End User, 2024 to 2034

Figure 235: Middle East and Africa Market Y-o-Y Growth (%) Projections by End User, 2024 to 2034

Figure 236: Middle East and Africa Market Attractiveness by Material Type, 2024 to 2034

Figure 237: Middle East and Africa Market Attractiveness by Product Type, 2024 to 2034

Figure 238: Middle East and Africa Market Attractiveness by Component Type, 2024 to 2034

Figure 239: Middle East and Africa Market Attractiveness by End User, 2024 to 2034

Figure 240: Middle East and Africa Market Attractiveness by Country, 2024 to 2034

Frequently Asked Questions

What is the projected growth of the industrial hose assembly market?

The global industrial hose assembly market is expected to grow from USD 23.8 billion in 2025 to USD 40.9 billion by 2035, registering a CAGR of 5.6%.

Which material type dominates the industrial hose assembly market?

Rubber hoses dominate the market with a 57.4% share in 2025 due to their flexibility, durability, and wide applicability.

What is the leading product type in the industrial hose assembly market?

Medium-pressure hoses lead the product segment with a 55% share in 2025, favored for their balance of cost and performance.

Which region is expected to see the highest growth in the industrial hose assembly market?

The Asia-Pacific region, particularly China and India, is expected to experience the highest growth through 2035 due to infrastructure expansion and industrialization.

Who are the key players in the industrial hose assembly market?

Top companies include Gates Corporation, Parker Hannifin, and Continental AG, which focus on innovation, strategic acquisitions, and global expansion to maintain market leadership.

Explore Similar Insights

Future Market Insights

Industrial Hose Assembly Market