The Industrial Machine Vision Market is estimated to be valued at USD 10.3 billion in 2025 and is projected to reach USD 20.1 billion by 2035, registering a compound annual growth rate (CAGR) of 6.9% over the forecast period.
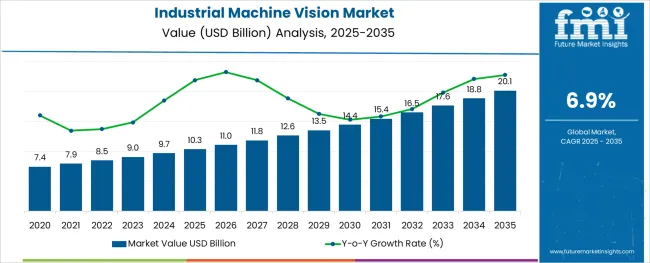
The industrial machine vision market is undergoing accelerated transformation, supported by increasing automation in manufacturing, rising adoption of AI-integrated vision systems, and demand for real-time defect detection. Industry 4.0 initiatives across major economies are influencing investment in intelligent imaging systems to drive operational efficiency and product consistency.
Advancements in high-speed sensors, embedded vision technologies, and edge computing have enabled machine vision to scale across diverse sectors including automotive, electronics, packaging, and pharmaceuticals. Regulatory focus on quality compliance and data-driven traceability is encouraging enterprises to adopt vision solutions that minimize human error and downtime.
Looking ahead, integration of 3D vision, hyperspectral imaging, and cloud-connected analysis is expected to define the next stage of growth in the machine vision ecosystem.
The market is segmented by Component, Product, Application, and End-User and region. By Component, the market is divided into Hardware and Software. In terms of Product, the market is classified into Smart Camera-based and PC-based. Based on Application, the market is segmented into Quality Assurance and Inspection, Measurement, Identification, Positioning and Guidance, and Others.
By End-User, the market is divided into Electronics & Semiconductor, Automotive, Pharmaceutical & Healthcare, Food and Beverage, Packaging, Process Control, Printing & Labeling, and Others. Regionally, the market is classified into North America, Latin America, Western Europe, Eastern Europe, Balkan & Baltic Countries, Russia & Belarus, Central Asia, East Asia, South Asia & Pacific, and the Middle East & Africa.
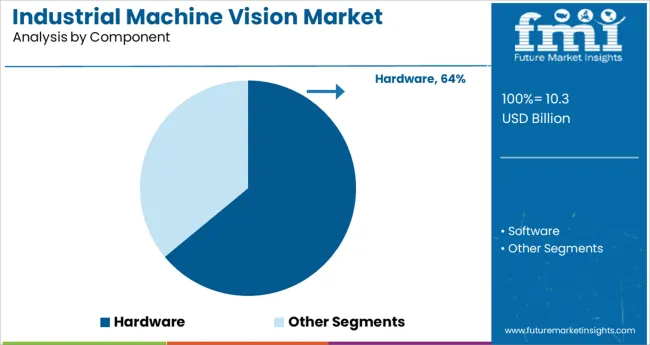
The hardware segment is expected to hold 64.0% of the total revenue share in the industrial machine vision market by 2025, establishing itself as the leading component category. This leadership is driven by increased deployment of high-resolution cameras, sensors, processors, and frame grabbers that form the core of machine vision systems.
As industries demand faster inspection speeds and greater image precision, investment in robust, durable hardware has become central to achieving performance goals. The widespread compatibility of hardware components with both legacy and advanced software platforms has reinforced their importance in plant modernization efforts.
Additionally, the growing trend of miniaturization and ruggedization is enabling machine vision hardware to be applied across harsher industrial environments, ensuring continued dominance of this segment.
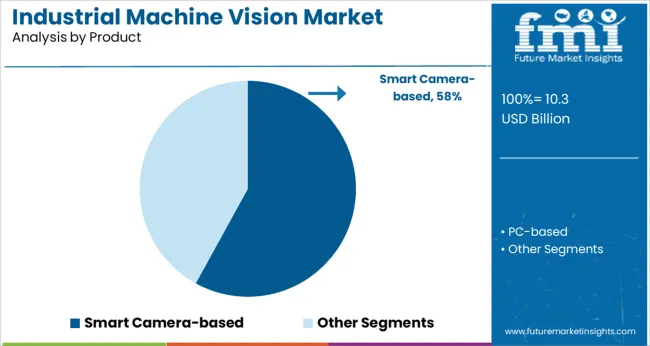
Smart camera-based systems are projected to account for 58.0% of the total market revenue in 2025, positioning them as the top product segment. Their market strength stems from their all-in-one architecture, combining image acquisition, processing, and communication in a compact unit.
These systems reduce the need for external computing, simplifying installation and lowering total system cost. Ease of integration into production lines and compatibility with AI-based software tools have driven adoption across both SMEs and large enterprises.
The ability to perform real-time analysis directly on-device has supported applications in fast-paced manufacturing environments, especially where space and speed are critical. As industries continue to shift toward decentralized, flexible automation systems, smart camera-based solutions are expected to lead adoption trends.
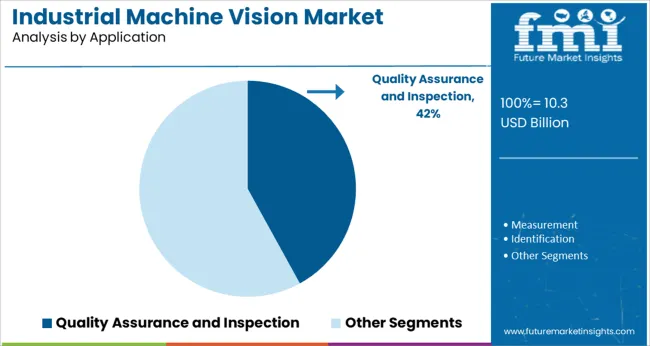
Quality assurance and inspection is anticipated to dominate the market with a 42.0% share of total revenue in 2025, making it the leading application segment. This is being influenced by stricter quality compliance standards, increasing demand for zero-defect manufacturing, and the need for continuous process monitoring.
Vision systems are being deployed to inspect dimensions, surface defects, label accuracy, and assembly validation in real time functions that are critical to maintaining brand reputation and minimizing costly recalls. The rise of closed-loop control systems, where machine vision directly informs process adjustments, has further elevated the role of inspection systems in high-speed production lines.
With AI-powered classification and pattern recognition becoming more reliable, the role of machine vision in quality management is expected to deepen, especially in sectors such as electronics, pharmaceuticals, and automotive manufacturing.
For businesses offering machine vision solutions, North America is a big market. Since factory automation was used early and there are many market vendors with local roots, the regional market is anticipated to expand significantly throughout the forecast period.
Additional and varied inventions are being discovered on the market. For instance, the Canadian company iENSO introduced their Ambarella-based platform ecosystem for embedded vision applications in May 2024. AI vision processors for the Edge are offered by Ambarella Inc.
Considering that North America has a competitive advantage over other regions in the industrial machine vision market, the USA is expected to exhibit the strongest growth. This is because the nation is home to several foreign players. Additionally, the USA is a pioneer in R&D projects for the creation of effective engineering procedures.
The Smart Embedded Vision Initiative was also unveiled by Microchip Technology Corporation. Accelerating machine vision development for use in industrial, medical devices, automotive, and aerospace applications is the goal of this effort. Throughout the forecast period, it is anticipated that such advancements by hardware and software providers would increase industrial machine vision market demand.
Nowadays, the application of industrial robots is growing for automation in the automotive and electronic sectors. For example, the 2024 Industrial Robots report from New World Robotics estimated that there are about 2.7 million industrial robots in use in factories worldwide.
Among the major sectors for the implementation of robots are the automotive and consumer electronics industries. In the automotive business, there are approximately 1287 robots for every 10,000 workers, according to data for the robotics industry for 2024.
A growing trend in recent years has been vision-guided robots. It has caused the machine vision system in robots to be used more frequently, especially in the automotive sector. Improved accuracy, comprehension, and direction are provided by the integration of robots with the machine vision system. Consequently, the global machine vision market is expanding due to the increasing deployment of industrial robots.
Automation is being implemented by manufacturing companies to enhance daily operations amid the pandemic, when human interaction was scarce, machine vision aided in maintaining industrial flow. Since it adds product safety to the present digital infrastructure, the pharmaceutical sector was one of the first to adopt this technology.
Manufacturers can reach new milestones in producing goods with minimal defects because of machine vision systems' high processing speed. The increased production of hybrid and electric vehicles is also anticipated to offer significant chances for the industrial machine vision market to expand over the forecast period.
The industrial machine vision system is a system that works by generating images through a camera that are automatically analysed by software. Industrial machine vision systems perform quality tests, control processes, guide machines, read codes, identify components, and deliver valuable data for optimizing production.
The increasing demand for quality inspection and automation in different industrial verticals, the need for vision-guided robotic systems across the automotive, food and beverage, pharmaceutical and chemical, and packaging segments are the major factors that are expected to augment the growth of the Industrial Machine Vision Market over the analysis period.
Other major factors like the surge in demand for application-oriented machine vision systems are likely to boost the market growth during the forecast period.
On the flip side, the complex integration of industrial machine vision systems is further projected to impede the growth of the rib fracture treatment market in the timeline period.
One of the major factors that is anticipated to propel the growth of the Industrial Machine Vision market during the forecast period includes the fast and accurate processing of data by the system. The efficiency of industrial machine vision systems is increasing as manufacturers are investing in research and development.
Speed and accuracy parameters of industrial machine vision systems are getting better with new innovations in the market. This in turn is expected to increase the demand for industrial machine vision systems in the forthcoming years.
Other drivers for the industrial machine vision market include the advent of vision-guided robotic systems in the industrial sector as industries all round the world are adopting robotic systems for manufacturing. Robotic systems require the deployment of industrial machine vision systems.
The increasing automation, and intensifying need for superior inspection are other major factors paving the way for the notable adoption of machine vision technology. Furthermore, the need for increased quality control by consumers and manufacturers, coupled with government regulations to abide by the prescribed specifications, is expected to catapult the adoption of machine vision technology.
The growing risk of cyber-attacks on industrial machine robots and devices and the dearth of flexible machine vision solutions are the major factors that are anticipated to hinder the growth of the industrial machine vision market during the forecast period. In addition, the difficulties regarding the incorporation of machine vision systems might further challenge the growth of the industrial machine vision market in the near future.
Moreover, the lack of efficient system operators due to inadequate training is a restraining factor that is likely to obstruct the smooth growth of the market. Another major factor that is expected to impede the market growth includes the complex integration of industrial machine vision systems.
The integration of industrial machine vision systems has been on a complex and expensive side and is thus restraining the market for industrial machine vision systems.
Also, lack of awareness about these industrial machine vision systems globally, is also the reason for the slow growth of the industrial machine vision market over the analysis period.
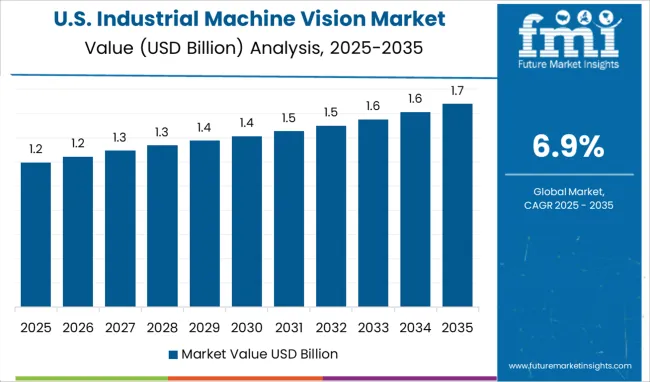
The Industrial Machine Vision market in North America is expected to hold the largest share of USD 14.8 Billion. Considering the revenue generation, the regional market is expected to reach at a CAGR of 6.3% during the forecast period.
The industrial machine vision market in North America is expected to be growing at the fastest rate due to an increase in the number of end-use industries enabled with industrial machine vision in the region.
In addition, as most of the industrial machine vision manufacturers are set up in North America, the industrial machine vision market in the region is expected to gain traction in the forthcoming years. The reason for sustained traction in the regions is attributed to the fact that the region is technologically advanced.
The Asia-Pacific Industrial Machine Vision market is expected to reach at a CAGR of 6.1% with a market value of USD 11.5 Billion.
Asia Pacific holds a significant revenue share of the industrial machine vision market. The region is likely to grow during the forecast period, accredited to the lucrative opportunities in automotive, packaging, pharmaceutical, and other industrial applications in the Asia Pacific region.
As the region is establishing itself to become a global manufacturing hub, the technology is anticipated to gain significant traction over the forecast period. China and Japan are prominent countries having the potential to offer extensive opportunities for emerging as well as matured technologies such as machine vision. The numerous manufacturing industries are contributing to the growth and prosperity of the regional economic growth.
Moreover, the expenditure and operational benefits, coupled with the initiatives being undertaken by the governments of emerging countries, such as South Korea, India, Taiwan, and Singapore, are responsible for catapulting investments and encouraging different industry players to establish their production units in the Asia Pacific region
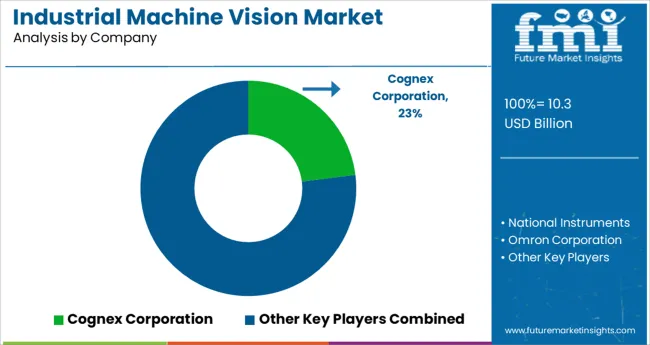
Some of the key participants present in the global Industrial Machine Vision market include National Instruments, Cognex Corporation, Microscan Systems, Allied Vision Technologies GmbH, Basler AG, Machine Vision Technology, Keyence Corporation, Cognex, Omron Corporation, Sony Corporation, Teledyne Technologies, Texas Instruments, Baumer Optronic, tordivel, MVTec Software, SICK, and ISRA VISION among others.
Attributed to the presence of such a high number of participants, the market is highly competitive. While global players such as National Instruments, Cognex Corporation, Microscan Systems, Allied Vision Technologies GmbH, Basler AG, and Machine Vision Technology, account for a considerable market size, several regional level players are also operating across key growth regions, particularly in North America.
Recent Development:
In March 2024, Cognex had released the DataMan 8700 Series, which is the next generation of handheld barcode scanners that is built on a completely new platform. The device provides cutting-edge performance and is extremely simple to operate, requiring no prior tweaking or operator training.
| Report Attribute | Details |
|---|---|
| Growth Rate | CAGR of 6.9% from 2025 to 2035 |
| Base Year for Estimation | 2024 |
| Historical Data | 2020 to 2024 |
| Forecast Period | 2025 to 2035 |
| Quantitative Units | Revenue in million and CAGR from 2025 to 2035 |
| Report Coverage | Revenue Forecast, Volume Forecast, Company Ranking, Competitive Landscape, Growth Factors, Trends and Pricing Analysis |
| Segments Covered | Component, Product, Application, End-User, Region |
| Regional Scope | North America, Latin America, Western Europe, Eastern Europe, Asia Pacific, China, Japan, Middle East and Africa |
| Country Scope | USA, Canada, Mexico, Brazil, UK, Germany, France, Spain, Italy, Poland, Russia, China, India, ASEAN, Australia, New Zealand, GCC, South Africa, North Africa |
| Key Companies Profiled | National Instruments; Cognex Corporation; Microscan Systems; Allied Vision Technologies GmbH; Basler AG; Machine Vision Technology; Keyence Corporation; Cognex; Omron Corporation; Sony Corporation; Teledyne Technologies; Texas Instruments; Baumer Optronic; tordivel; MVTec Software; SICK; and ISRA VISION among others |
| Customization Scope | Free report customization (equivalent to up to 8 analysts working days) with purchase. Addition or alteration to country, regional & segment scope. |
| Pricing and purchase options | Avail customized purchase options to meet your exact research needs. |
The global industrial machine vision market is estimated to be valued at USD 10.3 billion in 2025.
It is projected to reach USD 20.1 billion by 2035.
The market is expected to grow at a 6.9% CAGR between 2025 and 2035.
The key product types are hardware and software.
smart camera-based segment is expected to dominate with a 58.0% industry share in 2025.


Full Research Suite comprises of:
Market outlook & trends analysis
Interviews & case studies
Strategic recommendations
Vendor profiles & capabilities analysis
5-year forecasts
8 regions and 60+ country-level data splits
Market segment data splits
12 months of continuous data updates
DELIVERED AS:
PDF EXCEL ONLINE
Industrial Precision Oven Market Size and Share Forecast Outlook 2025 to 2035
Industrial Water Chiller for PCB Market Size and Share Forecast Outlook 2025 to 2035
Industrial & Commercial HVLS Fans Market Size and Share Forecast Outlook 2025 to 2035
Industrial Robot Controller Market Size and Share Forecast Outlook 2025 to 2035
Industrial Wired Routers Market Size and Share Forecast Outlook 2025 to 2035
Industrial Evaporative Condensers Market Size and Share Forecast Outlook 2025 to 2035
Industrial Energy Management System Market Size and Share Forecast Outlook 2025 to 2035
Industrial Insulation Market Size and Share Forecast Outlook 2025 to 2035
Industrial Safety Gloves Market Size and Share Forecast Outlook 2025 to 2035
Industrial Cleaner Market Size and Share Forecast Outlook 2025 to 2035
Industrial Dust Treatment System Market Size and Share Forecast Outlook 2025 to 2035
Industrial Vertical Washing Tower Market Size and Share Forecast Outlook 2025 to 2035
Industrial Pepper Market Size and Share Forecast Outlook 2025 to 2035
Industrial Electronics Packaging Market Forecast and Outlook 2025 to 2035
Industrial Absorbent Market Forecast and Outlook 2025 to 2035
Industrial Furnace Industry Analysis in Europe Forecast and Outlook 2025 to 2035
Industrial Denox System Market Size and Share Forecast Outlook 2025 to 2035
Industrial Electronic Pressure Switch Market Size and Share Forecast Outlook 2025 to 2035
Industrial WiFi Module Market Size and Share Forecast Outlook 2025 to 2035
Industrial Security System Market Forecast Outlook 2025 to 2035

Thank you!
You will receive an email from our Business Development Manager. Please be sure to check your SPAM/JUNK folder too.
Chat With
MaRIA