Industrial Mixer Market Outlook (2022 to 2032)

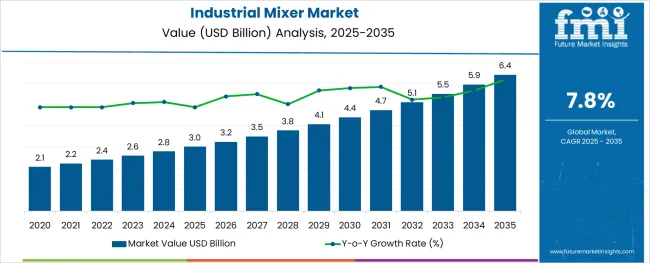
[350 Pages Report] The global industrial mixer market is poised to expand at a CAGR of 7.8% during the forecast period (2022 to 2032). Industrial mixer sales are expected to increase from US$ 2.4 Billion in 2022 to US$ 5.1 Billion by 2032. Demand for industrial mixers increased to US$ 2.255 Billion at the end of 2021 and is anticipated to exhibit Y-o-Y growth of 6.3% in 2022.

Attributes Details
Industrial Mixer Market Size Value in 2022 US$ 2.4 Billion
Industrial Mixer Market Forecast Value in 2032 US$ 5.1 Billion
Global Industrial Mixer Market Growth Rate (2022 to 2032) 7.8% CAGR
Industrial Mixer Market Forecast Period 2021 to 2031
Market Share of India in South Asia 28%

Industrial mixers are used to mix materials from either the same state of materials or a different one. The main difference is size and speed with respect to normal mixers. Material mixing is aided by industrial high-shear mixers. As a result, they cut mixing and processing time in half when compared to typical agitators and mixers like propellers and turbines.

For several reasons, the industrial mixer is employed in a range of industries. These mixers feature a big tank or container that holds all of the material and blades that mix it. These mixers are utilized in large-scale manufacturing enterprises as they can process a high scale of materials.

Don't pay for what you don't need

Customize your report by selecting specific countries or regions and save 30%!

2017 to 2021 Industrial Mixer Market Analysis Compared to 2022 to 2032 Forecast

According to Future Market Insights (FMI), industrial mixer sales increased with the burgeoning need for high-performance mixing devices to improve production performance. Surging demand for energy-efficient devices, growing focus on flow maximization, and equipment adaptability are considered to be the key industrial mixer market trends.

Furthermore, as they are cost-effective and with rapid developments in design technology, the demand for industrial mixers is expected to surge. Also, with increased government backing for sophisticated technology, small and medium-sized firms are extensively using industrial mixers.

Industrial Mixer Market

Subsequently, the advent of automation in industries to minimize mistake rates and offer consistent quality is likely to boost demand for programmable logic controller-based mixers over the forecast period. According to FMI, the overall industrial mixer sales are expected to expand by 2.1x between 2022 and 2032.

Key Industrial Mixers Market Trends: Application in Food & Beverage Sector to Boost the Market

Industrial mixer manufacturers are expected to witness lucrative growth prospects on the back of rising applications in the food and beverage industry. This is due to the rising demand for packaged foods across the globe.

Rising preference for ready-to-eat food goods such as dairy and pastry products, especially in China and India will boost the industrial mixer market. Furthermore, with rapid urbanization, the demand for packaged food goods will propel the sales of industrial high-shear mixers.

In the chemical and pharmaceutical industries, these mixers are used to mix a variety of items such as hazardous chemicals, viscous fluids, and other materials. These mixers are being adopted at an alarming pace to minimize health issues and enhance production rates.

Hence, demand for vertical mixers and horizontal industrial mixers will accelerate industrial mixer sales over the forecast period. On account of this, the sales of vertical and horizontal industrial mixers will gain traction at a robust pace between 2022 and 2032.

Nandini Roy Choudhury

Principal Consultant

Talk to Analyst

Find your sweet spots for generating winning opportunities in this market.

What is the Impact of COVID-19 on the Industrial Mixer Market?

Due to Covid-19, demand for industrial mixers decreased as manufacturing was halted in several nations due to government-imposed lockdowns and social isolation. However, with the resumption of businesses, the industrial mixer market is poised to gain traction over the forthcoming decade.

Also, with growing health consciousness, industrial mixer sales are expected to rise in the food and beverage industry, chemical industry, and pharmaceutical industry. Hence, according to the study, top players for industrial mixers are developing mixers that use less energy and have smart mixing capabilities, as well as programmable logic controllers (PLCs).

Country-wise Insights

Why is China Considered to be a Leading Industrial Mixer Market?

China Industrial Mixer Market to Witness Robust Growth Amid Rising Application in Pharmaceutical Industry

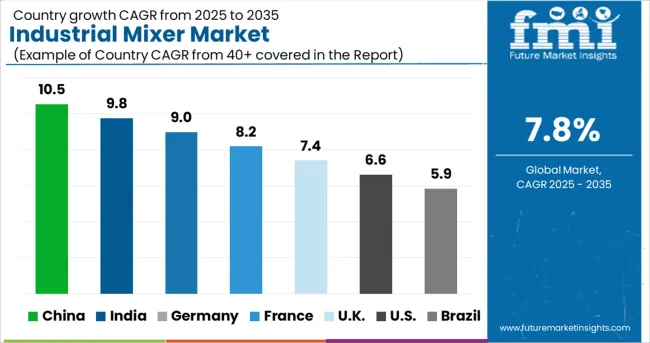
According to FMI, China is expected to emerge as the most lucrative industrial mixer market over the forecast period. Industrial mixer sales in China are expected to increase amid growing applications in the chemical industry and pharmaceutical industries.

As China's chemical industry and pharmaceutical industries are considered to be the world's largest, the sales in China's industrial mixer market will surge at a rapid pace through 2022 & beyond.

How Big Is the Opportunity in the USA Industrial Mixer Market?

Industrial Mixer Sales to Gain Tailwinds as Application in Food and Beverage Industry Rises

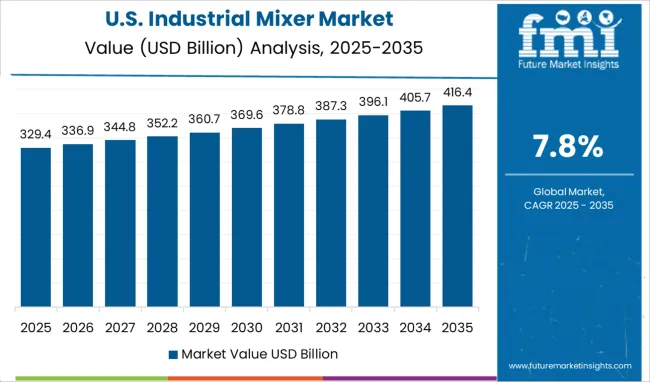
As per the study, demand for industrial mixer in the food and beverage industry is increasing steadily in the USA Industrial mixer sales are surging with growing applications in the meat processing business. Hence, with the growing consumption of meat-based food products in the USA, the industrial mixer market will witness steady growth in the USA

What is the Demand Outlook for Industrial Mixer Market in Germany?

Industrial Mixer Manufacturers to Capitalize on Rising Demand for Eco-Friendly Mixers in Chemical Industry

Industrial mixer manufacturers are concentrating on new technology to make these mixers function quicker and use less energy. For the chemical industry and pharmaceutical industries, manufacturers are investing in making these mixers even more sanitary.

For an environmentally responsible product, several manufacturers are developing these mixers with recyclable metal. A slew of such product launches and development will create remunerative growth opportunities in Germany industrial mixer market.

Get the data you need at a Fraction of the cost

Personalize your report by choosing insights you need
and save 40%!

Category-wise Insights

Which is the Leading Distribution Channel in Industrial Mixer Market?

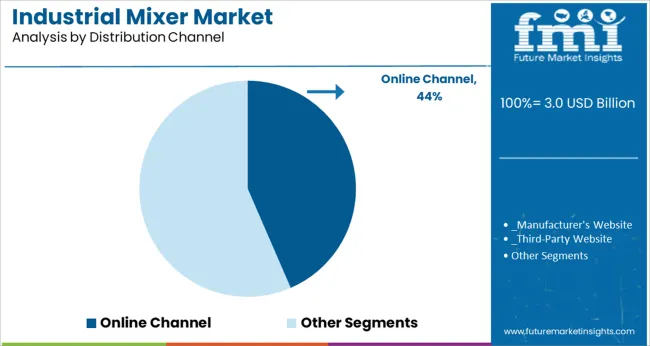
Online Channel Segment to Account for Significant Share in Industrial Mixer Market

During the assessment period, the offline retail segment is expected to witness significant growth in the industrial mixer market. However, with ease in convenience and availability of a variety of products, industrial mixer sales are expected to surge through online channels as well.

Which Industrial Mixer Will Remain Highly Sought After?

Demand for Vacuum Industrial Mixers to Outpace the Vertical Industrial Mixer Sales

Based on product type, the industrial mixer market is sub-segmented into vertical mixer, horizontal mixer, jacketed mixer, vacuum mixer, continuous mixer, and others. According to FMI, vertical industrial mixer sales are expected to increase at a considerable pace.

However, demand for vacuum industrial mixers is projected to rise over the forecast period.

Why is Demand for Industrial Mixers Rising in Food and Beverage Industry?

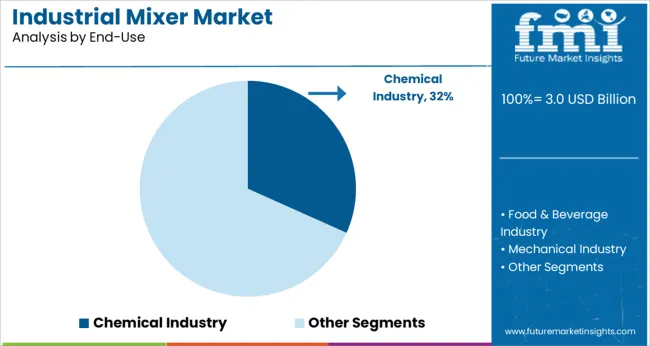
In terms of end-use, the industrial mixer market is segmented into the chemical industry, food & beverage industry, mechanical industry, pharmaceutical industry, water & wastewater industry, and others.

As per the study, maximum industrial mixer sales are expected to be contributed by the food and beverage industry during the forecast period.
Competitive Landscape

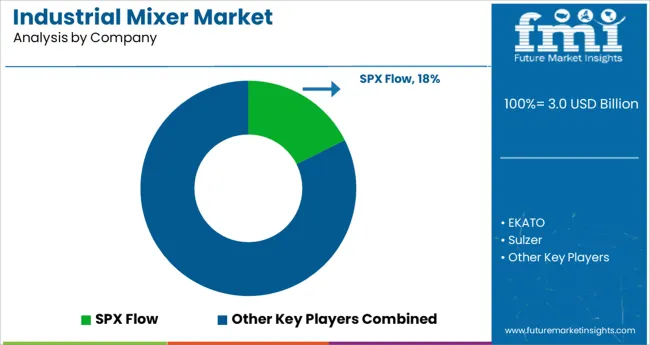
Top players in the industrial market are pursuing a variety of methods, including mergers and acquisitions to gain a competitive edge. Furthermore, numerous firms are working focusing on product launches and development to expand their capacity and strengthen their foothold in the industrial mixer market.

  • In March 2019, Alfa Laval launched its next-generation magnetic mixers, which are designed to mix down to the last drop in food, beverage, and dairy applications. The LeviMag, which is designed for aseptic processing, is ideal for mixing liquid-based goods like juices in aseptic filling lines.

Scope of the Report

Attributes Details
Forecast Period 2022 to 2032
Historical Data Available for 2017 to 2022
Market Analysis US$ Billion for Value and Units for Volume
Key Regions Covered North America; Latin America; Europe; Asia Pacific; Oceania; and MEA
Key Countries Covered USA, Canada, Mexico, Germany, UK, France, Italy, Spain, China, Japan, India, South Korea, Australia, Brazil, Argentina, South Africa, and UAE
Key Segments Covered Type, Material to be mixed of industrial mixers, End Line Use, Distribution Channel and Region
Key Companies Profiled SPX Flow; EKATO; Sulzer; Xylem; National Oilwell Varco; ALFA LAVAL; Dover; Shenyin; Philadelphia; Zhejiang Great Wall Mixers; Others
Report Coverage Market Forecast, Company Share Analysis, Competition Intelligence, Drivers, Restraints, Opportunities and Threats Analysis, Market Dynamics and Challenges, and Strategic Growth Initiatives
Customization & Pricing Available upon Request

Industrial Mixer Market by Category

By Product Type:

  • Vertical Mixer
  • Horizontal Mixer
  • Jacketed Mixer
  • Vacuum Mixer
  • Continuous Mixer
  • Others

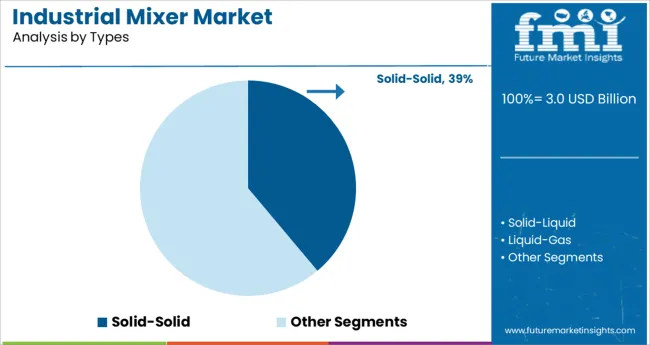
By Type:

  • Solid-Solid
  • Solid-Liquid
  • Liquid-Gas
  • Liquid-Liquid

By End Use:

  • Chemical Industry
  • Food & Beverage Industry
  • Mechanical Industry
  • Pharmaceutical Industry
  • Water & Wastewater Industry
  • Others

By Region:

  • North America
  • Latin America
  • Europe
  • Asia Pacific
  • Oceania
  • Middle East and Africa (MEA)

Frequently Asked Questions

How big is the industrial mixer market?

The industrial mixer market is expected to rise at a CAGR of 7.8% between 2022 and 2032.

What is the North America industrial mixer market outlook?

North America industrial mixer market is expected to register a 10.6% CAGR between 2022 and 2032.

At what rate will demand for industrial mixers grow in Europe?

Demand for industrial mixers in Europe is expected to grow at 6.7% CAGR between 2022 and 2032.

What was the industrial market analysis for the past five years?

In terms of revenue, industrial mixer market grew at a CAGR of around 6.3% from 2017 to 2021

Who are the top players for industrial mixers operating in the market?

Xylem, Sulzer, ALFA LAVAL, SPX Flow, National Oilwell Varco are expected to be the top 5 players driving the industrial mixer market.

Which are the major countries driving demand for global industrial mixer market?

China, USA are the major countries driving demand for global industrial mixer market.

At what rate will the USA industrial mixer market grow?

The USA industrial mixer market is projected to expand at a CAGR of around 10.9% over the next ten years.

Table of Content
1. Executive Summary | Industrial Mixer Market
    1.1. Global Market Outlook
    1.2. Demand-side Trends
    1.3. Supply-side Trends
    1.4. Technology Roadmap Analysis
    1.5. Analysis and Recommendations
2. Market Overview
    2.1. Market Coverage / Taxonomy
    2.2. Market Definition / Scope / Limitations
3. Market Background
    3.1. Market Dynamics
        3.1.1. Drivers
        3.1.2. Restraints
        3.1.3. Opportunity
        3.1.4. Trends
    3.2. Scenario Forecast
        3.2.1. Demand in Optimistic Scenario
        3.2.2. Demand in Likely Scenario
        3.2.3. Demand in Conservative Scenario
    3.3. Opportunity Map Analysis
    3.4. Product Life Cycle Analysis
    3.5. Supply Chain Analysis
        3.5.1. Supply Side Participants and Their Roles
            3.5.1.1. Producers
            3.5.1.2. Mid-Level Participants (Traders/ Agents/ Brokers)
            3.5.1.3. Wholesalers and Distributors
        3.5.2. Value Added and Value Created at Node in the Supply Chain
        3.5.3. List of Raw Material Suppliers
        3.5.4. List of Existing and Potential Buyers
    3.6. - Pricing Analysis
        3.6.1. Price Point Assessment by Region
        3.6.2. Price Point Assessment by Product Type
        3.6.3. Price Forecast till 2032
        3.6.4. Factors Affecting Pricing
    3.7. Value Chain Analysis
        3.7.1. Profit Margin Analysis
        3.7.2. Wholesalers and Distributors
        3.7.3. Retailers
    3.8. PESTLE and Porter’s Analysis
    3.9. Regulatory Landscape
        3.9.1. By Key Regions
        3.9.2. By Key Countries
    3.10. Import and Export Statistics
4. Global Analysis 2017 to 2021 and Forecast, 2022 to 2032
    4.1. Historical Market Size Value (US$ Million) & Volume (Units) Analysis, 2017 to 2021
    4.2. Current and Future Market Size Value (US$ Million) & Volume (Units) Projections, 2022 to 2032
        4.2.1. Y-o-Y Growth Trend Analysis
        4.2.2. Absolute $ Opportunity Analysis
5. Global Analysis 2017 to 2021 and Forecast 2022 to 2032, By Product Type
    5.1. Introduction / Key Findings
    5.2. Historical Market Size Value (US$ Million) & Volume (Units) Analysis By Product Type, 2017 to 2021
    5.3. Current and Future Market Size Value (US$ Million) & Volume (Units) Analysis and Forecast By Product Type, 2022 to 2032
        5.3.1. Vertical Mixer
        5.3.2. Horizontal Mixer
        5.3.3. Jacketed Mixer
        5.3.4. Vacuum Mixer
        5.3.5. Continuous Mixer
        5.3.6. Others
    5.4. Y-o-Y Growth Trend Analysis By Product Type, 2017 to 2021
    5.5. Absolute $ Opportunity Analysis By Product Type, 2022 to 2032
6. Global Analysis 2017 to 2021 and Forecast 2022 to 2032, By Types
    6.1. Introduction / Key Findings
    6.2. Historical Market Size Value (US$ Million) & Volume (Units) Analysis By Types, 2017 to 2021
    6.3. Current and Future Market Size Value (US$ Million) & Volume (Units) Analysis and Forecast By Types, 2022 to 2032
        6.3.1. Solid-Solid
        6.3.2. Solid-Liquid
        6.3.3. Liquid-Gas
        6.3.4. Liquid-Liquid
    6.4. Y-o-Y Growth Trend Analysis By Types, 2017 to 2021
    6.5. Absolute $ Opportunity Analysis By Types, 2022 to 2032
7. Global Analysis 2017 to 2021 and Forecast 2022 to 2032, By End-Use
    7.1. Introduction / Key Findings
    7.2. Historical Market Size Value (US$ Million) & Volume (Units) Analysis By End-Use, 2017 to 2021
    7.3. Current and Future Market Size Value (US$ Million) & Volume (Units) Analysis and Forecast By End-Use, 2022 to 2032
        7.3.1. Chemical Industry
        7.3.2. Food & Beverage Industry
        7.3.3. Mechanical Industry
        7.3.4. Pharmaceutical Industry
        7.3.5. Water & Wastewater Industry
        7.3.6. Others
    7.4. Y-o-Y Growth Trend Analysis By End-Use, 2017 to 2021
    7.5. Absolute $ Opportunity Analysis By End-Use, 2022 to 2032
8. Global Analysis 2017 to 2021 and Forecast 2022 to 2032, By Distribution Channel
    8.1. Introduction / Key Findings
    8.2. Historical Market Size Value (US$ Million) & Volume (Units) Analysis By Distribution Channel, 2017 to 2021
    8.3. Current and Future Market Size Value (US$ Million) & Volume (Units) Analysis and Forecast By Distribution Channel, 2022 to 2032
        8.3.1. Online Channel
            8.3.1.1. Manufacturers website
            8.3.1.2. Third-Party Website
        8.3.2. Offline Channel
            8.3.2.1. Department Store
            8.3.2.2. Specialty Store
            8.3.2.3. Others
    8.4. Y-o-Y Growth Trend Analysis By Distribution Channel, 2017 to 2021
    8.5. Absolute $ Opportunity Analysis By Distribution Channel, 2022 to 2032
9. Global Analysis 2017 to 2021 and Forecast 2022 to 2032, By Region
    9.1. Introduction
    9.2. Historical Market Size Value (US$ Million) & Volume (Units) Analysis By Region, 2017 to 2021
    9.3. Current Market Size Value (US$ Million) & Volume (Units) Analysis and Forecast By Region, 2022 to 2032
        9.3.1. North America
        9.3.2. Latin America
        9.3.3. Europe
        9.3.4. East Asia
        9.3.5. South Asia
        9.3.6. Oceania
        9.3.7. Middle East and Africa (MEA)
    9.4. Market Attractiveness Analysis By Region
10. North America Analysis 2017 to 2021 and Forecast 2022 to 2032, By Country
    10.1. Historical Market Size Value (US$ Million) & Volume (Units) Trend Analysis By Market Taxonomy, 2017 to 2021
    10.2. Market Size Value (US$ Million) & Volume (Units) Forecast By Market Taxonomy, 2022 to 2032
        10.2.1. By Country
            10.2.1.1. United States of America
            10.2.1.2. Canada
        10.2.2. By Product Type
        10.2.3. By Types
        10.2.4. By End-Use
        10.2.5. By Distribution Channel
    10.3. Market Attractiveness Analysis
        10.3.1. By Country
        10.3.2. By Product Type
        10.3.3. By Types
        10.3.4. By End-Use
        10.3.5. By Distribution Channel
    10.4. Key Takeaways
11. Latin America Analysis 2017 to 2021 and Forecast 2022 to 2032, By Country
    11.1. Historical Market Size Value (US$ Million) & Volume (Units) Trend Analysis By Market Taxonomy, 2017 to 2021
    11.2. Market Size Value (US$ Million) & Volume (Units) Forecast By Market Taxonomy, 2022 to 2032
        11.2.1. By Country
            11.2.1.1. Brazil
            11.2.1.2. Mexico
            11.2.1.3. Argentina
            11.2.1.4. Chile
            11.2.1.5. Peru
            11.2.1.6. Rest of Latin America
        11.2.2. By Product Type
        11.2.3. By Types
        11.2.4. By End-Use
        11.2.5. By Distribution Channel
    11.3. Market Attractiveness Analysis
        11.3.1. By Country
        11.3.2. By Product Type
        11.3.3. By Types
        11.3.4. By End-Use
        11.3.5. By Distribution Channel
    11.4. Key Takeaways
12. Europe Analysis 2017 to 2021 and Forecast 2022 to 2032, By Country
    12.1. Historical Market Size Value (US$ Million) & Volume (Units) Trend Analysis By Market Taxonomy, 2017 to 2021
    12.2. Market Size Value (US$ Million) & Volume (Units) Forecast By Market Taxonomy, 2022 to 2032
        12.2.1. By Country
            12.2.1.1. Germany
            12.2.1.2. Italy
            12.2.1.3. France
            12.2.1.4. United Kingdom
            12.2.1.5. Spain
            12.2.1.6. Russia
            12.2.1.7. BENELUX
            12.2.1.8. Rest of Europe
        12.2.2. By Product Type
        12.2.3. By Types
        12.2.4. By End-Use
        12.2.5. By Distribution Channel
    12.3. Market Attractiveness Analysis
        12.3.1. By Country
        12.3.2. By Product Type
        12.3.3. By Types
        12.3.4. By End-Use
        12.3.5. By Distribution Channel
    12.4. Key Takeaways
13. East Asia Analysis 2017 to 2021 and Forecast 2022 to 2032, By Country
    13.1. Historical Market Size Value (US$ Million) & Volume (Units) Trend Analysis By Market Taxonomy, 2017 to 2021
    13.2. Market Size Value (US$ Million) & Volume (Units) Forecast By Market Taxonomy, 2022 to 2032
        13.2.1. By Country
            13.2.1.1. China
            13.2.1.2. Japan
            13.2.1.3. South Korea
        13.2.2. By Product Type
        13.2.3. By Types
        13.2.4. By End-Use
        13.2.5. By Distribution Channel
    13.3. Market Attractiveness Analysis
        13.3.1. By Country
        13.3.2. By Product Type
        13.3.3. By Types
        13.3.4. By End-Use
        13.3.5. By Distribution Channel
    13.4. Key Takeaways
14. South Asia Analysis 2017 to 2021 and Forecast 2022 to 2032, By Country
    14.1. Historical Market Size Value (US$ Million) & Volume (Units) Trend Analysis By Market Taxonomy, 2017 to 2021
    14.2. Market Size Value (US$ Million) & Volume (Units) Forecast By Market Taxonomy, 2022 to 2032
        14.2.1. By Country
            14.2.1.1. India
            14.2.1.2. Thailand
            14.2.1.3. Malaysia
            14.2.1.4. Indonesia
            14.2.1.5. Rest of South Asia
        14.2.2. By Product Type
        14.2.3. By Types
        14.2.4. By End-Use
        14.2.5. By Distribution Channel
    14.3. Market Attractiveness Analysis
        14.3.1. By Country
        14.3.2. By Product Type
        14.3.3. By Types
        14.3.4. By End-Use
        14.3.5. By Distribution Channel
    14.4. Key Takeaways
15. Oceania Analysis 2017 to 2021 and Forecast 2022 to 2032, By Country
    15.1. Historical Market Size Value (US$ Million) & Volume (Units) Trend Analysis By Market Taxonomy, 2017 to 2021
    15.2. Market Size Value (US$ Million) & Volume (Units) Forecast By Market Taxonomy, 2022 to 2032
        15.2.1. By Country
            15.2.1.1. Australia
            15.2.1.2. New Zealand
        15.2.2. By Product Type
        15.2.3. By Types
        15.2.4. By End-Use
        15.2.5. By Distribution Channel
    15.3. Market Attractiveness Analysis
        15.3.1. By Country
        15.3.2. By Product Type
        15.3.3. By Types
        15.3.4. By End-Use
        15.3.5. By Distribution Channel
    15.4. Key Takeaways
16. MEA Analysis 2017 to 2021 and Forecast 2022 to 2032, By Country
    16.1. Historical Market Size Value (US$ Million) & Volume (Units) Trend Analysis By Market Taxonomy, 2017 to 2021
    16.2. Market Size Value (US$ Million) & Volume (Units) Forecast By Market Taxonomy, 2022 to 2032
        16.2.1. By Country
            16.2.1.1. GCC Countries
            16.2.1.2. Rest of MEA
        16.2.2. By Product Type
        16.2.3. By Types
        16.2.4. By End-Use
        16.2.5. By Distribution Channel
    16.3. Market Attractiveness Analysis
        16.3.1. By Country
        16.3.2. By Product Type
        16.3.3. By Types
        16.3.4. By End-Use
        16.3.5. By Distribution Channel
    16.4. Key Takeaways
17. Key Countries Analysis
    17.1. United States of America
        17.1.1. Pricing Analysis
        17.1.2. Market Share Analysis, 2022
            17.1.2.1. By Product Type
            17.1.2.2. By Types
            17.1.2.3. By End-Use
            17.1.2.4. By Distribution Channel
    17.2. Canada
        17.2.1. Pricing Analysis
        17.2.2. Market Share Analysis, 2022
            17.2.2.1. By Product Type
            17.2.2.2. By Types
            17.2.2.3. By End-Use
            17.2.2.4. By Distribution Channel
    17.3. Brazil
        17.3.1. Pricing Analysis
        17.3.2. Market Share Analysis, 2022
            17.3.2.1. By Product Type
            17.3.2.2. By Types
            17.3.2.3. By End-Use
            17.3.2.4. By Distribution Channel
    17.4. Mexico
        17.4.1. Pricing Analysis
        17.4.2. Market Share Analysis, 2022
            17.4.2.1. By Product Type
            17.4.2.2. By Types
            17.4.2.3. By End-Use
            17.4.2.4. By Distribution Channel
    17.5. Argentina
        17.5.1. Pricing Analysis
        17.5.2. Market Share Analysis, 2022
            17.5.2.1. By Product Type
            17.5.2.2. By Types
            17.5.2.3. By End-Use
            17.5.2.4. By Distribution Channel
    17.6. Chile
        17.6.1. Pricing Analysis
        17.6.2. Market Share Analysis, 2022
            17.6.2.1. By Product Type
            17.6.2.2. By Types
            17.6.2.3. By End-Use
            17.6.2.4. By Distribution Channel
    17.7. Peru
        17.7.1. Pricing Analysis
        17.7.2. Market Share Analysis, 2022
            17.7.2.1. By Product Type
            17.7.2.2. By Types
            17.7.2.3. By End-Use
            17.7.2.4. By Distribution Channel
    17.8. Rest of Latin America
        17.8.1. Pricing Analysis
        17.8.2. Market Share Analysis, 2022
            17.8.2.1. By Product Type
            17.8.2.2. By Types
            17.8.2.3. By End-Use
            17.8.2.4. By Distribution Channel
    17.9. Germany
        17.9.1. Pricing Analysis
        17.9.2. Market Share Analysis, 2022
            17.9.2.1. By Product Type
            17.9.2.2. By Types
            17.9.2.3. By End-Use
            17.9.2.4. By Distribution Channel
    17.10. Italy
        17.10.1. Pricing Analysis
        17.10.2. Market Share Analysis, 2022
            17.10.2.1. By Product Type
            17.10.2.2. By Types
            17.10.2.3. By End-Use
            17.10.2.4. By Distribution Channel
    17.11. France
        17.11.1. Pricing Analysis
        17.11.2. Market Share Analysis, 2022
            17.11.2.1. By Product Type
            17.11.2.2. By Types
            17.11.2.3. By End-Use
            17.11.2.4. By Distribution Channel
    17.12. United Kingdom
        17.12.1. Pricing Analysis
        17.12.2. Market Share Analysis, 2022
            17.12.2.1. By Product Type
            17.12.2.2. By Types
            17.12.2.3. By End-Use
            17.12.2.4. By Distribution Channel
    17.13. Spain
        17.13.1. Pricing Analysis
        17.13.2. Market Share Analysis, 2022
            17.13.2.1. By Product Type
            17.13.2.2. By Types
            17.13.2.3. By End-Use
            17.13.2.4. By Distribution Channel
    17.14. Russia
        17.14.1. Pricing Analysis
        17.14.2. Market Share Analysis, 2022
            17.14.2.1. By Product Type
            17.14.2.2. By Types
            17.14.2.3. By End-Use
            17.14.2.4. By Distribution Channel
    17.15. BENELUX
        17.15.1. Pricing Analysis
        17.15.2. Market Share Analysis, 2022
            17.15.2.1. By Product Type
            17.15.2.2. By Types
            17.15.2.3. By End-Use
            17.15.2.4. By Distribution Channel
    17.16. Rest of Europe
        17.16.1. Pricing Analysis
        17.16.2. Market Share Analysis, 2022
            17.16.2.1. By Product Type
            17.16.2.2. By Types
            17.16.2.3. By End-Use
            17.16.2.4. By Distribution Channel
    17.17. China
        17.17.1. Pricing Analysis
        17.17.2. Market Share Analysis, 2022
            17.17.2.1. By Product Type
            17.17.2.2. By Types
            17.17.2.3. By End-Use
            17.17.2.4. By Distribution Channel
    17.18. Japan
        17.18.1. Pricing Analysis
        17.18.2. Market Share Analysis, 2022
            17.18.2.1. By Product Type
            17.18.2.2. By Types
            17.18.2.3. By End-Use
            17.18.2.4. By Distribution Channel
    17.19. South Korea
        17.19.1. Pricing Analysis
        17.19.2. Market Share Analysis, 2022
            17.19.2.1. By Product Type
            17.19.2.2. By Types
            17.19.2.3. By End-Use
            17.19.2.4. By Distribution Channel
    17.20. India
        17.20.1. Pricing Analysis
        17.20.2. Market Share Analysis, 2022
            17.20.2.1. By Product Type
            17.20.2.2. By Types
            17.20.2.3. By End-Use
            17.20.2.4. By Distribution Channel
    17.21. Thailand
        17.21.1. Pricing Analysis
        17.21.2. Market Share Analysis, 2022
            17.21.2.1. By Product Type
            17.21.2.2. By Types
            17.21.2.3. By End-Use
            17.21.2.4. By Distribution Channel
    17.22. Malaysia
        17.22.1. Pricing Analysis
        17.22.2. Market Share Analysis, 2022
            17.22.2.1. By Product Type
            17.22.2.2. By Types
            17.22.2.3. By End-Use
            17.22.2.4. By Distribution Channel
    17.23. Indonesia
        17.23.1. Pricing Analysis
        17.23.2. Market Share Analysis, 2022
            17.23.2.1. By Product Type
            17.23.2.2. By Types
            17.23.2.3. By End-Use
            17.23.2.4. By Distribution Channel
    17.24. Rest of South Asia
        17.24.1. Pricing Analysis
        17.24.2. Market Share Analysis, 2022
            17.24.2.1. By Product Type
            17.24.2.2. By Types
            17.24.2.3. By End-Use
            17.24.2.4. By Distribution Channel
    17.25. Australia
        17.25.1. Pricing Analysis
        17.25.2. Market Share Analysis, 2022
            17.25.2.1. By Product Type
            17.25.2.2. By Types
            17.25.2.3. By End-Use
            17.25.2.4. By Distribution Channel
    17.26. New Zealand
        17.26.1. Pricing Analysis
        17.26.2. Market Share Analysis, 2022
            17.26.2.1. By Product Type
            17.26.2.2. By Types
            17.26.2.3. By End-Use
            17.26.2.4. By Distribution Channel
    17.27. GCC Countries
        17.27.1. Pricing Analysis
        17.27.2. Market Share Analysis, 2022
            17.27.2.1. By Product Type
            17.27.2.2. By Types
            17.27.2.3. By End-Use
            17.27.2.4. By Distribution Channel
    17.28. Rest of MEA
        17.28.1. Pricing Analysis
        17.28.2. Market Share Analysis, 2022
            17.28.2.1. By Product Type
            17.28.2.2. By Types
            17.28.2.3. By End-Use
            17.28.2.4. By Distribution Channel
18. Market Structure Analysis
    18.1. Competition Dashboard
    18.2. Competition Benchmarking
    18.3. Market Share Analysis of Top Players
        18.3.1. By Regional
        18.3.2. By Product Type
        18.3.3. By Types
        18.3.4. By End-Use
        18.3.5. By Distribution Channel
19. Competition Analysis
    19.1. Competition Deep Dive
        19.1.1. SPX Flow
            19.1.1.1. Overview
            19.1.1.2. Product Portfolio
            19.1.1.3. Profitability by Market Segments (Product/Age /Sales Channel/Region)
            19.1.1.4. Sales Footprint
            19.1.1.5. Strategy Overview
                19.1.1.5.1. Marketing Strategy
                19.1.1.5.2. Product Strategy
                19.1.1.5.3. Channel Strategy
        19.1.2. EKATO
            19.1.2.1. Overview
            19.1.2.2. Product Portfolio
            19.1.2.3. Profitability by Market Segments (Product/Age /Sales Channel/Region)
            19.1.2.4. Sales Footprint
            19.1.2.5. Strategy Overview
                19.1.2.5.1. Marketing Strategy
                19.1.2.5.2. Product Strategy
                19.1.2.5.3. Channel Strategy
        19.1.3. Sulzer
            19.1.3.1. Overview
            19.1.3.2. Product Portfolio
            19.1.3.3. Profitability by Market Segments (Product/Age /Sales Channel/Region)
            19.1.3.4. Sales Footprint
            19.1.3.5. Strategy Overview
                19.1.3.5.1. Marketing Strategy
                19.1.3.5.2. Product Strategy
                19.1.3.5.3. Channel Strategy
        19.1.4. Xylem
            19.1.4.1. Overview
            19.1.4.2. Product Portfolio
            19.1.4.3. Profitability by Market Segments (Product/Age /Sales Channel/Region)
            19.1.4.4. Sales Footprint
            19.1.4.5. Strategy Overview
                19.1.4.5.1. Marketing Strategy
                19.1.4.5.2. Product Strategy
                19.1.4.5.3. Channel Strategy
        19.1.5. National Oilwell Varco
            19.1.5.1. Overview
            19.1.5.2. Product Portfolio
            19.1.5.3. Profitability by Market Segments (Product/Age /Sales Channel/Region)
            19.1.5.4. Sales Footprint
            19.1.5.5. Strategy Overview
                19.1.5.5.1. Marketing Strategy
                19.1.5.5.2. Product Strategy
                19.1.5.5.3. Channel Strategy
        19.1.6. ALFA LAVAL
            19.1.6.1. Overview
            19.1.6.2. Product Portfolio
            19.1.6.3. Profitability by Market Segments (Product/Age /Sales Channel/Region)
            19.1.6.4. Sales Footprint
            19.1.6.5. Strategy Overview
                19.1.6.5.1. Marketing Strategy
                19.1.6.5.2. Product Strategy
                19.1.6.5.3. Channel Strategy
        19.1.7. Dover
            19.1.7.1. Overview
            19.1.7.2. Product Portfolio
            19.1.7.3. Profitability by Market Segments (Product/Age /Sales Channel/Region)
            19.1.7.4. Sales Footprint
            19.1.7.5. Strategy Overview
                19.1.7.5.1. Marketing Strategy
                19.1.7.5.2. Product Strategy
                19.1.7.5.3. Channel Strategy
        19.1.8. Shenyin
            19.1.8.1. Overview
            19.1.8.2. Product Portfolio
            19.1.8.3. Profitability by Market Segments (Product/Age /Sales Channel/Region)
            19.1.8.4. Sales Footprint
            19.1.8.5. Strategy Overview
                19.1.8.5.1. Marketing Strategy
                19.1.8.5.2. Product Strategy
                19.1.8.5.3. Channel Strategy
        19.1.9. Philadelphia
            19.1.9.1. Overview
            19.1.9.2. Product Portfolio
            19.1.9.3. Profitability by Market Segments (Product/Age /Sales Channel/Region)
            19.1.9.4. Sales Footprint
            19.1.9.5. Strategy Overview
                19.1.9.5.1. Marketing Strategy
                19.1.9.5.2. Product Strategy
                19.1.9.5.3. Channel Strategy
        19.1.10. Zhejiang Great Wall Mixers
            19.1.10.1. Overview
            19.1.10.2. Product Portfolio
            19.1.10.3. Profitability by Market Segments (Product/Age /Sales Channel/Region)
            19.1.10.4. Sales Footprint
            19.1.10.5. Strategy Overview
                19.1.10.5.1. Marketing Strategy
                19.1.10.5.2. Product Strategy
                19.1.10.5.3. Channel Strategy
        19.1.11. Mitsubishi Kakoki Kaisha
            19.1.11.1. Overview
            19.1.11.2. Product Portfolio
            19.1.11.3. Profitability by Market Segments (Product/Age /Sales Channel/Region)
            19.1.11.4. Sales Footprint
            19.1.11.5. Strategy Overview
                19.1.11.5.1. Marketing Strategy
                19.1.11.5.2. Product Strategy
                19.1.11.5.3. Channel Strategy
        19.1.12. Satake
            19.1.12.1. Overview
            19.1.12.2. Product Portfolio
            19.1.12.3. Profitability by Market Segments (Product/Age /Sales Channel/Region)
            19.1.12.4. Sales Footprint
            19.1.12.5. Strategy Overview
                19.1.12.5.1. Marketing Strategy
                19.1.12.5.2. Product Strategy
                19.1.12.5.3. Channel Strategy
        19.1.13. TEIKOKU ELECTRIC
            19.1.13.1. Overview
            19.1.13.2. Product Portfolio
            19.1.13.3. Profitability by Market Segments (Product/Age /Sales Channel/Region)
            19.1.13.4. Sales Footprint
            19.1.13.5. Strategy Overview
                19.1.13.5.1. Marketing Strategy
                19.1.13.5.2. Product Strategy
                19.1.13.5.3. Channel Strategy
        19.1.14. DCI
            19.1.14.1. Overview
            19.1.14.2. Product Portfolio
            19.1.14.3. Profitability by Market Segments (Product/Age /Sales Channel/Region)
            19.1.14.4. Sales Footprint
            19.1.14.5. Strategy Overview
                19.1.14.5.1. Marketing Strategy
                19.1.14.5.2. Product Strategy
                19.1.14.5.3. Channel Strategy
        19.1.15. Silverson Machines
            19.1.15.1. Overview
            19.1.15.2. Product Portfolio
            19.1.15.3. Profitability by Market Segments (Product/Age /Sales Channel/Region)
            19.1.15.4. Sales Footprint
            19.1.15.5. Strategy Overview
                19.1.15.5.1. Marketing Strategy
                19.1.15.5.2. Product Strategy
                19.1.15.5.3. Channel Strategy
20. Assumptions & Acronyms Used
21. Research Methodology
Recommendations

Food and Beverage

Dairy Whiteners Market

May 2023

REP-GB-14560

342 pages

Food and Beverage

Tapioca Maltodextrin Market

November 2024

REP-GB-9319

Upcoming

Explore Process Automation Insights

View Reports
Future Market Insights

Industrial Mixer Market

Schedule a Call