The global industrial electronics packaging market is valued at USD 4,215 million in 2025 and is set to reach USD 7,892 million by 2035, growing at a CAGR of 6.4%. The market stands at the forefront of a transformative decade that promises to redefine component protection infrastructure and advanced encapsulation excellence across manufacturing facilities, automation systems, industrial controls, and electronic assembly sectors. The market's journey from USD 4,215 million in 2025 to USD 7,892 million by 2035 represents substantial growth, demonstrating the accelerating adoption of protective packaging solutions and sophisticated thermal management systems across semiconductor devices, power electronics, sensor assemblies, and mission-critical industrial applications.
The first half of the decade (2025-2030) will witness the market climbing from USD 4,215 million to approximately USD 5,687 million, adding USD 1,472 million in value, which constitutes 40% of the total forecast growth period. This phase will be characterized by the rapid adoption of miniaturization technologies, driven by increasing demand for compact electronic assemblies and enhanced heat dissipation requirements worldwide. Superior moisture barrier capabilities and electromagnetic interference shielding will become standard expectations rather than premium options.
The latter half (2030-2035) will witness sustained growth from USD 5,687 million to USD 7,892 million, representing an addition of USD 2,205 million or 60% of the decade's expansion. This period will be defined by mass market penetration of advanced packaging architectures, integration with comprehensive automation platforms, and seamless compatibility with existing manufacturing infrastructure. The market trajectory signals fundamental shifts in how industrial equipment manufacturers and electronics assemblers approach component protection solutions, with participants positioned to benefit from sustained demand across multiple industrial segments.
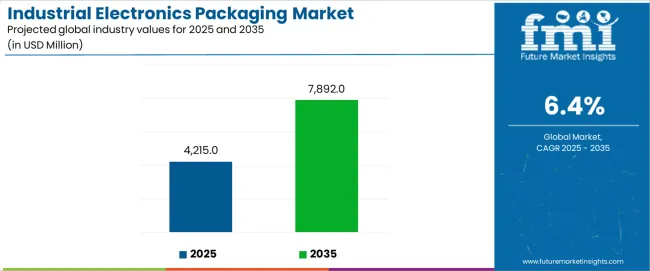
The industrial electronics packaging market demonstrates distinct growth phases with varying market characteristics and competitive dynamics. Between 2025 and 2030, the market progresses through its automation adoption phase, expanding from USD 4,215 million to USD 5,687 million with steady annual increments averaging 6.2% growth. This period showcases the transition from traditional encapsulation methods to advanced system-in-package and multi-chip module technologies with enhanced thermal performance and integrated protection features becoming mainstream capabilities.
The 2025-2030 phase adds USD 1,472 million to market value, representing 40% of total decade expansion. Market maturation factors include standardization of reliability specifications, declining costs for advanced packaging production, and increasing manufacturer awareness of protection benefits reaching 70-75% effectiveness in harsh industrial environments. Competitive landscape evolution during this period features established packaging providers like Amkor Technology and ASE Group expanding their industrial portfolios while new entrants focus on specialized high-temperature solutions and enhanced environmental sealing technology.
From 2030 to 2035, market dynamics shift toward advanced integration and multi-application deployment, with growth accelerating from USD 5,687 million to USD 7,892 million, adding USD 2,205 million or 60% of total expansion. This phase transition logic centers on universal packaging platforms, integration with automated assembly equipment, and deployment across diverse industrial scenarios, becoming standard rather than specialized encapsulation formats. The competitive environment matures with focus shifting from basic protection to comprehensive thermal management performance and compatibility with high-reliability manufacturing operations.
| Metric | Value |
|---|---|
| Market Value (2025) | USD 4,215 million |
| Market Forecast (2035) | USD 7,892 million |
| Growth Rate | 6.40% CAGR |
| Leading Material | Plastics |
| Primary Application | Industrial Automation |
The market demonstrates strong fundamentals with plastic packaging materials capturing a dominant share through superior cost-effectiveness and versatile processing capabilities. Industrial automation applications drive primary demand, supported by increasing factory modernization requirements and reliable component protection solutions. Geographic expansion remains concentrated in Asia Pacific manufacturing hubs with established electronics infrastructure, while emerging industrial economies show accelerating adoption rates driven by automation projects and rising production activity.
The industrial electronics packaging market represents a compelling intersection of component protection innovation, thermal management advancement, and manufacturing efficiency optimization. With robust growth projected from USD 4,215 million in 2025 to USD 7,892 million by 2035 at a 6.40% CAGR, this market is driven by increasing industrial automation expansion trends, semiconductor device proliferation, and commercial demand for high-reliability protection formats.
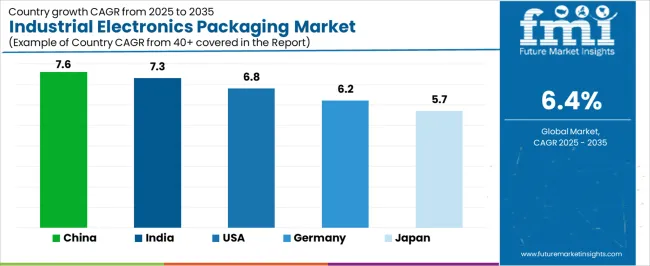
The market's expansion reflects a fundamental shift in how electronics manufacturers and industrial equipment producers approach component encapsulation infrastructure. Strong growth opportunities exist across diverse applications, from factory automation requiring ruggedized packages to power electronics demanding advanced thermal solutions. Geographic expansion is particularly pronounced in Asia-Pacific markets, led by China (7.6% CAGR) and India (7.3% CAGR), while established markets in North America and Europe drive innovation and specialized segment development.
The dominance of plastic materials and automation applications underscores the importance of proven protection technology and manufacturing scalability in driving adoption. Assembly complexity and thermal management requirements remain key challenges, creating opportunities for companies that can deliver reliable performance while maintaining cost efficiency.
Market expansion rests on three fundamental shifts driving adoption across manufacturing and electronics sectors. Industrial automation acceleration creates compelling advantages through packaging systems that provide comprehensive environmental protection with enhanced reliability, enabling manufacturers to deploy electronics in harsh factory conditions and maintain equipment uptime while justifying capital investments over manual operations. Miniaturization demand evolution accelerates as equipment designers worldwide seek compact component formats that deliver higher functionality density within constrained enclosure spaces, enabling performance enhancement that aligns with equipment size reduction expectations and maximizes system capabilities. Manufacturing efficiency optimization drives adoption from assembly facilities requiring automated packaging processes that maximize throughput per production line while maintaining quality standards during high-volume operations.
However, growth faces headwinds from thermal management complexity variations that differ across application requirements regarding heat dissipation capacity and operating temperature ranges, potentially limiting performance reliability in extreme environment categories. Material selection constraints also persist regarding cost-performance tradeoffs and processing compatibility that may increase design complexity in markets with demanding reliability standards.
Primary Classification: The market segments by material into plastics, metals, ceramics, and paper & board categories, representing the evolution from basic protective housings to advanced encapsulation formats for comprehensive component protection operations.
Secondary Breakdown: Application segmentation divides the market into industrial automation, power electronics, automotive electronics, telecommunications equipment, and medical devices sectors, reflecting distinct requirements for environmental resistance, thermal performance, and reliability specifications.
Regional Classification: Geographic distribution covers Asia Pacific, North America, Europe, Latin America, and the Middle East & Africa, with Asia Pacific manufacturing hubs leading adoption while developed markets show steady growth patterns driven by automation modernization programs.
The segmentation structure reveals technology progression from standard injection-molded housings toward integrated protection platforms with enhanced thermal management and electromagnetic shielding capabilities, while application diversity spans from factory automation to medical equipment requiring comprehensive reliability solutions and miniaturized assembly formats.
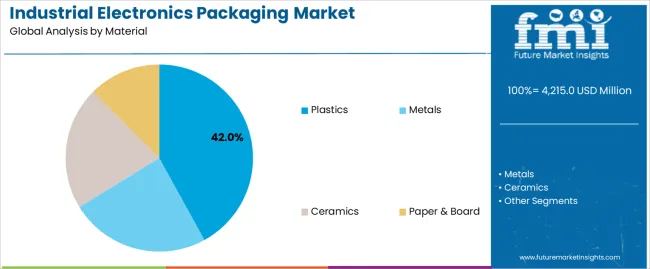
Plastics segment is estimated to account for 42% of the industrial electronics packaging market share in 2025. The segment's leading position stems from its fundamental role as a critical component in cost-effective protection applications and its extensive use across multiple industrial automation and equipment manufacturing sectors. Plastics' dominance is attributed to its superior design flexibility, including complex geometry molding, excellent dielectric properties, and balanced processing economics that make it indispensable for high-volume production operations.
Market Position: Plastic packaging systems command the leading position in the industrial electronics packaging market through advanced molding technologies, including comprehensive material formulation control, multi-cavity tooling capabilities, and reliable dimensional consistency that enable manufacturers to deploy packages across diverse electronic applications.
Value Drivers: The segment benefits from manufacturer preference for proven encapsulation materials that provide exceptional moisture barrier protection without requiring specialized assembly equipment. Efficient processing scalability enables deployment in automation equipment, power conversion systems, and control device applications where cost-effectiveness and design versatility represent critical selection requirements.
Competitive Advantages: Plastic packaging systems differentiate through excellent moldability characteristics, proven chemical resistance performance, and compatibility with automated assembly processes that enhance manufacturing efficiency while maintaining economical production profiles suitable for diverse industrial electronics applications.
Key market characteristics:
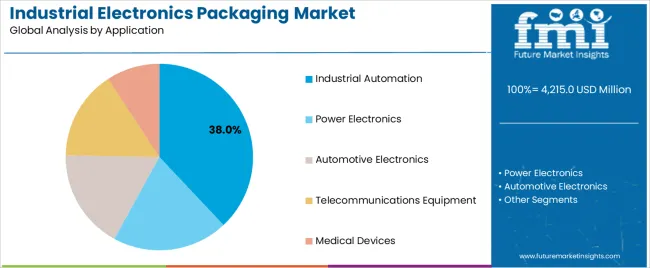
Industrial automation segment is projected to hold 38% of the industrial electronics packaging market share in 2025. The segment's market leadership is driven by the extensive use of packaging in programmable logic controllers, motor drives, sensor assemblies, and control systems, where packages serve as both protective enclosures and thermal management interfaces. The industrial automation sector's consistent investment in factory modernization supports the segment's dominant position.
Market Context: Industrial automation applications dominate the market due to widespread adoption of electronic controls and increasing focus on equipment reliability, productivity enhancement, and operational efficiency that extend machinery service life while maintaining performance integrity.
Appeal Factors: Automation equipment manufacturers prioritize environmental sealing effectiveness, wide temperature operation capability, and integration with existing mounting configurations that enable coordinated deployment across multiple machine platforms. The segment benefits from substantial Industry 4.0 growth and manufacturing standards that emphasize electronic reliability for continuous production operations.
Growth Drivers: Smart factory initiatives incorporate advanced packaging as standard protection formats for distributed control systems. At the same time, robotic automation programs are increasing demand for ruggedized packages that comply with international safety regulations and enhance equipment durability.
Market Challenges: Assembly automation requirements and thermal cycling stress may limit deployment flexibility in ultra-high-temperature operations or extreme cost-sensitive scenarios.
Application dynamics include:
Growth Accelerators: Industrial automation expansion drives primary adoption as packaging systems provide exceptional environmental protection that enables electronics deployment without compromising operational reliability, supporting productivity enhancement and equipment longevity that require rugged encapsulation formats. Miniaturization innovation accelerates market growth as designers seek compact packaging architectures that maintain thermal performance during space-constrained installations while enhancing functionality density through refined assembly technologies. Power electronics proliferation increases worldwide, creating sustained demand for advanced thermal management systems that complement efficiency improvements and provide competitive advantages in heat dissipation capabilities.
Growth Inhibitors: Thermal management complexity challenges differ across power levels regarding heat transfer requirements and cooling system integration, which may limit market penetration and application scope in extreme temperature categories with demanding reliability specifications. Material compatibility constraints persist regarding coefficient of thermal expansion matching and processing temperature limitations that may increase design costs in hermetic sealing applications with strict performance requirements. Market fragmentation across multiple package footprints and terminal configurations creates standardization concerns between different assembly equipment and existing production infrastructure.
Market Evolution Patterns: Adoption accelerates in industrial automation and power electronics sectors where environmental protection justifies packaging investments, with geographic concentration in Asia Pacific manufacturing regions transitioning toward mainstream adoption in developed markets driven by equipment modernization and reliability enhancement programs. Technology development focuses on enhanced thermal interface materials, improved sealing mechanisms, and integration with automated assembly systems that optimize heat dissipation and manufacturing efficiency. The market could face disruption if alternative encapsulation technologies or material innovations significantly challenge traditional packaging advantages in electronics protection applications.
The industrial electronics packaging market demonstrates varied regional dynamics with Growth Leaders including China (7.6% CAGR) and India (7.3% CAGR) driving expansion through manufacturing capacity growth and automation infrastructure development. Steady Performers encompass the USA (6.8% CAGR), Germany (6.2% CAGR), and Japan (5.7% CAGR), benefiting from established electronics sectors and advanced automation adoption.
| Country | CAGR (2025-2035) |
|---|---|
| China | 7.6% |
| India | 7.3% |
| USA | 6.8% |
| Germany | 6.2% |
| Japan | 5.7% |
Regional synthesis reveals Asia-Pacific markets leading growth through electronics manufacturing expansion and industrial automation deployment, while European countries maintain steady expansion supported by precision engineering heritage and advanced manufacturing requirements. North American markets show strong growth driven by automation modernization and power electronics applications.
China establishes regional leadership through massive electronics production capacity and comprehensive automation infrastructure modernization, integrating advanced packaging systems as standard components in industrial equipment and semiconductor device applications. The country's 7.6% CAGR through 2035 reflects manufacturing scale advantages promoting cost-effective packaging adoption and domestic production activity that mandate the use of reliable encapsulation formats in factory automation operations. Growth concentrates in major manufacturing clusters, including Shenzhen, Shanghai, and Suzhou, where electronics assemblers showcase integrated packaging systems that appeal to global equipment manufacturers seeking high-volume production and international quality standards.
Chinese manufacturers are developing innovative packaging solutions that combine local cost advantages with advanced protection specifications, including enhanced moisture resistance and improved thermal dissipation capabilities.
Strategic Market Indicators:
The Indian market emphasizes manufacturing applications, including rapid industrial automation development and comprehensive electronics production growth that increasingly incorporates packaging systems for control equipment and power conversion applications. The country is projected to show a 7.3% CAGR through 2035, driven by massive manufacturing activity under Make in India initiatives and commercial demand for affordable, high-reliability protection systems. Indian electronics manufacturers prioritize cost-effectiveness with packaging delivering environmental protection through economical material usage and efficient production capabilities.
Technology deployment channels include major industrial equipment manufacturers, electronics contract assemblers, and automation system integrators that support high-volume usage for domestic and export applications.
Performance Metrics:
The USA market emphasizes advanced packaging features, including innovative thermal management technologies and integration with comprehensive automation platforms that manage equipment monitoring, predictive maintenance, and quality control applications through unified protection systems. The country is projected to show a 6.8% CAGR through 2035, driven by automation modernization under reshoring trends and commercial demand for high-reliability, premium-performance protection systems. American manufacturers prioritize technical sophistication with packaging delivering comprehensive environmental protection through refined sealing technologies and advanced thermal solutions.
Technology deployment channels include major automation equipment producers, semiconductor packaging facilities, and specialized contract manufacturers that support custom development for mission-critical operations.
Performance Metrics:
In Munich, Stuttgart, and Dresden, German manufacturers and automation equipment producers are implementing advanced packaging systems to enhance product reliability and support precision manufacturing that aligns with quality protocols and performance standards. The German market demonstrates sustained growth with a 6.2% CAGR through 2035, driven by Industry 4.0 innovation programs and advanced manufacturing investments that emphasize premium protection systems for industrial controls and specialty power applications. German production facilities are prioritizing packaging systems that provide exceptional reliability performance while maintaining compliance with strict environmental standards and minimizing thermal stress, particularly important in precision automation equipment and high-performance power electronics.
Market expansion benefits from manufacturing excellence programs that mandate enhanced protection in equipment specifications, creating sustained demand across Germany's industrial automation and electronics sectors, where operational reliability and system durability represent critical requirements.
Strategic Market Indicators:
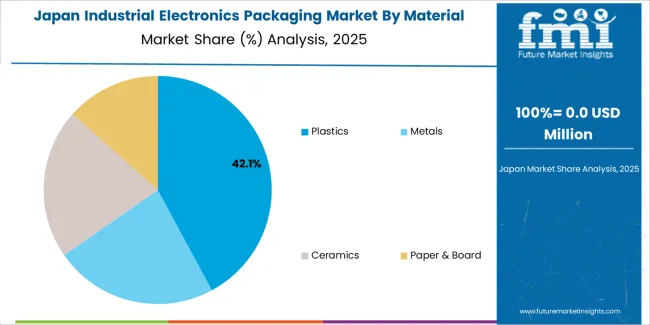
Japan's sophisticated electronics market demonstrates meticulous packaging deployment, growing at 5.7% CAGR, with documented operational excellence in component protection and industrial equipment applications through integration with existing assembly systems and quality control infrastructure. The country leverages engineering expertise in materials science and process precision to maintain market leadership. Manufacturing centers, including Tokyo, Osaka, and Nagoya, showcase advanced installations where packaging systems integrate with comprehensive production platforms and inspection systems to optimize component reliability and product performance.
Japanese manufacturers prioritize protection consistency and thermal performance in product development, creating demand for premium packaging systems with advanced features, including ultra-precise dimensional control and integration with automated testing protocols. The market benefits from established electronics infrastructure and willingness to invest in specialized protection technologies that provide superior reliability retention and regulatory compliance.
Market Intelligence Brief:
The industrial electronics packaging market in Europe is projected to grow from USD 1,265 million in 2025 to USD 2,018 million by 2035, registering a CAGR of 4.8% over the forecast period. Germany is expected to maintain its leadership position with a 38.2% market share in 2025, declining slightly to 37.8% by 2035, supported by its manufacturing excellence and major industrial automation centers, including Bavaria and Baden-Württemberg.
France follows with a 19.8% share in 2025, projected to reach 20.3% by 2035, driven by comprehensive industrial modernization and aerospace electronics adoption. United Kingdom holds a 16.2% share in 2025, expected to maintain 16.5% by 2035 through established automation sectors and automotive electronics production. Italy commands a 13.7% share, while Netherlands accounts for 8.4% in 2025. The Rest of Europe region is anticipated to gain momentum, expanding its collective share from 3.7% to 4.2% by 2035, attributed to increasing automation development in Eastern European manufacturing centers and emerging Nordic electronics facilities implementing advanced protection programs.
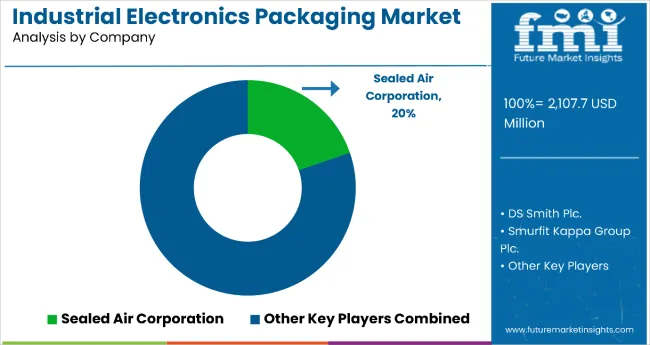
The industrial electronics packaging market operates with moderate concentration, featuring approximately 22-30 participants, where leading companies control roughly 38-45% of the global market share through established assembly capabilities and comprehensive thermal management expertise. Competition emphasizes reliability performance, thermal efficiency features, and manufacturing scalability rather than price-based rivalry.
Market leaders encompass Amkor Technology, ASE Group, and JCET Group, which maintain competitive advantages through extensive semiconductor packaging expertise, global manufacturing networks, and comprehensive technical support capabilities that create customer loyalty and support electronics requirements. These companies leverage decades of assembly process experience and ongoing technology investments to develop advanced packaging architectures with exceptional thermal dissipation and environmental protection features. Amkor Technology leads with 15% share.
Specialty challengers include STATS ChipPAC, Powertech Technology, and ChipMOS Technologies, which compete through specialized industrial application focus and efficient protection solutions that appeal to automation equipment manufacturers seeking ruggedized encapsulation formats and custom design flexibility. These companies differentiate through process engineering emphasis and specialized harsh environment application focus.
Market dynamics favor participants that combine reliable environmental protection with advanced thermal support, including heat spreader integration and multi-material construction. Competitive pressure intensifies as traditional semiconductor packaging providers expand into industrial systems. At the same time, specialized automation component suppliers challenge established players through innovative sealing technologies and cost-effective production targeting emerging industrial electronics segments.
| Item | Value |
|---|---|
| Quantitative Units | USD 4,215 million |
| Material | Plastics, Metals, Ceramics, Paper & Board |
| Application | Industrial Automation, Power Electronics, Automotive Electronics, Telecommunications Equipment, Medical Devices |
| Regions Covered | Asia Pacific, North America, Europe, Latin America, Middle East & Africa |
| Countries Covered | China, USA, Germany, Japan, India, and 25+ additional countries |
| Key Companies Profiled | Amkor Technology, ASE Group, JCET Group, STATS ChipPAC, Powertech Technology, ChipMOS Technologies |
| Additional Attributes | Dollar sales by material and application categories, regional adoption trends across Asia Pacific, North America, and Europe, competitive landscape with packaging manufacturers and electronics assemblers, manufacturer preferences for thermal performance and environmental protection, integration with automated assembly equipment and testing systems, innovations in thermal interface materials and sealing technology, and development of specialized protection solutions with enhanced reliability capabilities and miniaturization features |
The global industrial electronics packaging market is estimated to be valued at USD 4,215.0 million in 2025.
The market size for the industrial electronics packaging market is projected to reach USD 7,892.0 million by 2035.
The industrial electronics packaging market is expected to grow at a 6.4% CAGR between 2025 and 2035.
The key product types in industrial electronics packaging market are plastics, metals, ceramics and paper & board.
In terms of application, industrial automation segment to command 38.0% share in the industrial electronics packaging market in 2025.


Our Research Products

The "Full Research Suite" delivers actionable market intel, deep dives on markets or technologies, so clients act faster, cut risk, and unlock growth.

The Leaderboard benchmarks and ranks top vendors, classifying them as Established Leaders, Leading Challengers, or Disruptors & Challengers.

Locates where complements amplify value and substitutes erode it, forecasting net impact by horizon

We deliver granular, decision-grade intel: market sizing, 5-year forecasts, pricing, adoption, usage, revenue, and operational KPIs—plus competitor tracking, regulation, and value chains—across 60 countries broadly.

Spot the shifts before they hit your P&L. We track inflection points, adoption curves, pricing moves, and ecosystem plays to show where demand is heading, why it is changing, and what to do next across high-growth markets and disruptive tech

Real-time reads of user behavior. We track shifting priorities, perceptions of today’s and next-gen services, and provider experience, then pace how fast tech moves from trial to adoption, blending buyer, consumer, and channel inputs with social signals (#WhySwitch, #UX).

Partner with our analyst team to build a custom report designed around your business priorities. From analysing market trends to assessing competitors or crafting bespoke datasets, we tailor insights to your needs.
Supplier Intelligence
Discovery & Profiling
Capacity & Footprint
Performance & Risk
Compliance & Governance
Commercial Readiness
Who Supplies Whom
Scorecards & Shortlists
Playbooks & Docs
Category Intelligence
Definition & Scope
Demand & Use Cases
Cost Drivers
Market Structure
Supply Chain Map
Trade & Policy
Operating Norms
Deliverables
Buyer Intelligence
Account Basics
Spend & Scope
Procurement Model
Vendor Requirements
Terms & Policies
Entry Strategy
Pain Points & Triggers
Outputs
Pricing Analysis
Benchmarks
Trends
Should-Cost
Indexation
Landed Cost
Commercial Terms
Deliverables
Brand Analysis
Positioning & Value Prop
Share & Presence
Customer Evidence
Go-to-Market
Digital & Reputation
Compliance & Trust
KPIs & Gaps
Outputs
Full Research Suite comprises of:
Market outlook & trends analysis
Interviews & case studies
Strategic recommendations
Vendor profiles & capabilities analysis
5-year forecasts
8 regions and 60+ country-level data splits
Market segment data splits
12 months of continuous data updates
DELIVERED AS:
PDF EXCEL ONLINE
Industrial Electronics Packaging Industry Analysis in Western Europe Size and Share Forecast Outlook 2025 to 2035
Competitive Overview of Industrial Electronics Packaging Companies
Japan Industrial Electronics Packaging Market Analysis by Material Type, Packaging Type, Product Type, and City through 2035
Korea Industrial Electronics Packaging Market Analysis by Material Type, Product Type, Packaging Type, and Province through 2035
Industrial Chemical Packaging Market Size and Share Forecast Outlook 2025 to 2035
Market Positioning & Share in Industrial Chemical Packaging
MENA Industrial Packaging Market Size and Share Forecast Outlook 2025 to 2035
Rigid Industrial Packaging Market Size, Share & Forecast 2025 to 2035
Consumer Electronics Packaging Market Size and Share Forecast Outlook 2025 to 2035
Market Share Insights for Consumer Electronics Packaging Manufacturers
Latin America Rigid Industrial Packaging Market Size and Share Forecast Outlook 2025 to 2035
Europe & USA Consumer Electronics Packaging Market Size and Share Forecast Outlook 2025 to 2035
Industrial Grade Electrochemical CO Sensor Market Size and Share Forecast Outlook 2025 to 2035
Industrial Bench Scale Market Size and Share Forecast Outlook 2025 to 2035
Industrial Low Profile Floor Scale Market Size and Share Forecast Outlook 2025 to 2035
Industrial Sand Mill Market Size and Share Forecast Outlook 2025 to 2035
Industrial Control Network Modules Market Size and Share Forecast Outlook 2025 to 2035
Industrial Precision Oven Market Size and Share Forecast Outlook 2025 to 2035
Industrial Water Chiller for PCB Market Size and Share Forecast Outlook 2025 to 2035
Industrial & Commercial HVLS Fans Market Size and Share Forecast Outlook 2025 to 2035

Thank you!
You will receive an email from our Business Development Manager. Please be sure to check your SPAM/JUNK folder too.
Chat With
MaRIA