Reports
- Global Locations -
Headquarters
Future Market Insights, Inc.
Christiana Corporate, 200
Continental Drive, Suite 401,
Newark, Delaware - 19713,
United States
Americas
Future Market Insights, Inc.
616 Corporate Way, Suite 2-9018,
Valley Cottage, NY 10989, United States
MEA
Future Market Insights
1602-6 Jumeirah Bay X2 Tower, Plot No: JLT-PH2-X2A,
Jumeirah Lakes Towers, Dubai,
United Arab Emirates
Europe
Future Market Insights
3rd Floor, 207 Regent Street,
W1B 3HH London
United Kingdom
Asia Pacific
Future Market Insights
Office No. 401-A, 4th Floor,
VANTAGE 9, S.No. 36/1/1,
Baner, Pune 411045, India
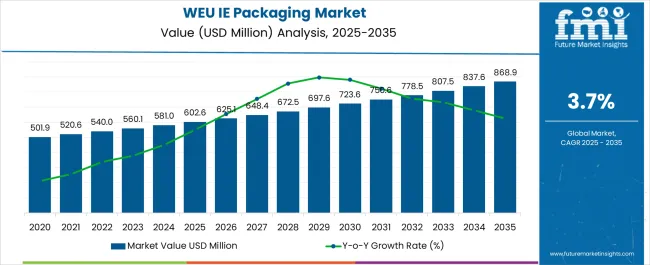
The consumption of industrial electronics packaging in Western Europe is estimated to expand at a steady CAGR of 3.9% through 2034. The sales of industrial electronics packaging in Western Europe are expected to reach a valuation of US$ 851.4 million by 2034, up from US$ 580.0 million in 2024.
Trends in industrial electronics packaging mirror the packaging trends in the overall electronics industry. Researchers are currently innovating robust packaging solutions to enhance the performance scope of industrial electronics packaging.
The industry is also shifting toward sustainable packaging options by incorporating biodegradable materials in their systems. New developments like smart and eco-friendly packaging are gaining popularity as the long-term effects of e-waste come into the limelight.
Attributes | Details |
---|---|
Industry Size of Industrial Electronics Packaging in Western Europe in 2024 | US$ 580.0 million |
Expected Industry Size of Industrial Electronics Packaging in Western Europe by 2034 | US$ 851.4 million |
Forecast CAGR between 2024 to 2034 | 3.9% |
Don't pay for what you don't need
Customize your report by selecting specific countries or regions and save 30%!
The given table provides a comparative outlook on the potential of industrial electronics packaging in different geographies. Based on adoption rates, Korea is projected to experience substantial growth in industrial electronics packaging adoption, while Western Europe is anticipated to secure the predominant share in the global market.
Industry Analysis of Industrial Electronics Packaging in Western Europe:
Attributes | Industry Analysis of Industrial Electronics Packaging in Western Europe |
---|---|
Western Europe’s CAGR between 2024 to 2034 | 3.9% |
Industry Size of Western Europe in 2024 | US$ 580.0 million |
Key Trends | Increasing prevalence of digitalization in the field of industrial electronics packaging |
Industry Analysis of Industrial Electronics Packaging in Korea:
Attributes | Industry Analysis of Industrial Electronics Packaging in Korea |
---|---|
Korea’s CAGR between 2024 to 2034 | 4.1% |
Industry Size of Korea in 2024 | US$ 68.5 million |
Key Trends | Technological advancements in electronics packaging designs |
Global Demand for Industrial Electronics Packaging:
Attributes | Global Demand for Industrial Electronics Packaging |
---|---|
Global CAGR between 2024 to 2034 | 3.8% |
Global Industry Size in 2024 | US$ 2,025.80 million |
Key Trend | Growing trend toward eco-friendly packaging solutions for industrial electronics |
Leading Packaging Type | Rigid |
---|---|
Segment Share % (2024) | 96.50% |
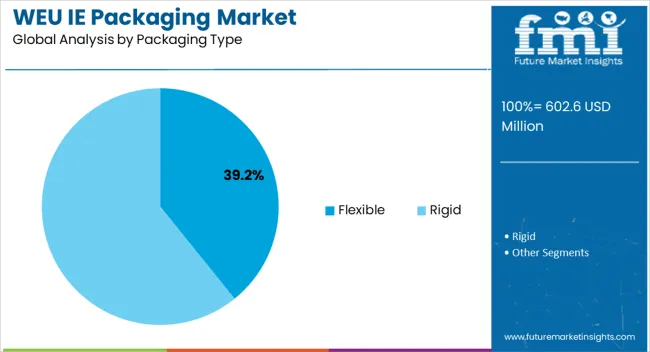
The rigid electronics packaging is predicted to acquire a maximum stake of 96.50% in 2024. Following factors are augmenting the sales of rigid industrial electronics packaging in Western Europe:
Leading Material Type | Plastic |
---|---|
Segment Share % (2024) | 58.80% |
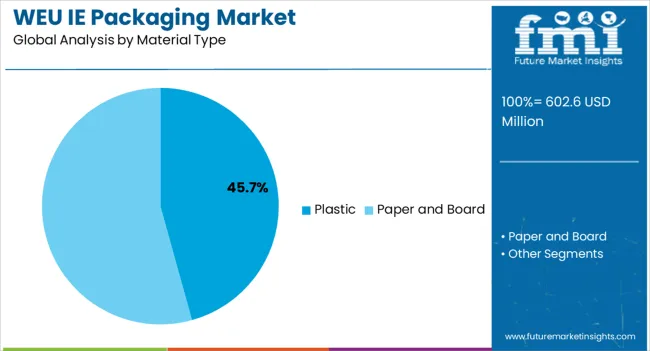
The plastic segment is predicted to obtain a share of 58.80% in 2024. Plastics have enjoyed a prominent presence in the industrial electronics packaging industry in the historical period, and it is predicted that the momentum is going to be sustained over the forecast period as well.
Growing sustainability concerns are anticipated to influence the demand for industrial electronics packaging in Western Europe, and the plastic segment is expected to lose some of its share to eco-friendly alternatives in the next decade. Demand for the paper and board segment is expected to observe healthy growth as plastic is witnessing reduced adoption due to its adverse impact on the environment.
Country | Germany |
---|---|
Forecast CAGR % (2024 to 2034) | 4.0% |
The sales of industrial electronics packaging in Germany are predicted to expand at a CAGR of 4.0% through 2034. Leading factors augmenting the sales of industrial electronics packaging in Germany are as follows:
Country | Italy |
---|---|
Forecast CAGR % (2024 to 2034) | 3.2% |
The adoption of industrial electronics packaging in Italy is projected to inflate at a CAGR of 3.2% through 2034. Mentioned below are the leading factors pushing the adoption of industrial electronics packaging:
Country | Netherlands |
---|---|
Forecast CAGR % (2024 to 2034) | 1.9% |
The Netherlands is predicted to display a growth trajectory of 1.9% CAGR for the adoption of industrial electronics packaging through 2034. Given below are the leading factors augmenting the sales of industrial electronics packaging in the country:
Country | France |
---|---|
Forecast CAGR % (2024 to 2034) | 3.7% |
The France industrial electronics packaging industry is anticipated to expand at a CAGR of 3.7% through 2034. Following factors augmenting investments in industrial electronics packaging business include:
Country | United Kingdom |
---|---|
Forecast CAGR % (2024 to 2034) | 2.9% |
The uptake of industrial electronics packaging in the United Kingdom is predicted to increase at a CAGR of 2.9% through 2034. Over the forecast period, the sales are forecast to rise on the back of following factors:
Get the data you need at a Fraction of the cost
Personalize your report by choosing insights you need
and save 40%!
Key leaders in industrial electronics product packaging in Western Europe are concentrating their resources on mergers and acquisitions to coordinate research and development of distinctive products. Another key strategy followed by key players to generate higher revenues is the development of advanced electronic packaging solutions. The following developments are ramping up the sales of industrial electronics packaging in Western Europe:
Attribute | Details |
---|---|
Estimated Industry Size in 2024 | US$ 580.0 million |
Projected Industry Size by 2034 | US$ 851.4 million |
Anticipated CAGR between 2024 to 2034 | 3.9% CAGR |
Historical Analysis of Demand for Industrial Electronics Packaging in Western Europe | 2019 to 2023 |
Demand Forecast for Industrial Electronics Packaging in Western Europe | 2024 to 2034 |
Report Coverage for Industrial Electronics Packaging in Western Europe | Industry Size, Industry Trends, Analysis of Key Factors Influencing the Adoption of Industrial Electronics Packaging in Western Europe, Insights on Western Europe Players and their Industry Strategy in Western Europe, Ecosystem Analysis of Local and Regional Western Europe Providers |
Key Countries Analyzed for Industrial Electronics Packaging in Western Europe |
|
Key Companies Profiled for Industrial Electronics Packaging in Western Europe |
|
1. Executive Summary 1.1. Western Europe Market Outlook 1.2. Demand-side Trends 1.3. Supply-side Trends 1.4. Technology Roadmap Analysis 1.5. Analysis and Recommendations 2. Market Overview 2.1. Market Coverage / Taxonomy 2.2. Market Definition / Scope / Limitations 3. Market Background 3.1. Market Dynamics 3.1.1. Drivers 3.1.2. Restraints 3.1.3. Opportunity 3.1.4. Trends 3.2. Scenario Forecast 3.2.1. Demand in Optimistic Scenario 3.2.2. Demand in Likely Scenario 3.2.3. Demand in Conservative Scenario 3.3. Opportunity Map Analysis 3.4. Product Life Cycle Analysis 3.5. Supply Chain Analysis 3.5.1. Supply Side Participants and their Roles 3.5.1.1. Producers 3.5.1.2. Mid-Level Participants (Traders/ Agents/ Brokers) 3.5.1.3. Wholesalers and Distributors 3.5.2. Value Added and Value Created at Node in the Supply Chain 3.5.3. List of Raw Material Suppliers 3.5.4. List of Existing and Potential Buyer’s 3.6. Investment Feasibility Matrix 3.7. Value Chain Analysis 3.7.1. Profit Margin Analysis 3.7.2. Wholesalers and Distributors 3.7.3. Retailers 3.8. PESTLE and Porter’s Analysis 3.9. Regulatory Landscape 3.9.1. By Key Regions 3.9.2. By Key Countries 3.10. Regional Parent Market Outlook 3.11. Production and Consumption Statistics 3.12. Import and Export Statistics 4. Western Europe Industry Analysis and Outlook 2019 to 2023 and Forecast, 2024 to 2034 4.1. Historical Market Size Value (US$ Million) & Volume (Units) Analysis, 2019 to 2023 4.2. Current and Future Market Size Value (US$ Million) & Volume (Units) Projections, 2024 to 2034 4.2.1. Y-o-Y Growth Trend Analysis 4.2.2. Absolute $ Opportunity Analysis 5. Western Europe Industry Analysis and Outlook 2019 to 2023 and Forecast 2024 to 2034, By Material Type 5.1. Introduction / Key Findings 5.2. Historical Market Size Value (US$ Million) & Volume (Units) Analysis By Material Type, 2019 to 2023 5.3. Current and Future Market Size Value (US$ Million) & Volume (Units) Analysis and Forecast By Material Type, 2024 to 2034 5.3.1. Plastic 5.3.1.1. Polyethylene terephthalate (PET) 5.3.1.2. Polyethylene (PE) 5.3.1.3. Polypropylene (PP) 5.3.1.4. Polystyrene (PS) 5.3.1.5. Polyvinyl chloride (PVC) 5.3.2. Paper & Paperboard 5.4. Y-o-Y Growth Trend Analysis By Material Type, 2019 to 2023 5.5. Absolute $ Opportunity Analysis By Material Type, 2024 to 2034 6. Western Europe Industry Analysis and Outlook 2019 to 2023 and Forecast 2024 to 2034, By Packaging Type 6.1. Introduction / Key Findings 6.2. Historical Market Size Value (US$ Million) & Volume (Units) Analysis By Packaging Type, 2019 to 2023 6.3. Current and Future Market Size Value (US$ Million) & Volume (Units) Analysis and Forecast By Packaging Type, 2024 to 2034 6.3.1. Flexible 6.3.1.1. Bags & Pouches 6.3.1.2. Films & others 6.3.1.3. Tapes & Labels 6.3.2. Rigid 6.3.2.1. Bin & Totes 6.3.2.2. Clamshells 6.3.2.3. Container & Shippers 6.3.2.4. Corrugated Box 6.3.2.5. Others 6.3.2.6. Protective Packaging 6.3.2.7. Trays 6.4. Y-o-Y Growth Trend Analysis By Packaging Type, 2019 to 2023 6.5. Absolute $ Opportunity Analysis By Packaging Type, 2024 to 2034 7. Western Europe Industry Analysis and Outlook 2019 to 2023 and Forecast 2024 to 2034, By Product Type 7.1. Introduction / Key Findings 7.2. Historical Market Size Value (US$ Million) & Volume (Units) Analysis By Product Type, 2019 to 2023 7.3. Current and Future Market Size Value (US$ Million) & Volume (Units) Analysis and Forecast By Product Type, 2024 to 2034 7.3.1. Industrial Automation Equipment & Others 7.3.2. Industrial Controls 7.3.3. Power Electronics 7.3.4. Process Control Equipment 7.3.5. Testing & Measuring Equipment 7.4. Y-o-Y Growth Trend Analysis By Product Type, 2019 to 2023 7.5. Absolute $ Opportunity Analysis By Product Type, 2024 to 2034 8. Western Europe Industry Analysis and Outlook 2019 to 2023 and Forecast 2024 to 2034, By Country 8.1. Introduction 8.2. Historical Market Size Value (US$ Million) & Volume (Units) Analysis By Country, 2019 to 2023 8.3. Current Market Size Value (US$ Million) & Volume (Units) Analysis and Forecast By Country, 2024 to 2034 8.3.1. UK 8.3.2. Germany 8.3.3. Italy 8.3.4. France 8.3.5. Spain 8.3.6. Rest of Western Europe 8.4. Market Attractiveness Analysis By Country 9. UK Industry Analysis and Outlook 2019 to 2023 and Forecast 2024 to 2034, By Region 9.1. Historical Market Size Value (US$ Million) & Volume (Units) Trend Analysis By Market Taxonomy, 2019 to 2023 9.2. Market Size Value (US$ Million) & Volume (Units) Forecast By Market Taxonomy, 2024 to 2034 9.2.1. By Region 9.2.1.1. England 9.2.1.2. Scotland 9.2.1.3. Wales 9.2.1.4. Northern Ireland 9.2.2. By Material Type 9.2.3. By Packaging Type 9.2.4. By Product Type 9.3. Market Attractiveness Analysis 9.3.1. By Region 9.3.2. By Material Type 9.3.3. By Packaging Type 9.3.4. By Product Type 9.4. Key Takeaways 10. Germany Industry Analysis and Outlook 2019 to 2023 and Forecast 2024 to 2034, By Region 10.1. Historical Market Size Value (US$ Million) & Volume (Units) Trend Analysis By Market Taxonomy, 2019 to 2023 10.2. Market Size Value (US$ Million) & Volume (Units) Forecast By Market Taxonomy, 2024 to 2034 10.2.1. By Region 10.2.1.1. North-east (Germany) 10.2.1.2. North-west (Germany) 10.2.1.3. Central (Germany) 10.2.1.4. South (Germany) 10.2.1.5. Other(Germany) 10.2.2. By Material Type 10.2.3. By Packaging Type 10.2.4. By Product Type 10.3. Market Attractiveness Analysis 10.3.1. By Region 10.3.2. By Material Type 10.3.3. By Packaging Type 10.3.4. By Product Type 10.4. Key Takeaways 11. Italy Industry Analysis and Outlook 2019 to 2023 and Forecast 2024 to 2034, By Region 11.1. Historical Market Size Value (US$ Million) & Volume (Units) Trend Analysis By Market Taxonomy, 2019 to 2023 11.2. Market Size Value (US$ Million) & Volume (Units) Forecast By Market Taxonomy, 2024 to 2034 11.2.1. By Region 11.2.1.1. North (Italy) 11.2.1.2. Central (Italy) 11.2.1.3. South (Italy) 11.2.1.4. Islands (Italy) 11.2.2. By Material Type 11.2.3. By Packaging Type 11.2.4. By Product Type 11.3. Market Attractiveness Analysis 11.3.1. By Region 11.3.2. By Material Type 11.3.3. By Packaging Type 11.3.4. By Product Type 11.4. Key Takeaways 12. France Industry Analysis and Outlook 2019 to 2023 and Forecast 2024 to 2034, By Region 12.1. Historical Market Size Value (US$ Million) & Volume (Units) Trend Analysis By Market Taxonomy, 2019 to 2023 12.2. Market Size Value (US$ Million) & Volume (Units) Forecast By Market Taxonomy, 2024 to 2034 12.2.1. By Region 12.2.1.1. Northern (France) 12.2.1.2. Central (France) 12.2.1.3. Southern (France) 12.2.1.4. Eastern (France) 12.2.2. By Material Type 12.2.3. By Packaging Type 12.2.4. By Product Type 12.3. Market Attractiveness Analysis 12.3.1. By Region 12.3.2. By Material Type 12.3.3. By Packaging Type 12.3.4. By Product Type 12.4. Key Takeaways 13. Spain Industry Analysis and Outlook 2019 to 2023 and Forecast 2024 to 2034, By Region 13.1. Historical Market Size Value (US$ Million) & Volume (Units) Trend Analysis By Market Taxonomy, 2019 to 2023 13.2. Market Size Value (US$ Million) & Volume (Units) Forecast By Market Taxonomy, 2024 to 2034 13.2.1. By Region 13.2.1.1. Basque Country 13.2.1.2. Andalusia 13.2.1.3. Extremadura 13.2.1.4. Catalonia 13.2.1.5. Valencia 13.2.1.6. Rest Of Spain 13.2.2. By Material Type 13.2.3. By Packaging Type 13.2.4. By Product Type 13.3. Market Attractiveness Analysis 13.3.1. By Region 13.3.2. By Material Type 13.3.3. By Packaging Type 13.3.4. By Product Type 13.4. Key Takeaways 14. Rest of Western Europe Industry Analysis and Outlook 2019 to 2023 and Forecast 2024 to 2034 14.1. Historical Market Size Value (US$ Million) & Volume (Units) Trend Analysis By Market Taxonomy, 2019 to 2023 14.2. Market Size Value (US$ Million) & Volume (Units) Forecast By Market Taxonomy, 2024 to 2034 14.2.1. By Material Type 14.2.2. By Packaging Type 14.2.3. By Product Type 14.3. Market Attractiveness Analysis 14.3.1. By Material Type 14.3.2. By Packaging Type 14.3.3. By Product Type 14.4. Key Takeaways 15. Market Structure Analysis 15.1. Competition Dashboard 15.2. Competition Benchmarking 15.3. Market Share Analysis of Top Players 15.3.1. By Regional 15.3.2. By Material Type 15.3.3. By Packaging Type 15.3.4. By Product Type 16. Competition Analysis 16.1. Competition Deep Dive 16.1.1. UFP Technologies Inc. 16.1.1.1. Overview 16.1.1.2. Product Portfolio 16.1.1.3. Profitability by Market Segments 16.1.1.4. Sales Footprint 16.1.1.5. Strategy Overview 16.1.1.5.1. Marketing Strategy 16.1.1.5.2. Product Strategy 16.1.1.5.3. Channel Strategy 16.1.2. Sealed Air Corporation 16.1.2.1. Overview 16.1.2.2. Product Portfolio 16.1.2.3. Profitability by Market Segments 16.1.2.4. Sales Footprint 16.1.2.5. Strategy Overview 16.1.2.5.1. Marketing Strategy 16.1.2.5.2. Product Strategy 16.1.2.5.3. Channel Strategy 16.1.3. Achilles Corporation 16.1.3.1. Overview 16.1.3.2. Product Portfolio 16.1.3.3. Profitability by Market Segments 16.1.3.4. Sales Footprint 16.1.3.5. Strategy Overview 16.1.3.5.1. Marketing Strategy 16.1.3.5.2. Product Strategy 16.1.3.5.3. Channel Strategy 16.1.4. Desco Industries Inc. 16.1.4.1. Overview 16.1.4.2. Product Portfolio 16.1.4.3. Profitability by Market Segments 16.1.4.4. Sales Footprint 16.1.4.5. Strategy Overview 16.1.4.5.1. Marketing Strategy 16.1.4.5.2. Product Strategy 16.1.4.5.3. Channel Strategy 16.1.5. Botron Company Inc. 16.1.5.1. Overview 16.1.5.2. Product Portfolio 16.1.5.3. Profitability by Market Segments 16.1.5.4. Sales Footprint 16.1.5.5. Strategy Overview 16.1.5.5.1. Marketing Strategy 16.1.5.5.2. Product Strategy 16.1.5.5.3. Channel Strategy 16.1.6. Kiva Container Corporation 16.1.6.1. Overview 16.1.6.2. Product Portfolio 16.1.6.3. Profitability by Market Segments 16.1.6.4. Sales Footprint 16.1.6.5. Strategy Overview 16.1.6.5.1. Marketing Strategy 16.1.6.5.2. Product Strategy 16.1.6.5.3. Channel Strategy 16.1.7. Orlando Products Inc. 16.1.7.1. Overview 16.1.7.2. Product Portfolio 16.1.7.3. Profitability by Market Segments 16.1.7.4. Sales Footprint 16.1.7.5. Strategy Overview 16.1.7.5.1. Marketing Strategy 16.1.7.5.2. Product Strategy 16.1.7.5.3. Channel Strategy 16.1.8. Delphon Industries LLC 16.1.8.1. Overview 16.1.8.2. Product Portfolio 16.1.8.3. Profitability by Market Segments 16.1.8.4. Sales Footprint 16.1.8.5. Strategy Overview 16.1.8.5.1. Marketing Strategy 16.1.8.5.2. Product Strategy 16.1.8.5.3. Channel Strategy 16.1.9. Summit Container Corporation 16.1.9.1. Overview 16.1.9.2. Product Portfolio 16.1.9.3. Profitability by Market Segments 16.1.9.4. Sales Footprint 16.1.9.5. Strategy Overview 16.1.9.5.1. Marketing Strategy 16.1.9.5.2. Product Strategy 16.1.9.5.3. Channel Strategy 16.1.10. Protective Packaging Corporation 16.1.10.1. Overview 16.1.10.2. Product Portfolio 16.1.10.3. Profitability by Market Segments 16.1.10.4. Sales Footprint 16.1.10.5. Strategy Overview 16.1.10.5.1. Marketing Strategy 16.1.10.5.2. Product Strategy 16.1.10.5.3. Channel Strategy 17. Assumptions & Acronyms Used 18. Research Methodology
Don't pay for what you don't need
Customize your report by selecting specific countries or regions and save 30%!
Table 1: Western Europe Industry Analysis and Outlook Value (US$ Million) Forecast by Country, 2019 to 2034 Table 2: Western Europe Industry Analysis and Outlook Volume (Units) Forecast by Country, 2019 to 2034 Table 3: Western Europe Industry Analysis and Outlook Value (US$ Million) Forecast by Material Type, 2019 to 2034 Table 4: Western Europe Industry Analysis and Outlook Volume (Units) Forecast by Material Type, 2019 to 2034 Table 5: Western Europe Industry Analysis and Outlook Value (US$ Million) Forecast by Packaging Type, 2019 to 2034 Table 6: Western Europe Industry Analysis and Outlook Volume (Units) Forecast by Packaging Type, 2019 to 2034 Table 7: Western Europe Industry Analysis and Outlook Value (US$ Million) Forecast by Product Type, 2019 to 2034 Table 8: Western Europe Industry Analysis and Outlook Volume (Units) Forecast by Product Type, 2019 to 2034 Table 9: UK Industry Analysis and Outlook Value (US$ Million) Forecast By Region, 2019 to 2034 Table 10: UK Industry Analysis and Outlook Volume (Units) Forecast By Region, 2019 to 2034 Table 11: UK Industry Analysis and Outlook Value (US$ Million) Forecast by Material Type, 2019 to 2034 Table 12: UK Industry Analysis and Outlook Volume (Units) Forecast by Material Type, 2019 to 2034 Table 13: UK Industry Analysis and Outlook Value (US$ Million) Forecast by Packaging Type, 2019 to 2034 Table 14: UK Industry Analysis and Outlook Volume (Units) Forecast by Packaging Type, 2019 to 2034 Table 15: UK Industry Analysis and Outlook Value (US$ Million) Forecast by Product Type, 2019 to 2034 Table 16: UK Industry Analysis and Outlook Volume (Units) Forecast by Product Type, 2019 to 2034 Table 17: Germany Industry Analysis and Outlook Value (US$ Million) Forecast By Region, 2019 to 2034 Table 18: Germany Industry Analysis and Outlook Volume (Units) Forecast By Region, 2019 to 2034 Table 19: Germany Industry Analysis and Outlook Value (US$ Million) Forecast by Material Type, 2019 to 2034 Table 20: Germany Industry Analysis and Outlook Volume (Units) Forecast by Material Type, 2019 to 2034 Table 21: Germany Industry Analysis and Outlook Value (US$ Million) Forecast by Packaging Type, 2019 to 2034 Table 22: Germany Industry Analysis and Outlook Volume (Units) Forecast by Packaging Type, 2019 to 2034 Table 23: Germany Industry Analysis and Outlook Value (US$ Million) Forecast by Product Type, 2019 to 2034 Table 24: Germany Industry Analysis and Outlook Volume (Units) Forecast by Product Type, 2019 to 2034 Table 25: Italy Industry Analysis and Outlook Value (US$ Million) Forecast By Region, 2019 to 2034 Table 26: Italy Industry Analysis and Outlook Volume (Units) Forecast By Region, 2019 to 2034 Table 27: Italy Industry Analysis and Outlook Value (US$ Million) Forecast by Material Type, 2019 to 2034 Table 28: Italy Industry Analysis and Outlook Volume (Units) Forecast by Material Type, 2019 to 2034 Table 29: Italy Industry Analysis and Outlook Value (US$ Million) Forecast by Packaging Type, 2019 to 2034 Table 30: Italy Industry Analysis and Outlook Volume (Units) Forecast by Packaging Type, 2019 to 2034 Table 31: Italy Industry Analysis and Outlook Value (US$ Million) Forecast by Product Type, 2019 to 2034 Table 32: Italy Industry Analysis and Outlook Volume (Units) Forecast by Product Type, 2019 to 2034 Table 33: France Industry Analysis and Outlook Value (US$ Million) Forecast By Region, 2019 to 2034 Table 34: France Industry Analysis and Outlook Volume (Units) Forecast By Region, 2019 to 2034 Table 35: France Industry Analysis and Outlook Value (US$ Million) Forecast by Material Type, 2019 to 2034 Table 36: France Industry Analysis and Outlook Volume (Units) Forecast by Material Type, 2019 to 2034 Table 37: France Industry Analysis and Outlook Value (US$ Million) Forecast by Packaging Type, 2019 to 2034 Table 38: France Industry Analysis and Outlook Volume (Units) Forecast by Packaging Type, 2019 to 2034 Table 39: France Industry Analysis and Outlook Value (US$ Million) Forecast by Product Type, 2019 to 2034 Table 40: France Industry Analysis and Outlook Volume (Units) Forecast by Product Type, 2019 to 2034 Table 41: Spain Industry Analysis and Outlook Value (US$ Million) Forecast By Region, 2019 to 2034 Table 42: Spain Industry Analysis and Outlook Volume (Units) Forecast By Region, 2019 to 2034 Table 43: Spain Industry Analysis and Outlook Value (US$ Million) Forecast by Material Type, 2019 to 2034 Table 44: Spain Industry Analysis and Outlook Volume (Units) Forecast by Material Type, 2019 to 2034 Table 45: Spain Industry Analysis and Outlook Value (US$ Million) Forecast by Packaging Type, 2019 to 2034 Table 46: Spain Industry Analysis and Outlook Volume (Units) Forecast by Packaging Type, 2019 to 2034 Table 47: Spain Industry Analysis and Outlook Value (US$ Million) Forecast by Product Type, 2019 to 2034 Table 48: Spain Industry Analysis and Outlook Volume (Units) Forecast by Product Type, 2019 to 2034 Table 49: Rest of Western Europe Industry Analysis and Outlook Value (US$ Million) Forecast by Material Type, 2019 to 2034 Table 50: Rest of Western Europe Industry Analysis and Outlook Volume (Units) Forecast by Material Type, 2019 to 2034 Table 51: Rest of Western Europe Industry Analysis and Outlook Value (US$ Million) Forecast by Packaging Type, 2019 to 2034 Table 52: Rest of Western Europe Industry Analysis and Outlook Volume (Units) Forecast by Packaging Type, 2019 to 2034 Table 53: Rest of Western Europe Industry Analysis and Outlook Value (US$ Million) Forecast by Product Type, 2019 to 2034 Table 54: Rest of Western Europe Industry Analysis and Outlook Volume (Units) Forecast by Product Type, 2019 to 2034
Figure 1: Western Europe Industry Analysis and Outlook Value (US$ Million) by Material Type, 2024 to 2034 Figure 2: Western Europe Industry Analysis and Outlook Value (US$ Million) by Packaging Type, 2024 to 2034 Figure 3: Western Europe Industry Analysis and Outlook Value (US$ Million) by Product Type, 2024 to 2034 Figure 4: Western Europe Industry Analysis and Outlook Value (US$ Million) by Country, 2024 to 2034 Figure 5: Western Europe Industry Analysis and Outlook Value (US$ Million) Analysis by Country, 2019 to 2034 Figure 6: Western Europe Industry Analysis and Outlook Volume (Units) Analysis by Country, 2019 to 2034 Figure 7: Western Europe Industry Analysis and Outlook Value Share (%) and BPS Analysis by Country, 2024 to 2034 Figure 8: Western Europe Industry Analysis and Outlook Y-o-Y Growth (%) Projections by Country, 2024 to 2034 Figure 9: Western Europe Industry Analysis and Outlook Value (US$ Million) Analysis by Material Type, 2019 to 2034 Figure 10: Western Europe Industry Analysis and Outlook Volume (Units) Analysis by Material Type, 2019 to 2034 Figure 11: Western Europe Industry Analysis and Outlook Value Share (%) and BPS Analysis by Material Type, 2024 to 2034 Figure 12: Western Europe Industry Analysis and Outlook Y-o-Y Growth (%) Projections by Material Type, 2024 to 2034 Figure 13: Western Europe Industry Analysis and Outlook Value (US$ Million) Analysis by Packaging Type, 2019 to 2034 Figure 14: Western Europe Industry Analysis and Outlook Volume (Units) Analysis by Packaging Type, 2019 to 2034 Figure 15: Western Europe Industry Analysis and Outlook Value Share (%) and BPS Analysis by Packaging Type, 2024 to 2034 Figure 16: Western Europe Industry Analysis and Outlook Y-o-Y Growth (%) Projections by Packaging Type, 2024 to 2034 Figure 17: Western Europe Industry Analysis and Outlook Value (US$ Million) Analysis by Product Type, 2019 to 2034 Figure 18: Western Europe Industry Analysis and Outlook Volume (Units) Analysis by Product Type, 2019 to 2034 Figure 19: Western Europe Industry Analysis and Outlook Value Share (%) and BPS Analysis by Product Type, 2024 to 2034 Figure 20: Western Europe Industry Analysis and Outlook Y-o-Y Growth (%) Projections by Product Type, 2024 to 2034 Figure 21: Western Europe Industry Analysis and Outlook Attractiveness by Material Type, 2024 to 2034 Figure 22: Western Europe Industry Analysis and Outlook Attractiveness by Packaging Type, 2024 to 2034 Figure 23: Western Europe Industry Analysis and Outlook Attractiveness by Product Type, 2024 to 2034 Figure 24: Western Europe Industry Analysis and Outlook Attractiveness by Region, 2024 to 2034 Figure 25: UK Industry Analysis and Outlook Value (US$ Million) by Material Type, 2024 to 2034 Figure 26: UK Industry Analysis and Outlook Value (US$ Million) by Packaging Type, 2024 to 2034 Figure 27: UK Industry Analysis and Outlook Value (US$ Million) by Product Type, 2024 to 2034 Figure 28: UK Industry Analysis and Outlook Value (US$ Million) By Region, 2024 to 2034 Figure 29: UK Industry Analysis and Outlook Value (US$ Million) Analysis By Region, 2019 to 2034 Figure 30: UK Industry Analysis and Outlook Volume (Units) Analysis By Region, 2019 to 2034 Figure 31: UK Industry Analysis and Outlook Value Share (%) and BPS Analysis By Region, 2024 to 2034 Figure 32: UK Industry Analysis and Outlook Y-o-Y Growth (%) Projections By Region, 2024 to 2034 Figure 33: UK Industry Analysis and Outlook Value (US$ Million) Analysis by Material Type, 2019 to 2034 Figure 34: UK Industry Analysis and Outlook Volume (Units) Analysis by Material Type, 2019 to 2034 Figure 35: UK Industry Analysis and Outlook Value Share (%) and BPS Analysis by Material Type, 2024 to 2034 Figure 36: UK Industry Analysis and Outlook Y-o-Y Growth (%) Projections by Material Type, 2024 to 2034 Figure 37: UK Industry Analysis and Outlook Value (US$ Million) Analysis by Packaging Type, 2019 to 2034 Figure 38: UK Industry Analysis and Outlook Volume (Units) Analysis by Packaging Type, 2019 to 2034 Figure 39: UK Industry Analysis and Outlook Value Share (%) and BPS Analysis by Packaging Type, 2024 to 2034 Figure 40: UK Industry Analysis and Outlook Y-o-Y Growth (%) Projections by Packaging Type, 2024 to 2034 Figure 41: UK Industry Analysis and Outlook Value (US$ Million) Analysis by Product Type, 2019 to 2034 Figure 42: UK Industry Analysis and Outlook Volume (Units) Analysis by Product Type, 2019 to 2034 Figure 43: UK Industry Analysis and Outlook Value Share (%) and BPS Analysis by Product Type, 2024 to 2034 Figure 44: UK Industry Analysis and Outlook Y-o-Y Growth (%) Projections by Product Type, 2024 to 2034 Figure 45: UK Industry Analysis and Outlook Attractiveness by Material Type, 2024 to 2034 Figure 46: UK Industry Analysis and Outlook Attractiveness by Packaging Type, 2024 to 2034 Figure 47: UK Industry Analysis and Outlook Attractiveness by Product Type, 2024 to 2034 Figure 48: UK Industry Analysis and Outlook Attractiveness By Region, 2024 to 2034 Figure 49: Germany Industry Analysis and Outlook Value (US$ Million) by Material Type, 2024 to 2034 Figure 50: Germany Industry Analysis and Outlook Value (US$ Million) by Packaging Type, 2024 to 2034 Figure 51: Germany Industry Analysis and Outlook Value (US$ Million) by Product Type, 2024 to 2034 Figure 52: Germany Industry Analysis and Outlook Value (US$ Million) By Region, 2024 to 2034 Figure 53: Germany Industry Analysis and Outlook Value (US$ Million) Analysis By Region, 2019 to 2034 Figure 54: Germany Industry Analysis and Outlook Volume (Units) Analysis By Region, 2019 to 2034 Figure 55: Germany Industry Analysis and Outlook Value Share (%) and BPS Analysis By Region, 2024 to 2034 Figure 56: Germany Industry Analysis and Outlook Y-o-Y Growth (%) Projections By Region, 2024 to 2034 Figure 57: Germany Industry Analysis and Outlook Value (US$ Million) Analysis by Material Type, 2019 to 2034 Figure 58: Germany Industry Analysis and Outlook Volume (Units) Analysis by Material Type, 2019 to 2034 Figure 59: Germany Industry Analysis and Outlook Value Share (%) and BPS Analysis by Material Type, 2024 to 2034 Figure 60: Germany Industry Analysis and Outlook Y-o-Y Growth (%) Projections by Material Type, 2024 to 2034 Figure 61: Germany Industry Analysis and Outlook Value (US$ Million) Analysis by Packaging Type, 2019 to 2034 Figure 62: Germany Industry Analysis and Outlook Volume (Units) Analysis by Packaging Type, 2019 to 2034 Figure 63: Germany Industry Analysis and Outlook Value Share (%) and BPS Analysis by Packaging Type, 2024 to 2034 Figure 64: Germany Industry Analysis and Outlook Y-o-Y Growth (%) Projections by Packaging Type, 2024 to 2034 Figure 65: Germany Industry Analysis and Outlook Value (US$ Million) Analysis by Product Type, 2019 to 2034 Figure 66: Germany Industry Analysis and Outlook Volume (Units) Analysis by Product Type, 2019 to 2034 Figure 67: Germany Industry Analysis and Outlook Value Share (%) and BPS Analysis by Product Type, 2024 to 2034 Figure 68: Germany Industry Analysis and Outlook Y-o-Y Growth (%) Projections by Product Type, 2024 to 2034 Figure 69: Germany Industry Analysis and Outlook Attractiveness by Material Type, 2024 to 2034 Figure 70: Germany Industry Analysis and Outlook Attractiveness by Packaging Type, 2024 to 2034 Figure 71: Germany Industry Analysis and Outlook Attractiveness by Product Type, 2024 to 2034 Figure 72: Germany Industry Analysis and Outlook Attractiveness By Region, 2024 to 2034 Figure 73: Italy Industry Analysis and Outlook Value (US$ Million) by Material Type, 2024 to 2034 Figure 74: Italy Industry Analysis and Outlook Value (US$ Million) by Packaging Type, 2024 to 2034 Figure 75: Italy Industry Analysis and Outlook Value (US$ Million) by Product Type, 2024 to 2034 Figure 76: Italy Industry Analysis and Outlook Value (US$ Million) By Region, 2024 to 2034 Figure 77: Italy Industry Analysis and Outlook Value (US$ Million) Analysis By Region, 2019 to 2034 Figure 78: Italy Industry Analysis and Outlook Volume (Units) Analysis By Region, 2019 to 2034 Figure 79: Italy Industry Analysis and Outlook Value Share (%) and BPS Analysis By Region, 2024 to 2034 Figure 80: Italy Industry Analysis and Outlook Y-o-Y Growth (%) Projections By Region, 2024 to 2034 Figure 81: Italy Industry Analysis and Outlook Value (US$ Million) Analysis by Material Type, 2019 to 2034 Figure 82: Italy Industry Analysis and Outlook Volume (Units) Analysis by Material Type, 2019 to 2034 Figure 83: Italy Industry Analysis and Outlook Value Share (%) and BPS Analysis by Material Type, 2024 to 2034 Figure 84: Italy Industry Analysis and Outlook Y-o-Y Growth (%) Projections by Material Type, 2024 to 2034 Figure 85: Italy Industry Analysis and Outlook Value (US$ Million) Analysis by Packaging Type, 2019 to 2034 Figure 86: Italy Industry Analysis and Outlook Volume (Units) Analysis by Packaging Type, 2019 to 2034 Figure 87: Italy Industry Analysis and Outlook Value Share (%) and BPS Analysis by Packaging Type, 2024 to 2034 Figure 88: Italy Industry Analysis and Outlook Y-o-Y Growth (%) Projections by Packaging Type, 2024 to 2034 Figure 89: Italy Industry Analysis and Outlook Value (US$ Million) Analysis by Product Type, 2019 to 2034 Figure 90: Italy Industry Analysis and Outlook Volume (Units) Analysis by Product Type, 2019 to 2034 Figure 91: Italy Industry Analysis and Outlook Value Share (%) and BPS Analysis by Product Type, 2024 to 2034 Figure 92: Italy Industry Analysis and Outlook Y-o-Y Growth (%) Projections by Product Type, 2024 to 2034 Figure 93: Italy Industry Analysis and Outlook Attractiveness by Material Type, 2024 to 2034 Figure 94: Italy Industry Analysis and Outlook Attractiveness by Packaging Type, 2024 to 2034 Figure 95: Italy Industry Analysis and Outlook Attractiveness by Product Type, 2024 to 2034 Figure 96: Italy Industry Analysis and Outlook Attractiveness By Region, 2024 to 2034 Figure 97: France Industry Analysis and Outlook Value (US$ Million) by Material Type, 2024 to 2034 Figure 98: France Industry Analysis and Outlook Value (US$ Million) by Packaging Type, 2024 to 2034 Figure 99: France Industry Analysis and Outlook Value (US$ Million) by Product Type, 2024 to 2034 Figure 100: France Industry Analysis and Outlook Value (US$ Million) By Region, 2024 to 2034 Figure 101: France Industry Analysis and Outlook Value (US$ Million) Analysis By Region, 2019 to 2034 Figure 102: France Industry Analysis and Outlook Volume (Units) Analysis By Region, 2019 to 2034 Figure 103: France Industry Analysis and Outlook Value Share (%) and BPS Analysis By Region, 2024 to 2034 Figure 104: France Industry Analysis and Outlook Y-o-Y Growth (%) Projections By Region, 2024 to 2034 Figure 105: France Industry Analysis and Outlook Value (US$ Million) Analysis by Material Type, 2019 to 2034 Figure 106: France Industry Analysis and Outlook Volume (Units) Analysis by Material Type, 2019 to 2034 Figure 107: France Industry Analysis and Outlook Value Share (%) and BPS Analysis by Material Type, 2024 to 2034 Figure 108: France Industry Analysis and Outlook Y-o-Y Growth (%) Projections by Material Type, 2024 to 2034 Figure 109: France Industry Analysis and Outlook Value (US$ Million) Analysis by Packaging Type, 2019 to 2034 Figure 110: France Industry Analysis and Outlook Volume (Units) Analysis by Packaging Type, 2019 to 2034 Figure 111: France Industry Analysis and Outlook Value Share (%) and BPS Analysis by Packaging Type, 2024 to 2034 Figure 112: France Industry Analysis and Outlook Y-o-Y Growth (%) Projections by Packaging Type, 2024 to 2034 Figure 113: France Industry Analysis and Outlook Value (US$ Million) Analysis by Product Type, 2019 to 2034 Figure 114: France Industry Analysis and Outlook Volume (Units) Analysis by Product Type, 2019 to 2034 Figure 115: France Industry Analysis and Outlook Value Share (%) and BPS Analysis by Product Type, 2024 to 2034 Figure 116: France Industry Analysis and Outlook Y-o-Y Growth (%) Projections by Product Type, 2024 to 2034 Figure 117: France Industry Analysis and Outlook Attractiveness by Material Type, 2024 to 2034 Figure 118: France Industry Analysis and Outlook Attractiveness by Packaging Type, 2024 to 2034 Figure 119: France Industry Analysis and Outlook Attractiveness by Product Type, 2024 to 2034 Figure 120: France Industry Analysis and Outlook Attractiveness By Region, 2024 to 2034 Figure 121: Spain Industry Analysis and Outlook Value (US$ Million) by Material Type, 2024 to 2034 Figure 122: Spain Industry Analysis and Outlook Value (US$ Million) by Packaging Type, 2024 to 2034 Figure 123: Spain Industry Analysis and Outlook Value (US$ Million) by Product Type, 2024 to 2034 Figure 124: Spain Industry Analysis and Outlook Value (US$ Million) By Region, 2024 to 2034 Figure 125: Spain Industry Analysis and Outlook Value (US$ Million) Analysis By Region, 2019 to 2034 Figure 126: Spain Industry Analysis and Outlook Volume (Units) Analysis By Region, 2019 to 2034 Figure 127: Spain Industry Analysis and Outlook Value Share (%) and BPS Analysis By Region, 2024 to 2034 Figure 128: Spain Industry Analysis and Outlook Y-o-Y Growth (%) Projections By Region, 2024 to 2034 Figure 129: Spain Industry Analysis and Outlook Value (US$ Million) Analysis by Material Type, 2019 to 2034 Figure 130: Spain Industry Analysis and Outlook Volume (Units) Analysis by Material Type, 2019 to 2034 Figure 131: Spain Industry Analysis and Outlook Value Share (%) and BPS Analysis by Material Type, 2024 to 2034 Figure 132: Spain Industry Analysis and Outlook Y-o-Y Growth (%) Projections by Material Type, 2024 to 2034 Figure 133: Spain Industry Analysis and Outlook Value (US$ Million) Analysis by Packaging Type, 2019 to 2034 Figure 134: Spain Industry Analysis and Outlook Volume (Units) Analysis by Packaging Type, 2019 to 2034 Figure 135: Spain Industry Analysis and Outlook Value Share (%) and BPS Analysis by Packaging Type, 2024 to 2034 Figure 136: Spain Industry Analysis and Outlook Y-o-Y Growth (%) Projections by Packaging Type, 2024 to 2034 Figure 137: Spain Industry Analysis and Outlook Value (US$ Million) Analysis by Product Type, 2019 to 2034 Figure 138: Spain Industry Analysis and Outlook Volume (Units) Analysis by Product Type, 2019 to 2034 Figure 139: Spain Industry Analysis and Outlook Value Share (%) and BPS Analysis by Product Type, 2024 to 2034 Figure 140: Spain Industry Analysis and Outlook Y-o-Y Growth (%) Projections by Product Type, 2024 to 2034 Figure 141: Spain Industry Analysis and Outlook Attractiveness by Material Type, 2024 to 2034 Figure 142: Spain Industry Analysis and Outlook Attractiveness by Packaging Type, 2024 to 2034 Figure 143: Spain Industry Analysis and Outlook Attractiveness by Product Type, 2024 to 2034 Figure 144: Spain Industry Analysis and Outlook Attractiveness By Region, 2024 to 2034 Figure 145: Rest of Western Europe Industry Analysis and Outlook Value (US$ Million) by Material Type, 2024 to 2034 Figure 146: Rest of Western Europe Industry Analysis and Outlook Value (US$ Million) by Packaging Type, 2024 to 2034 Figure 147: Rest of Western Europe Industry Analysis and Outlook Value (US$ Million) by Product Type, 2024 to 2034 Figure 148: Rest of Western Europe Industry Analysis and Outlook Value (US$ Million) Analysis by Material Type, 2019 to 2034 Figure 149: Rest of Western Europe Industry Analysis and Outlook Volume (Units) Analysis by Material Type, 2019 to 2034 Figure 150: Rest of Western Europe Industry Analysis and Outlook Value Share (%) and BPS Analysis by Material Type, 2024 to 2034 Figure 151: Rest of Western Europe Industry Analysis and Outlook Y-o-Y Growth (%) Projections by Material Type, 2024 to 2034 Figure 152: Rest of Western Europe Industry Analysis and Outlook Value (US$ Million) Analysis by Packaging Type, 2019 to 2034 Figure 153: Rest of Western Europe Industry Analysis and Outlook Volume (Units) Analysis by Packaging Type, 2019 to 2034 Figure 154: Rest of Western Europe Industry Analysis and Outlook Value Share (%) and BPS Analysis by Packaging Type, 2024 to 2034 Figure 155: Rest of Western Europe Industry Analysis and Outlook Y-o-Y Growth (%) Projections by Packaging Type, 2024 to 2034 Figure 156: Rest of Western Europe Industry Analysis and Outlook Value (US$ Million) Analysis by Product Type, 2019 to 2034 Figure 157: Rest of Western Europe Industry Analysis and Outlook Volume (Units) Analysis by Product Type, 2019 to 2034 Figure 158: Rest of Western Europe Industry Analysis and Outlook Value Share (%) and BPS Analysis by Product Type, 2024 to 2034 Figure 159: Rest of Western Europe Industry Analysis and Outlook Y-o-Y Growth (%) Projections by Product Type, 2024 to 2034 Figure 160: Rest of Western Europe Industry Analysis and Outlook Attractiveness by Material Type, 2024 to 2034 Figure 161: Rest of Western Europe Industry Analysis and Outlook Attractiveness by Packaging Type, 2024 to 2034 Figure 162: Rest of Western Europe Industry Analysis and Outlook Attractiveness by Product Type, 2024 to 2034
Recommendations
Explore Packaging Insights
View Reports