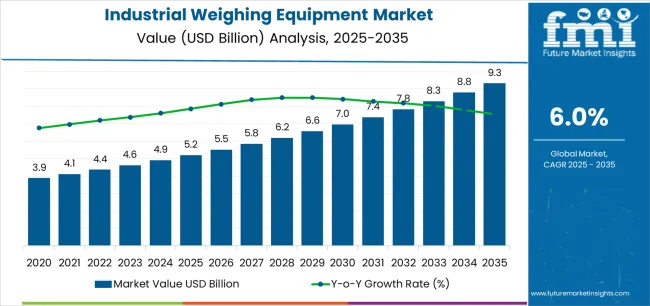
The global industrial weighing equipment market is valued at USD 5.2 billion in 2025. It is slated to reach USD 9.3 billion by 2035, recording an absolute increase of USD 4.1 billion over the forecast period. This translates into a total growth of 78.8%, with the market forecast to expand at a CAGR of 6.0% between 2025 and 2035. The overall market size is expected to grow by nearly 1.79X during the same period, supported by increasing factory automation and Industry 4.0 integration, growing adoption of IIoT-enabled weighing systems for real-time monitoring, expanding food safety and traceability compliance requirements, and rising emphasis on precision measurement and quality control across diverse industrial manufacturing, logistics, food & beverage, and process industry applications.
Between 2025 and 2030, the market is projected to expand from USD 5.2 billion to USD 7.0 billion, resulting in a value increase of USD 1.8 billion, which represents 43.9% of the total forecast growth for the decade. This phase of development will be shaped by increasing manufacturing automation and smart factory implementations, rising adoption of networked weighing systems with MES/SCADA integration, and growing demand for hygienic weighing solutions in pharmaceutical and food processing facilities. Industrial manufacturers and logistics operators are expanding their weighing equipment capabilities to address the growing demand for accurate, traceable, and connected measurement solutions that ensure quality control and regulatory compliance.
System integration challenges emerge when modern digital weighing platforms must interface with existing enterprise resource planning systems, manufacturing execution systems, and warehouse management software while maintaining real-time data accuracy across multiple operational platforms. Network connectivity complications arise when industrial facilities require continuous weighing data transmission while cybersecurity protocols limit external network access that could compromise sensitive production information. Engineering teams discover that theoretical load cell specifications frequently clash with harsh industrial environments where temperature fluctuations, vibrations, and electromagnetic interference affect measurement stability.
Installation coordination becomes complex when large-capacity weighing systems require specialized foundation work and vibration isolation while existing facility layouts cannot accommodate structural modifications without disrupting adjacent operations. Electrical infrastructure planning intensifies when high-resolution load cells and digital processing equipment demand clean power supplies and electromagnetic compatibility while industrial environments contain significant electrical noise sources. Facility planning teams navigate competing space requirements between weighing equipment accessibility for maintenance and operational efficiency for material flow patterns.
International standardization creates complications when multinational facilities must satisfy different legal metrology requirements across various countries while maintaining consistent operational procedures. Certification transferability becomes challenging when equipment approved in one jurisdiction requires additional testing for deployment in different regulatory environments while project timelines cannot accommodate redundant approval processes within this essential measurement technology market.
| Metric | Value |
|---|---|
| Estimated Value in (2025E) | USD 5.2 billion |
| Forecast Value in (2035F) | USD 9.3 billion |
| Forecast CAGR (2025 to 2035) | 6.0% |
From 2030 to 2035, the market is forecast to grow from USD 7.0 billion to USD 9.3 billion, adding another USD 2.3 billion, which constitutes 56.1% of the overall ten-year expansion. This period is expected to be characterized by the expansion of artificial intelligence-powered predictive maintenance and automated calibration, the development of edge computing and cloud-based analytics platforms for weighing data, and the growth of wireless sensor networks and battery-free weighing technologies for distributed operations. The growing adoption of digital twin integration and advanced data analytics will drive demand for industrial weighing equipment with enhanced connectivity and intelligent diagnostics features.
Between 2020 and 2025, the industrial weighing equipment market experienced steady growth, driven by increasing quality control requirements and growing recognition of precision weighing systems as essential technologies for ensuring product consistency and regulatory compliance in diverse manufacturing, packaging, logistics, and process control applications. The market developed as quality engineers and operations managers recognized the potential for advanced weighing technology to improve production efficiency, enable real-time process monitoring, and support traceability objectives while meeting stringent measurement accuracy requirements. Technological advancement in load cell design and digital connectivity began emphasizing the critical importance of maintaining measurement reliability and data integration in complex manufacturing environments.
Market expansion is being supported by the increasing global emphasis on quality assurance and process optimization driven by customer expectations and regulatory standards, alongside the corresponding need for intelligent weighing technologies that can enhance measurement accuracy, enable automated data capture, and maintain traceability across various manufacturing operations, packaging lines, logistics facilities, and bulk material handling applications. Modern facility managers and quality control professionals are increasingly focused on implementing weighing solutions that can provide real-time weight verification, reduce product giveaway, and deliver consistent measurement performance in demanding production environments.
The growing emphasis on food safety and pharmaceutical compliance is driving demand for industrial weighing equipment that can support hygienic design standards, enable audit-ready traceability, and ensure comprehensive documentation of measurement processes. Industrial operators' preference for weighing technologies that combine measurement precision with network connectivity and regulatory compliance capabilities is creating opportunities for innovative weighing equipment implementations. The rising influence of e-commerce fulfillment automation and smart logistics adoption is also contributing to increased deployment of industrial weighing equipment that can provide superior throughput without compromising measurement accuracy or integration flexibility.
The market is segmented by product type, end-use, type, capacity, and region. By product type, the market is divided into portable & bench scales (including compact bench scales, portable field scales, and hygienic bench IP-rated), floor scales, checkweighers, counting scales, weighbridge & truck scales, and rail scales. Based on end-use, the market is categorized into industrial (discrete & process) including discrete manufacturing and process industries, logistics & warehousing, food & beverages, chemicals, steel & metals, mining, construction materials, agriculture, and others. By type, the market includes digital weighing systems (networked/IIoT-enabled and stand-alone digital) and analog weighing systems. Based on capacity, the market comprises low capacity (≤300 kg), medium capacity (300 kg–30 t) including platform/floor, pallet scales, and in-process modules, and high capacity (>30 t). Regionally, the market is divided into Asia Pacific, North America, Europe, Latin America, and Middle East & Africa.
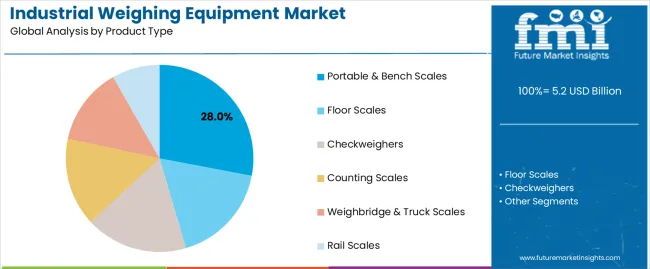
The portable & bench scales segment is projected to maintain its leading position in the industrial weighing equipment market in 2025 with a 28.0% market share, reaffirming its role as the preferred product category for quality control laboratories, production line workstations, and field measurement applications. Manufacturing facilities and quality control departments increasingly utilize portable & bench scales for their superior versatility characteristics, excellent space efficiency, and proven effectiveness in providing accurate measurement across diverse materials and production scenarios while maintaining portability and ease of use. Portable & bench scale technology's proven effectiveness and application versatility directly address the industrial requirements for flexible weighing solutions and quality verification across diverse manufacturing environments and inspection points.
This product segment forms the foundation of quality control operations, as it represents the technology with the broadest application range and established presence across multiple industrial sectors and measurement scenarios. Manufacturing investments in quality assurance infrastructure continue to strengthen adoption among producers and inspectors. With operational pressures requiring enhanced quality verification and improved process control, portable & bench scales align with both accuracy objectives and workflow requirements, making them the central component of comprehensive measurement strategies. Within the portable & bench scales segment, compact bench scales account for 44.0% of the subsegment, providing standard laboratory and production line weighing. Portable field scales represent 33.0%, offering mobility for in-situ measurement applications. Hygienic bench (IP-rated) scales hold 23.0%, serving cleanroom and washdown environments in pharmaceutical and food processing applications.
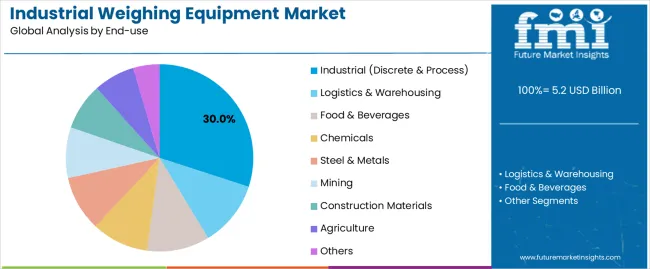
The industrial (discrete & process) end-use segment is projected to represent the largest share of industrial weighing equipment demand in 2025 with a 30.0% market share, underscoring its critical role as the primary driver for weighing equipment adoption across manufacturing facilities, assembly operations, and process control applications. Manufacturing operators prefer industrial weighing equipment for production control due to their exceptional measurement accuracy, process integration capabilities, and ability to support quality assurance protocols while ensuring production efficiency and regulatory compliance. Positioned as essential technologies for modern manufacturing operations, industrial weighing equipment offers both quality control advantages and operational efficiency benefits.
The segment is supported by continuous innovation in factory automation and the growing availability of IIoT-enabled weighing systems that enable superior data integration with enhanced connectivity and predictive maintenance capabilities. The manufacturing facilities are investing in comprehensive digitalization programs to support increasingly automated production processes and quality management requirements. As industrial automation advances and quality standards increase, the industrial application will continue to dominate the market while supporting advanced analytics utilization and process optimization strategies. Within the industrial segment, discrete manufacturing accounts for 54.0%, encompassing automotive, electronics, machinery, and fabricated products. Process industries represent 46.0%, including chemical processing, pharmaceuticals, plastics, and continuous manufacturing operations. Logistics & warehousing applications represent 18.0% of market demand, driven by warehouse management systems integration, shipping verification, and inventory control. Food & beverages account for 16.0%, supported by portion control, recipe formulation, and compliance with food safety regulations.
The industrial weighing equipment market is advancing steadily due to increasing demand for quality control and process optimization driven by customer expectations and growing adoption of factory automation technologies that require integrated weighing solutions providing enhanced measurement accuracy and data connectivity across diverse manufacturing, packaging, logistics, and process control applications. The market faces challenges, including high initial investment costs for advanced networked systems, calibration and maintenance requirements ensuring measurement accuracy, and competitive pressure from low-cost alternatives lacking precision and connectivity features. Innovation in wireless load cell technologies and AI-powered analytics continues to influence product development and market expansion patterns.
The growing e-commerce sector and automated warehouse development is driving demand for specialized weighing solutions that address critical operational requirements including high-speed dimensional weight scanning, automated sortation verification, and shipping compliance checking at unprecedented throughput rates. Logistics operators face increasing pressure to process growing parcel volumes while ensuring accurate weight capture for carrier billing, fraud prevention, and capacity planning. Warehouse automation integrators and third-party logistics providers are increasingly recognizing the essential role of integrated weighing technologies for maximizing fulfillment efficiency and ensuring billing accuracy, creating opportunities for high-speed conveyor scales and automated dimensional weighing systems specifically designed for e-commerce logistics applications.
Modern industrial weighing equipment manufacturers are incorporating Industrial Internet of Things connectivity and machine learning algorithms to enhance operational visibility, enable predictive maintenance, and support comprehensive asset management through real-time performance monitoring and anomaly detection. Leading companies are developing cloud-connected weighing platforms with automated calibration alerts, implementing edge analytics for process optimization, and advancing technologies that predict sensor drift and enable proactive maintenance interventions. These technologies improve operational reliability while enabling new value propositions, including performance benchmarking, utilization analytics, and prescriptive maintenance scheduling. Advanced IIoT integration also allows facility operators to support comprehensive operational excellence programs and total cost of ownership reduction beyond traditional reactive maintenance approaches.
The expansion of pharmaceutical manufacturing, food safety regulations, and cleanroom applications is driving demand for hygienic weighing equipment with IP-rated enclosures, washdown capabilities, and compliance documentation that meet stringent sanitation standards and regulatory validation requirements. These specialized hygienic scales incorporate stainless steel construction, sealed load cells, and smooth surfaces that facilitate cleaning and prevent contamination, creating premium market segments with differentiated compliance propositions. Manufacturers are investing in regulatory expertise and third-party certifications to serve demanding pharmaceutical and food processing applications while supporting GMP compliance and audit-ready documentation requirements.
| Country | CAGR (2025-2035) |
|---|---|
| India | 7.2% |
| China | 6.8% |
| United States | 5.6% |
| Brazil | 5.1% |
| Germany | 4.8% |
| United Kingdom | 4.5% |
| Japan | 4.2% |
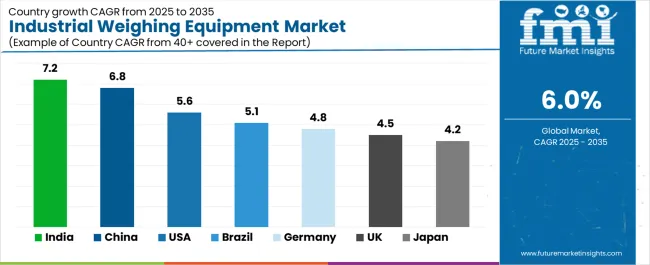
The industrial weighing equipment market is experiencing solid growth globally, with India leading at a 7.2% CAGR through 2035, driven by automotive and engineering capacity additions, compliance upgrades in packaged foods sector, and expanding manufacturing infrastructure. China follows at 6.8%, supported by factory automation initiatives, logistics hub development, and rapid digital retrofit of quality control systems across manufacturing sectors. The United States shows growth at 5.6%, emphasizing modernization in pharmaceutical and food industries alongside e-commerce fulfillment weighing automation. Brazil demonstrates 5.1% growth, supported by mining and agribulk handling operations and INMETRO-certified systems in processing plants. Germany records 4.8%, focusing on Industry 4.0 integration and precision weighing in chemicals and automotive manufacturing. The United Kingdom exhibits 4.5% growth, emphasizing retail-ready packaging and multihead/checkweigher adoption in food & beverage sectors. Japan shows 4.2% growth, supported by high-resolution sensors in electronics manufacturing and predictive maintenance implementations in factory operations.
The report covers an in-depth analysis of 40+ countries, Top-performing countries are highlighted below.
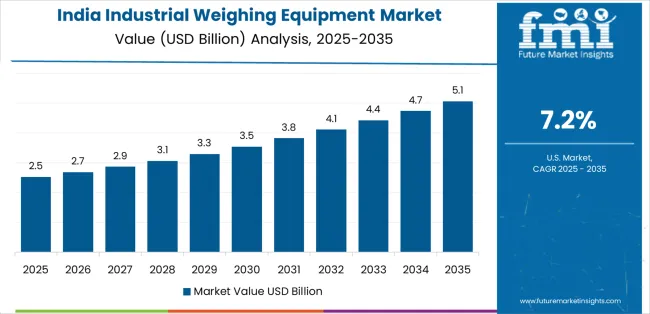
Revenue from industrial weighing equipment in India is projected to exhibit exceptional growth with a CAGR of 7.2% through 2035, driven by extensive automotive and engineering manufacturing capacity additions and rapidly expanding packaged foods compliance upgrades supported by government manufacturing promotion initiatives and food safety regulation enforcement. The country's massive industrial expansion and increasing quality control emphasis are creating substantial demand for industrial weighing equipment solutions. Major weighing equipment manufacturers and industrial automation suppliers are establishing comprehensive distribution and service capabilities to serve both manufacturing and food processing markets.
Revenue from industrial weighing equipment in China is expanding at a CAGR of 6.8%, supported by the country's comprehensive factory automation programs, extensive logistics hub development, and rapid digital retrofit of quality control systems driven by manufacturing competitiveness objectives and smart factory initiatives. The country's advanced manufacturing capabilities and technological sophistication are driving sophisticated weighing equipment capabilities throughout industrial and logistics sectors. Leading weighing equipment manufacturers and automation system integrators are establishing extensive production and service facilities to address growing domestic demand.
Revenue from industrial weighing equipment in the United States is expanding at a CAGR of 5.6%, supported by the country's extensive pharmaceutical and food industry modernization programs, accelerating e-commerce fulfillment weighing automation, and comprehensive quality management system upgrades. The nation's advanced regulatory environment and automation sophistication are driving demand for precision weighing equipment solutions. Industrial manufacturers and logistics operators are investing in weighing system upgrades and automation integration to serve both compliance and efficiency objectives.
Revenue from industrial weighing equipment in Brazil is growing at a CAGR of 5.1%, driven by the country's extensive mining and agribulk handling operations, comprehensive INMETRO-certified system requirements in processing plants, and industrial sector modernization supporting economic development. Brazil's resource-based economy and metrology standards are supporting investment in certified weighing technologies. Major industrial operations and processing facilities are establishing compliant weighing programs incorporating INMETRO-approved equipment.
Revenue from industrial weighing equipment in Germany is expanding at a CAGR of 4.8%, driven by the country's comprehensive Industry 4.0 manufacturing integration programs, precision weighing requirements in chemical and automotive industries, and advanced quality management systems supporting manufacturing excellence. Germany's engineering leadership and quality standards are driving sophisticated weighing equipment capabilities throughout manufacturing sectors. Leading weighing equipment manufacturers and automation companies are establishing comprehensive smart manufacturing programs incorporating next-generation weighing technologies.
Revenue from industrial weighing equipment in the United Kingdom is expanding at a CAGR of 4.5%, supported by the country's retail-ready packaging requirements, multihead and checkweigher adoption in food & beverage manufacturing, and comprehensive quality assurance programs supporting brand protection. The UK's food manufacturing sector and retail packaging standards are driving demand for specialized weighing technologies. Food processors and packaging operations are investing in automated weighing systems addressing accuracy and throughput requirements.
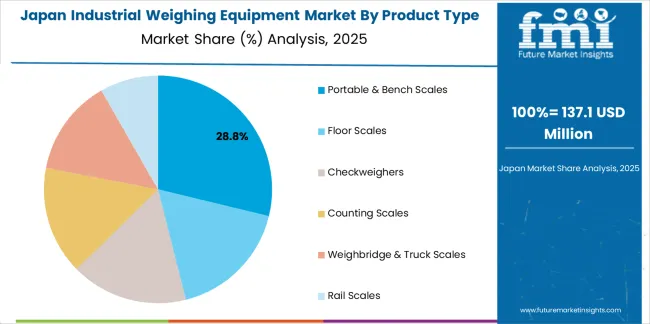
Revenue from industrial weighing equipment in Japan is expanding at a CAGR of 4.2%, supported by the country's high-resolution sensor applications in electronics manufacturing, predictive maintenance implementations in factory operations, and precision quality control requirements supporting manufacturing excellence. Japan's technological sophistication and quality consciousness are driving demand for advanced weighing equipment. Leading manufacturers and electronics producers are investing in precision weighing technologies addressing miniaturization and quality requirements.
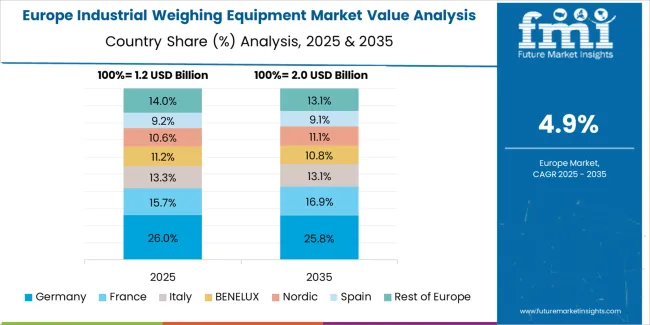
The industrial weighing equipment market in Europe is projected to grow from USD 1.5 billion in 2025 to USD 2.5 billion by 2035, registering a CAGR of approximately 5.3% over the forecast period. Germany is expected to lead with a 23.0% market share in 2025, maintaining approximately 23.0% through 2035, supported by Industry 4.0 integration, precision weighing in chemicals and automotive sectors, and advanced manufacturing quality standards.
The United Kingdom holds 14.0% in 2025, driven by retail-ready packaging requirements, food & beverage checkweigher adoption, and comprehensive quality assurance programs. France accounts for 12.0%, supported by food processing modernization and pharmaceutical manufacturing expansion. Italy stands at 11.0%, driven by food manufacturing, packaging machinery integration, and fashion/textile applications. Spain represents 8.0%, supported by food processing and logistics sector growth. Nordics account for 7.0%, reflecting advanced automation adoption and quality control standards. Benelux holds 6.0%, driven by logistics hub operations and chemical industry requirements. The Rest of Europe collectively represents 19.0%, reflecting steady adoption across Central and Eastern European manufacturing facilities, food processing plants, and logistics operations with growing emphasis on IIoT-enabled scales, OPC UA integration, and edge gateway connectivity supporting brownfield plant digitalization and third-party logistics site automation across the broader European manufacturing and distribution landscape.
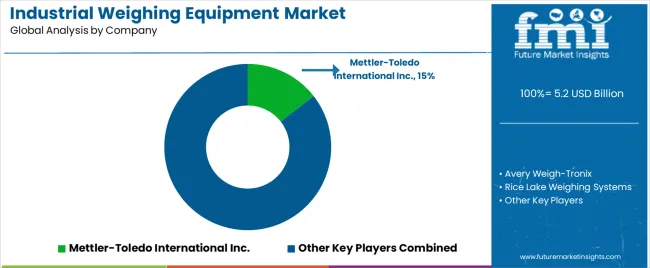
The Industrial Weighing Equipment Market is growing as manufacturing, logistics, agriculture, mining, food processing, and chemical industries rely on precise weight measurement to maintain quality control, support regulatory compliance, and improve process efficiency. Weighing systems are increasingly being integrated with automation platforms, conveying systems, and data monitoring software to enable real-time production insights and inventory traceability. Expansion of smart factories and digital supply chains is encouraging adoption of connected scales, load cells, and weighbridges with networked data outputs.
Mettler-Toledo International Inc. and Avery Weigh-Tronix are leading suppliers with broad portfolios covering floor scales, bench scales, truck weighbridges, and automated inline weighing systems. Their solutions are widely used in high-volume production and logistics operations. Rice Lake Weighing Systems and Minebea Intec provide precision weighing and batching systems tailored for food, pharmaceutical, and specialty chemical processing environments.
Adam Equipment, A&D Company, Limited, Sartorius AG, and Shimadzu Corporation are prominent in laboratory and high-accuracy industrial applications, offering digital scales and analytical measurement systems designed for stringent calibration requirements. Fairbanks Scales Inc. and Bilanciai Group maintain strong positions in transport and freight operations with durable weighbridges and heavy-duty industrial scales. As automation and data-driven production continue to expand, industrial weighing equipment is evolving toward connected, software-assisted systems that support higher accuracy, reliability, and operational transparency.
Industrial weighing equipment represents a critical measurement technology segment within manufacturing, logistics, food processing, and bulk material handling applications, projected to grow from USD 5.2 billion in 2025 to USD 9.3 billion by 2035 at a 6.0% CAGR. These precision measurement systems—encompassing portable, floor-mounted, and integrated configurations for diverse capacity ranges—serve as essential quality control technologies in production verification, inventory management, packaging control, and custody transfer where measurement accuracy, data traceability, and regulatory compliance are essential. Market expansion is driven by increasing factory automation and Industry 4.0 initiatives, growing food safety and pharmaceutical compliance requirements, expanding e-commerce fulfillment automation, and rising demand for IIoT-enabled measurement systems across diverse industrial and commercial sectors.
How Metrology Regulators Could Strengthen Measurement Standards and Legal Requirements?
How Industry Associations Could Advance Application Standards and Technical Guidance?
How Industrial Weighing Equipment Manufacturers Could Drive Innovation and Market Leadership?
How Industrial Operators Could Optimize Weighing Performance and Compliance?
How Research Institutions Could Enable Technology Advancement?
How Investors and Financial Enablers Could Support Market Growth and Innovation?
| Items | Values |
|---|---|
| Quantitative Units (2025) | USD 5.2 billion |
| Product Type | Portable & Bench Scales (Compact Bench Scales, Portable Field Scales, Hygienic Bench IP-rated), Floor Scales, Checkweighers, Counting Scales, Weighbridge & Truck Scales, Rail Scales |
| End-use | Industrial (Discrete & Process) including Discrete Manufacturing and Process Industries, Logistics & Warehousing, Food & Beverages, Chemicals, Steel & Metals, Mining, Construction Materials, Agriculture, Others |
| Type | Digital Weighing Systems (Networked/IIoT-enabled, Stand-alone Digital), Analog Weighing Systems |
| Capacity | Low Capacity (≤300 kg), Medium Capacity (300 kg–30 t) including Platform/Floor, Pallet Scales, and In-process Modules, High Capacity (>30 t) |
| Regions Covered | Asia Pacific, North America, Europe, Latin America, Middle East & Africa |
| Countries Covered | India, China, United States, Brazil, Germany, United Kingdom, Japan, and 40+ countries |
| Key Companies Profiled | Mettler-Toledo International Inc., Avery Weigh-Tronix, Rice Lake Weighing Systems, Minebea Intec, Adam Equipment, A&D Company, Limited, Sartorius AG, Shimadzu Corporation, Fairbanks Scales Inc., and Bilanciai Group |
| Additional Attributes | Dollar sales by product type, end-use category, type, and capacity segments, regional demand trends, competitive landscape, technological advancements in IIoT connectivity, hygienic design, predictive analytics, and software integration |
The global industrial weighing equipment market is estimated to be valued at USD 5.2 billion in 2025.
The market size for the industrial weighing equipment market is projected to reach USD 9.3 billion by 2035.
The industrial weighing equipment market is expected to grow at a 6.0% CAGR between 2025 and 2035.
The key product types in industrial weighing equipment market are portable & bench scales , floor scales, checkweighers, counting scales, weighbridge & truck scales and rail scales.
In terms of end-use, industrial (discrete & process) segment to command 30.0% share in the industrial weighing equipment market in 2025.


Our Research Products

The "Full Research Suite" delivers actionable market intel, deep dives on markets or technologies, so clients act faster, cut risk, and unlock growth.

The Leaderboard benchmarks and ranks top vendors, classifying them as Established Leaders, Leading Challengers, or Disruptors & Challengers.

Locates where complements amplify value and substitutes erode it, forecasting net impact by horizon

We deliver granular, decision-grade intel: market sizing, 5-year forecasts, pricing, adoption, usage, revenue, and operational KPIs—plus competitor tracking, regulation, and value chains—across 60 countries broadly.

Spot the shifts before they hit your P&L. We track inflection points, adoption curves, pricing moves, and ecosystem plays to show where demand is heading, why it is changing, and what to do next across high-growth markets and disruptive tech

Real-time reads of user behavior. We track shifting priorities, perceptions of today’s and next-gen services, and provider experience, then pace how fast tech moves from trial to adoption, blending buyer, consumer, and channel inputs with social signals (#WhySwitch, #UX).

Partner with our analyst team to build a custom report designed around your business priorities. From analysing market trends to assessing competitors or crafting bespoke datasets, we tailor insights to your needs.
Supplier Intelligence
Discovery & Profiling
Capacity & Footprint
Performance & Risk
Compliance & Governance
Commercial Readiness
Who Supplies Whom
Scorecards & Shortlists
Playbooks & Docs
Category Intelligence
Definition & Scope
Demand & Use Cases
Cost Drivers
Market Structure
Supply Chain Map
Trade & Policy
Operating Norms
Deliverables
Buyer Intelligence
Account Basics
Spend & Scope
Procurement Model
Vendor Requirements
Terms & Policies
Entry Strategy
Pain Points & Triggers
Outputs
Pricing Analysis
Benchmarks
Trends
Should-Cost
Indexation
Landed Cost
Commercial Terms
Deliverables
Brand Analysis
Positioning & Value Prop
Share & Presence
Customer Evidence
Go-to-Market
Digital & Reputation
Compliance & Trust
KPIs & Gaps
Outputs
Full Research Suite comprises of:
Market outlook & trends analysis
Interviews & case studies
Strategic recommendations
Vendor profiles & capabilities analysis
5-year forecasts
8 regions and 60+ country-level data splits
Market segment data splits
12 months of continuous data updates
DELIVERED AS:
PDF EXCEL ONLINE
Industrial Marking Equipment Market Growth - Trends & Forecast 2025 to 2035
Check Weighing Equipment Market Size and Share Forecast Outlook 2025 to 2035
Beryllium Copper for Industrial Equipment Market Size and Share Forecast Outlook 2025 to 2035
Industrial Grade Electrochemical CO Sensor Market Size and Share Forecast Outlook 2025 to 2035
Industrial Bench Scale Market Size and Share Forecast Outlook 2025 to 2035
Industrial Low Profile Floor Scale Market Size and Share Forecast Outlook 2025 to 2035
Industrial Sand Mill Market Size and Share Forecast Outlook 2025 to 2035
Industrial Control Network Modules Market Size and Share Forecast Outlook 2025 to 2035
Industrial Precision Oven Market Size and Share Forecast Outlook 2025 to 2035
Industrial Water Chiller for PCB Market Size and Share Forecast Outlook 2025 to 2035
Industrial & Commercial HVLS Fans Market Size and Share Forecast Outlook 2025 to 2035
Industrial Robot Controller Market Size and Share Forecast Outlook 2025 to 2035
Industrial Wired Routers Market Size and Share Forecast Outlook 2025 to 2035
Industrial Evaporative Condensers Market Size and Share Forecast Outlook 2025 to 2035
Industrial Energy Management System Market Size and Share Forecast Outlook 2025 to 2035
Industrial Insulation Market Size and Share Forecast Outlook 2025 to 2035
Industrial Safety Gloves Market Size and Share Forecast Outlook 2025 to 2035
Industrial Cleaner Market Size and Share Forecast Outlook 2025 to 2035
Industrial Dust Treatment System Market Size and Share Forecast Outlook 2025 to 2035
Industrial Vertical Washing Tower Market Size and Share Forecast Outlook 2025 to 2035

Thank you!
You will receive an email from our Business Development Manager. Please be sure to check your SPAM/JUNK folder too.
Chat With
MaRIA