The global industrial chocolate market is projected to grow from USD 63.8 billion in 2025 to USD 99.6 billion by 2035, registering a CAGR of 4.7% during the forecast period. Cocoa butter is set to dominate the product segment with a 42.3% market share in 2025, while bakery applications will lead with a commanding 56.6% share across usage categories.
Rising demand for premium, organic, and ethically sourced chocolate ingredients across the food and beverage sector continues to fuel industry expansion. Industrial chocolate, serving as a base ingredient in a variety of end-products from bakery and confectionery to dairy and beverages is increasingly sought after due to its functional versatility and broad appeal.
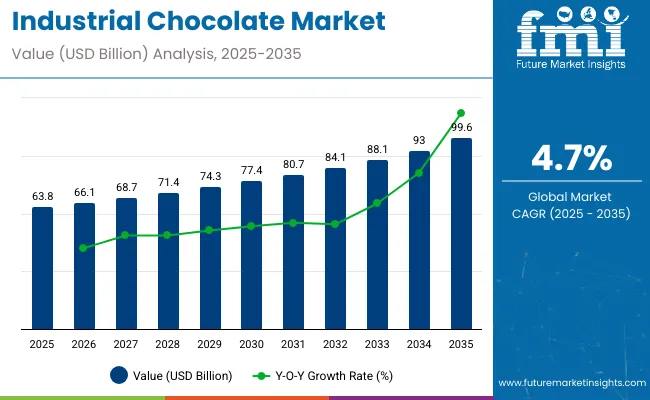
| Metric | Value |
|---|---|
| Industry Size (2025E) | USD 63.8 billion |
| Industry Value (2035F) | USD 99.6 billion |
| CAGR (2025 to 2035) | 4.7% |
Chocolate consumption is witnessing a transition toward specialty, single-origin, and bean-to-bar formulations. This is being accelerated by small and mid-sized enterprises aiming to carve a niche with artisanal, high-cocoa content offerings. Alongside this, multinational players are investing in R&D to reduce sugar content and introduce healthier variants without compromising taste or texture.
Technological advances in chocolate processing-including heat-resistance, dairy-free innovation, and precision formulation-are shaping market strategies. Ethical sourcing and traceability, especially through certifications like Fair Trade and Rainforest Alliance, are becoming non-negotiables for industry leaders focused on sustainability goals.
Growth is not uniform across regions. While North America and Europe remain high-volume markets driven by indulgent consumption, the Asia Pacific region is expanding at a faster clip, spurred by urbanization, growing disposable incomes, and evolving food habits. Quick-service restaurants and premium dessert retail chains in countries like China and South Korea are rapidly scaling up demand.
As clean-label and plant-based ingredients continue to trend upward, industrial chocolate suppliers are exploring cocoa-free substitutes and lab-fermented options to mitigate raw material volatility and meet climate-conscious procurement targets. Manufacturers are also optimizing operations using AI and automation to increase throughput while controlling production costs.
The sector is expected to benefit from the fusion of indulgence and functionality in the coming decade, with consumer expectations tilting toward guilt-free pleasure and added health benefits signaling a strong, innovation-led growth outlook through 2035.
Per capita consumption of industrial chocolate varies by region and is closely tied to the maturity of the confectionery, bakery, and dairy sectors. Unlike retail chocolate, industrial chocolate is used as a raw material by food manufacturers and processors, making its consumption a reflection of industry demand rather than direct consumer purchases.
Labeling certifications in the industrial chocolate market ensure compliance with food safety, sustainability, and ethical sourcing standards. These certifications help chocolate suppliers and food manufacturers meet legal requirements and gain trust with end consumers in sectors like confectionery, bakery, and dairy.
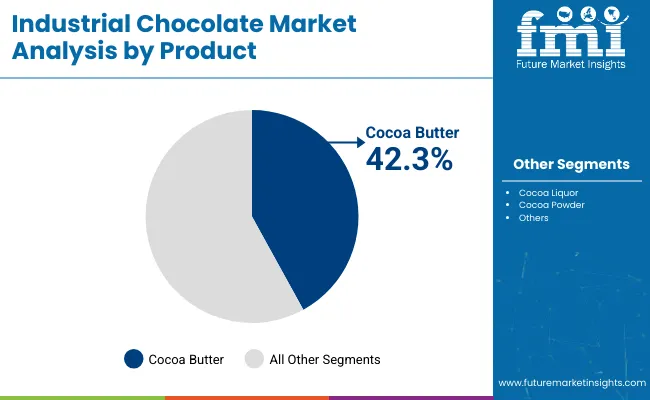
| Segment | Value Share (2025) |
|---|---|
| Cocoa Butter (Product) | 42.3% |
Cocoa butter holds the dominant share, accounting for 42.3% in 2025, followed by cocoa liquor, which has a share of 35.0%. Cocoa butter leads this segment due to its greater end-use applications in chocolate, bakery products, confectionery, and cosmetics.
Leading chocolate manufacturers and high brands such as Barry Callebaut, Cargill Cocoa & Chocolate, and Olam Cocoa depend on high-quality cocoa butter to develop the texture and mouthfeel of their chocolate products.
This has subsequently increased the demand for cocoa butter since there has been an increase in premium chocolates that require a higher content of cocoa butter for a smoother texture. The growing application of cocoa butter in personal care and cosmetics, due to its moisturizing properties, is further increasing its industry share.
Cocoa liquors account for 35% of the share solidified by its capability of being the base ingredient for dark, milk, and white chocolate. Companies such as The Hershey Company, Mars, and Lindt & Sprüngli use high-class cocoa liquors so that their chocolates have a rich flavor and consistently rich mouthfeel.
The increased consumption of dark chocolate, which contains a higher percentage of cocoa liquor, is due to increased public awareness of its health benefits, such as its antioxidant content and potential cardiovascular benefits. Further developments in this segment have been recorded due to the rise of demand for artisanal and bean-to-bar chocolate brands, such as Divine Chocolate and TCHO.
With the increasing concentration of premium and functional chocolate products, the global chocolate industry is going through a process of change. Cocoa butter will, however, continue to be dominant, while cocoa liquor will have a steady demand growth, particularly with respect to dark chocolate and specialty chocolate categories.
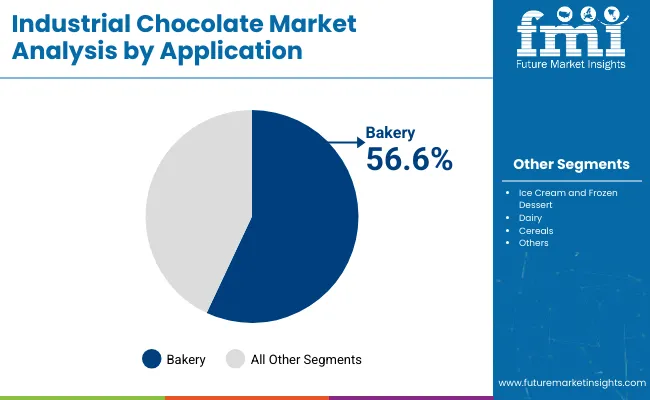
| Segment | Value Share (2025) |
|---|---|
| Bakery (Application) | 56.6% |
The bakery segment holds the dominant share in the industrial chocolate market, accounting for 56.6% in 2025, followed by ice cream and frozen dessert applications, which have 18%.
The bakery sector holds the leading position in view of the extensive usage of industrial chocolate in cakes, pastries, cookies, and brownies. Mondelez International, Grupo Bimbo, and General Mills incorporate industrial chocolate in bakery products for flavor, texture, and aesthetic appeal.
The increasing demand for premium and artisanal baked products, especially in urban areas, has supported the additional consumption of chocolates in this segment. The growing trend for home baking facilitated by social media and the rising interest in homemade goodies have also cumulated in increased demand for industrial chocolate as a core ingredient.
The ice cream and frozen dessert segment commands a substantial share of 18%, with an opportunity specifically in the growing consumer preference for chocolate flavors and coatings. Major brands like Unilever (Magnum, Ben & Jerry's), Nestlé, and Häagen-Dazs use cocoa butter and cocoa liquor in indulgently chocolate-coated ice creams, chocolate swirls, or mix-ins.
The growing popularity of premium, plant-based frozen desserts with high-quality dark chocolate has also gone some way toward stimulating the very growth of the segment. Furthermore, innovation in dairy-free and functional ice creams has led to added demand for chocolate inclusions.
With the increasing global demand for chocolate-based bakery and frozen products keeping the bakery sector at its helm for some time, ice cream and frozen desserts will also see a steady rise alongside that with increasing innovations in products.
Consumer demand is constantly changing. Companies are coming up with innovative formulations of chocolate and focusing on sustainable sourcing. A higher demand is seen for premium and specialty chocolates because consumers seek high-quality, distinctive flavor profiles. Consumption of plant-based milk and functionally nutritious food is increasing, which expands the industry further.
Technological advancements in chocolate production, such as low-sugar, dairy-free, and heat-resistant varieties, are surfacing product differentiators. Industry players are heavily investing in R&D activities to enhance texture, flavor resilience, and nutritional content. Processing chocolate with automation and AI enhances productivity while ensuring high-quality standards, introducing higher levels of production capacity, and lowering costs.
Sustainability is a key purchasing factor throughout the value chain. Chocolate companies are focusing on ethically produced cocoa, carbon-neutral manufacturing, and clean-label products to meet consumer demands.
Consequently, end-use segments, including bakery, dairy, and confectionery, are capitalizing on these new trends by resulting in extensive usage of innovative and sustainably sourced chocolate ingredients.
The manufacturing sector faces a lot of challenges that threaten to undermine the long-term growth potential of the cocoa industry. Cocoa price volatility remains one of the most dangerous threats since unstable supply situations, geopolitical tensions between cocoa-producing nations and the rest of the world, and global warming drive raw material prices.
There is a dependence on cocoa cultivation, which makes the industry vulnerable to economic and environmental shocks, leading to unexpected price swings that might test manufacturers' margins.
Environmental and regulatory issues are another issue for industry participants. Tighter regulations on food safety, labeling standards, and green production codes are forcing firms to implement traceability systems, ethical supply schemes, and eco-friendly production processes.
Although such moves improve the image of a company, they come with additional costs on compliance measures that are an expense burden to smaller players.
Changes in consumer preferences for healthier options, such as sugar-free, plant-based, and functional chocolates, are also reforming industry forces. Innovating and keeping pace with developing dietary trends are essentials for those who do not innovate and risk being rendered useless in the marketplace.
The constant necessity of investment in research and development to remain competitive with changing health-conscious requirements without losing product attractiveness is a high-wire balancing act for companies that seek to be successful over the long term.
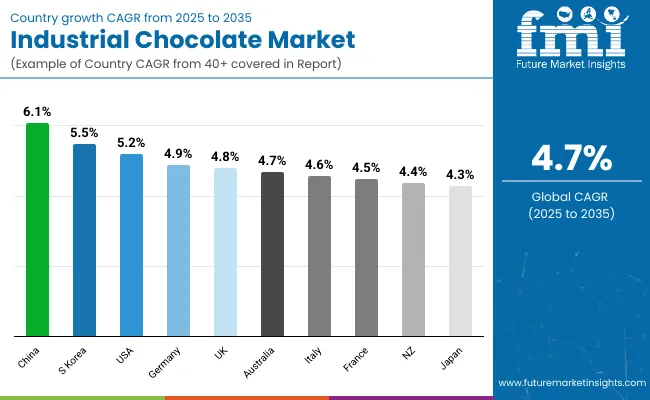
| Countries | CAGR (2025 to 2035) |
|---|---|
| USA | 5.2% |
| UK | 4.8% |
| France | 4.5% |
| Germany | 4.9% |
| Italy | 4.6% |
| South Korea | 5.5% |
| Japan | 4.3% |
| China | 6.1% |
| Australia | 4.7% |
| New Zealand | 4.4% |
The USA industrial chocolate industry will be recording a CAGR of 5.2% from 2025 to 2035. As a country known for being one of the highest-consuming nations of chocolate, it is well-developed in its confectionery space with good penetration of international and local chocolate companies.
Increased demand for premium and organic chocolates and advances in plant-based and sugar-free versions are propelling the industry. The increasing popularity of artisanal chocolate and sustainably produced cocoa is also influencing industry trends even more.
The UK will expand at a rate of 4.8% CAGR during the forecast period. The country has a rich consumption and production history of chocolate, and demand is rising for chocolate produced ethically and sustainably. Dark and high-cocoa-content chocolate is gaining traction due to health concerns.
E-commerce channel growth and high retail penetration are the major drivers for growth. Further, increasing demand for luxury and personalized chocolates is driving industry growth.
France's chocolate industrial market will grow at 4.5% CAGR from 2025 to 2035. France boasts a sophisticated chocolate culture, and gourmet chocolates and handcrafted chocolates are significant parts of it.
Enhanced consumer awareness about the quality and origin of cocoa is fueling premium chocolates and fair-trade chocolate growth. Convenient access to popular chocolatiers and patisseries and increasing demand for organic chocolates are making the industry stronger.
Germany's industrial chocolate industry is also expected to grow at a CAGR of 4.9% during the forecast period. Germany, Europe's second-largest chocolate producer, boasts a large, well-established chocolate industry and robust exportation activities.
Growing demand for sugar-free and functional chocolates is driving product innovation. Moreover, rising private-label demand for chocolates in supermarkets and hypermarkets is contributing to growth.
Italy's industrial chocolate sector is anticipated to grow at a CAGR of 4.6% from 2025 to 2035. Italian chocolate tradition is significantly founded on hand craftsmanship and superior products. Fine and bean-to-bar chocolates are increasing with an emphasis on special flavor profiles.
Development of the tourism sector and growing demand for chocolate confectionery products are driving the growth. Additionally, the priority placed on superior-quality cocoa by Italian chocolatiers' products is cementing industry growth.
South Korea's chocolate industry will capture a CAGR growth of 5.5% over the forecast period. The growing influence of the Western world on food consumption culture in South Korea and the growing demand for premium chocolates are the key factors driving sales expansion.
Demand for South Korean chocolate snacks and dessert products has increased manifold, and locally created chocolate brands have released exotic flavors. The rising foreign chocolate brand presence in the domestic retail sector is also fueling sales growth.
Japan is forecasted to increase at a CAGR of 4.3% between 2025 and 2035. Japanese consumers enjoy premium-quality, carefully manufactured chocolates, sometimes featuring unusual pairings like matcha, yuzu, and sake-flavored chocolates.
The strong gift-giving culture of Japan contributes significantly towards the growth of demand, particularly on celebrations like Valentine's Day and White Day. There is also a rise in demand for functional chocolate with health-promoting benefits.
China is expected to grow at the maximum CAGR of 6.1% between 2025 to 2035. Urbanization, an emerging middle class, and increasing disposable incomes are fueling the consumption of chocolates. The demand for imported and premium chocolates has seen exponential growth, especially in urban areas.
Online stores are also making significant contributions towards growth, with greater consumer access to numerous chocolate products. Increased attention to ethical sourcing and sustainable cocoa growing is also impacting buying decisions.
The Australian industrial chocolate industry is anticipated to grow at a CAGR of 4.7% over the next decade. Demand for healthier versions of chocolate, including organic and sugar-free, is the major growth driver. Premiumization is evident, with a high demand for sustainably sourced craft chocolates. Supermarket chain and specialty boutique growth for chocolate is also driving growth.
New Zealand's industrial chocolate industry is expected to grow at a CAGR of 4.4% between 2025 and 2035. Premium and ethically sourced chocolates are increasingly in demand. Locally produced ingredients and new flavor combinations are making consumers sit up and take notice.
Boutique chocolatiers and artisanal chocolate makers are working on smaller levels, which is giving rise to premium products at lower costs. Growing demand for dairy-free and plant-based chocolate is revolutionizing the game of the industry.
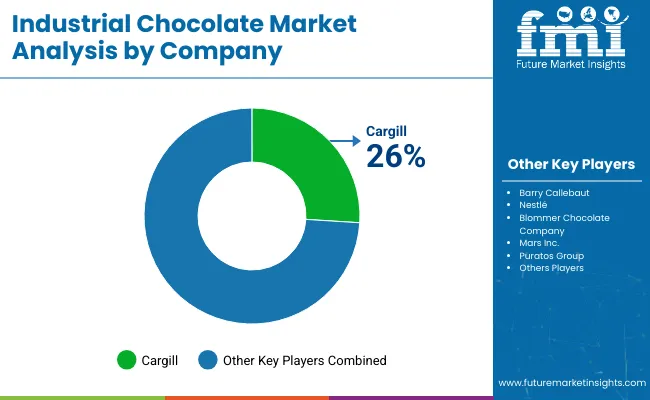
The global industrial chocolate market is shaped by a mix of multinational giants, specialized cocoa processors, and emerging artisanal players. Tier-1 companies dominate through vertically integrated supply chains, strong R&D investments, and long-standing partnerships with major bakery, dairy, and confectionery brands. Sustainability and innovation remain key competitive differentiators.
Blommer Chocolate Company continues to dominate North America’s industrial supply chain with specialty couverture chocolates and private-label manufacturing. Mars Inc., a major global player, is actively investing in reduced-sugar and plant-based chocolate solutions tailored for B2B applications.
The market also includes several Tier-2 players like Puratos Group, Olam Food Ingredients, and Fuji Oil, which specialize in regional distribution, niche ingredient blending, and flavor innovation. M&A activity is robust, with large companies acquiring small premium chocolatiers to diversify portfolios and gain access to emerging health-focused or ethical consumer segments.
Recent advances in processing technology-such as precision fermentation for cocoa alternatives and AI-led recipe customization-are expected to further intensify competition. As companies shift toward plant-based, functional, and traceable chocolate solutions, agility in product development and ethical value chains will define leadership across the decade.
This segment is further categorized into Cocoa Butter, Cocoa Liquor, and Cocoa Powder.
This segment is further categorized into Bakery, Ice Cream and Frozen Dessert, Dairy, Cereals, and Others.
This segment is further categorized into Confectionery, Cocoa, and Other Products.
The industry is analyzed across North America, Latin America, Western Europe, Eastern Europe, South Asia & Pacific, East Asia, Central Asia, Balkan and Baltic Countries, Russia and Belarus, and The Middle East & Africa.
The industry is expected to reach USD 63.8 billion in 2025.
The market is projected to grow to USD 99.6 billion by 2035.
China is expected to experience significant growth, with a CAGR of 6.1% during the forecast period.
The Cocoa Butter segment is one of the most popular categories in the market.
Leading companies include Barry Callebaut, Cargill, Nestlé, Blommer Chocolate Company, Mars Inc., Puratos Group, Mondelez International, The Hershey Company, Fuji Oil Holdings Inc., and Olam Food Ingredients.


Full Research Suite comprises of:
Market outlook & trends analysis
Interviews & case studies
Strategic recommendations
Vendor profiles & capabilities analysis
5-year forecasts
8 regions and 60+ country-level data splits
Market segment data splits
12 months of continuous data updates
DELIVERED AS:
PDF EXCEL ONLINE
Demand for Industrial Chocolate in EU Size and Share Forecast Outlook 2025 to 2035
Industrial Evaporative Condensers Market Size and Share Forecast Outlook 2025 to 2035
Industrial Energy Management System Market Size and Share Forecast Outlook 2025 to 2035
Industrial Insulation Market Size and Share Forecast Outlook 2025 to 2035
Industrial Safety Gloves Market Size and Share Forecast Outlook 2025 to 2035
Industrial Cleaner Market Size and Share Forecast Outlook 2025 to 2035
Industrial Dust Treatment System Market Size and Share Forecast Outlook 2025 to 2035
Industrial Vertical Washing Tower Market Size and Share Forecast Outlook 2025 to 2035
Industrial Pepper Market Size and Share Forecast Outlook 2025 to 2035
Industrial Electronics Packaging Market Forecast and Outlook 2025 to 2035
Industrial Absorbent Market Forecast and Outlook 2025 to 2035
Industrial Furnace Industry Analysis in Europe Forecast and Outlook 2025 to 2035
Industrial Denox System Market Size and Share Forecast Outlook 2025 to 2035
Industrial Electronic Pressure Switch Market Size and Share Forecast Outlook 2025 to 2035
Industrial WiFi Module Market Size and Share Forecast Outlook 2025 to 2035
Industrial Security System Market Forecast Outlook 2025 to 2035
Industrial Film Market Forecast Outlook 2025 to 2035
Industrial Floor Mat Market Forecast Outlook 2025 to 2035
Industrial Process Water Coolers Market Forecast and Outlook 2025 to 2035
Industrial Grade Ammonium Hydrogen Fluoride Market Forecast and Outlook 2025 to 2035

Thank you!
You will receive an email from our Business Development Manager. Please be sure to check your SPAM/JUNK folder too.
Chat With
MaRIA