The chocolate flavors market is estimated to be worth USD 450.7 million by 2025. It is anticipated to reach USD 727.1 million by 2035, reflecting a CAGR of 4.9% over the assessment period 2025 to 2035.
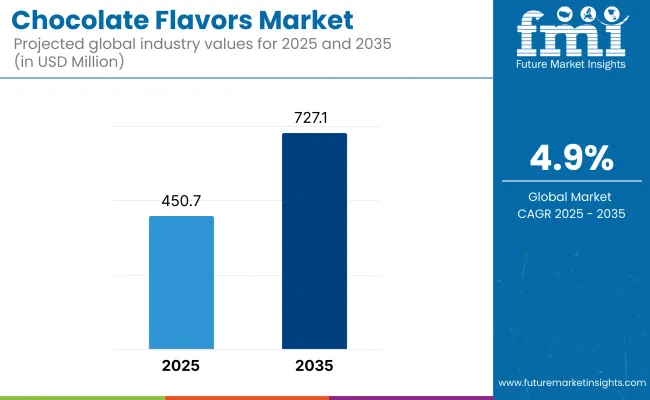
The chocolate flavors industry continuously grows, thanks to the increasing customer attraction to delicious, luxury, and innovative chocolate-infused products. Confectionery, bakery, dairy, beverages, and nutritional products like them to chocolate flavors for the sake of a better taste and a higher appeal. The trend toward using only natural and fairly traded sources for chocolate flavors is also an important factor supporting industry growth.
The industry progress is primarily catalyzed by the growth of demand for high-quality and handmade chocolate products. Consumers are on the lookout for products that are rich, real, and of extremely high quality that are employed in the applications of gourmet desserts and dairy-free asks. Additionally, growing interest in clean-label, organic, and fair-trade chocolate ingredients is driving purchasing decisions.
The trend of introducing functional and health-conscious options to the industry is also covering part of the trend. Manufacturers are setting off new characteristics such as processing cocoa-derived flavonoids and antioxidants into nutritional supplements, protein bars, and low-sugar chocolates.
The development of technology in flavor extraction and processing, which includes cocoa fermentation optimization and natural flavor encapsulation, is increasing the quality and stability of them. The growth of chocolate products based on plants, like oat milk and almond milk with chocolate flavors is also leading to further area coverage.
Nevertheless, challenges such as swinging cocoa prices, sustainability issues concerning cocoa cultivation, and legal regulations about the use of artificial flavoring agents pose threats to the industry. Besides, competition with other flavors such as caramel, vanilla, and nut-based profiles could affect some of the sectors that include chocolate flavors.
Despite these challenges, there are industry growth opportunities. The demand for premium and ethical products with the launch of hybrid and fusion flavor profiles opens new avenues for expansion.
Further, the continuously expanding popularity of chocolate flavors in the plant-based and functional food category is forecasted to foster further industry expansion. Customer demand patterns drive the industry towards a long-term evolution in the coming years.
The industry is riding high on robust demand fueled by increasing consumer trends for premium, natural, and clean-label products across industries. The confectionery and bakery industries are leading the pack with a focus on genuine cocoa-derived flavors to satisfy changing consumer taste buds.
In beverages and dairy, chocolate flavors are being infused into flavored milk, coffee beverages, protein drinks, and ice creams where affordability and quality uniformity become of paramount importance. Trends toward reduction in sugar influence the adoption of chocolate flavor by health-conscious foods.
The pharmaceutical industry only uses a restricted but focused manner, such as in flavored syrups and chewable tablets, for enhancing taste. With increased demand for sustainability and traceability, brands increasingly obtain ethically manufactured cocoa-flavor-based inputs, influencing upcoming development in the marketplace.
The table below provides a comparative analysis of the six-month change in CAGR of the global industry for both the base year (2024) and the current year (2025) for the reporting period.
This observation points out key performance fluctuations and captures trends in revenue realization, thus giving stakeholders better visibility into the growth trajectory over the year. H1 (first half) refers to the period between January and June. H2 (the second half) runs from July to December.
| Particular | Value CAGR |
|---|---|
| H1 | 3.6% (2024 to 2034) |
| H2 | 4.6% (2024 to 2034) |
| H1 | 4.1% (2025 to 2035) |
| H2 | 5.2% (2025 to 2035) |
For the first half (H1) of the period specified, 2025 to 2035, the industry is projected to grow at a CAGR of 4.1%, before accelerating growth to 5.2% in the second half (H2) of the same period. The period, H1 2024 up to H2 2034, CAGR grew to 3.6% in the first half and increased at 4.6% in the second half. The industry witnessed 15 BPS growth and business recorded 10 BPS decline in H1 and H2 respectively
From 2020 to 2024, the industry experienced consistent growth, driven by increasing demand for rich and luxury taste experiences. Consumers called for complex chocolate profiles and therefore witnessed the emergence of hybrid flavors combining chocolate, spice, fruits, and nuts.
Health-oriented trends also impacted the industry, increasing demand for dark chocolate and cocoa-flavored products based on their assumed wellness benefits. Key players in the industry emphasized sensory appeal improvement and increasing product applications in bakery, dairy, and beverages.
North America and Europe were leading due to robust chocolate consumption, while the Asia-Pacific region experienced fast growth through urbanization, increasing disposable incomes, and changing dietary habits. The growth of e-commerce also sped up industry accessibility, enabling brands to reach a greater consumer audience through unique chocolate offerings.
Between 2025 and 2035, the industry will see a revolution with the growth of AI-based flavor profiling and 3D printing, enabling mass customization of chocolate experiences.
Functional chocolate flavor will rise, including bioactive constituents for health properties like mood modification and gut benefits. Neurogastronomy will lead to product development, with a focus on emotional food liking. Encapsulation technology developments will increase stability and controlled release of flavor.
The emerging industries of Asia-Pacific, Latin America, and the Middle East will drive growth, necessitating regional and exotic flavors for chocolate. Digitalization and direct-to-consumer models will disrupt competition, allowing artisanal brands to compete with global players on the basis of differentiated, sensory-based offerings.
Comparative Market Shift Analysis (2020 to 2024 vs. 2025 to 2035)
| 2020 to 2024 | 2025 to 2035 |
|---|---|
| Growing demand for a richer and premium taste | Personalized taste chocolate development powered by AI |
| Increased interest in fusion flavors (chocolate plus spices, fruit, nuts) | Personalized AI and machine-learning-based chocolate experience |
| Growing range of dark cocoa and cocoa-related flavors for medical benefits | Smart chocolate flavors incorporated with probiotics, adaptogens, and nootropics |
| Boom of e-commerce due to easier availability of products | Direct-to-consumer sites redesigning industry competition |
| Sustainability and ethical sourcing as top concerns | Carbon-neutral cocoa growing and upcycled ingredients |
| Formulations by AI with increased depth and complexity of flavors | Controlled-release encapsulation for sustained taste |
| Emotional growth of emerging industries with changing lifestyles | Increased demand for regionally inspired and exotic flavors of chocolate |
| Increased focus on natural and clean-label formulations | Advanced neurogastronomy shaping consumer sensory experience |
| Optimized traditional manufacturing processes through technology | Intelligent processing techniques to improve effectiveness and reduce waste |
The industry is on the rise and driving demand in other sectors such as confectionery, bakery, and beverage. In contrast, cocoa sourcing, particularly, supply chain vulnerabilities are the major risks. Disruption in the supply chain, due in part to climate change, crop diseases, and ethical concerns in cocoa farming, has led to the need for sustainable sourcing and alternative flavor solutions.
The increase in the awareness of health-consciousness among customers has resulted in the increase of the attention given to the content of sugar and the presence of artificial additives in the products that carry flavor. This will lead to less demand for the former products. Industries ought to put the emphasis on the invention and development of low-sugar, organic, and plant-based products that mix well with the current industry trends and dietary changes.
The price fluctuations of cocoa and other raw materials greatly affect the profit margins and can also result in price changes. Economic fluctuations, trade policies, and geopolitical tensions further contribute to cost unpredictability. Companies must adopt flexible procurement strategies, search for synthetic or sustainable alternatives, and enhance productivity to avert financial risks.
Emerging flavor profiles and regional specialties are getting stronger industry competition and standing a threat to traditional chocolate flavors. To stay in the race, brands should bring innovation in their products by using unique combinations of flavors, infusions of exotic elements, and making tailor-made formulations specifically designed for customer needs and industrial applications.
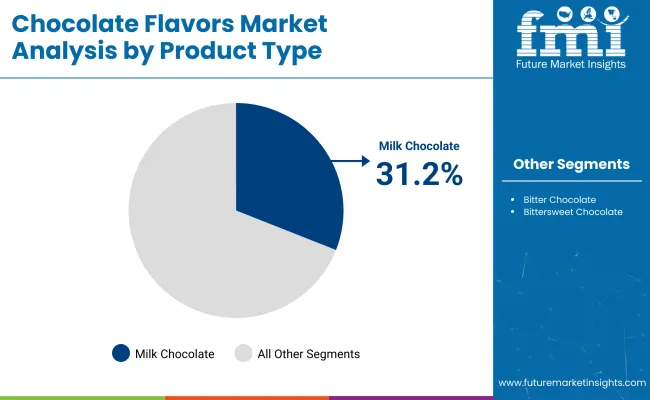
Versatile Product Innovations and Widespread Consumer Preference Strengthening Milk Chocolate’s Industry
| Segment | Value Share (2025) |
|---|---|
| Milk Chocolate (By Product Type) | 31.2% |
In 2025, the estimated industry share of dark chocolate in the industry value will be approximately 47.5%. This rise is attributed to the rising consumer perception towards the health benefits of dark chocolate, including higher levels of flavonoids and antioxidants and lower sugar content than milk chocolate.
The increasing number of consumers drives this high demand for dark chocolates lean toward ethical, high-cocoa, organic, and premium chocolates. Companies are aware of the growing consumer demand for dark chocolate.
Key brands such as Lindt & Sprüngli (Lindt Excellence), Green & Black's (Mondelēz International), and Ghirardelli expand their ranges of 70% cocoa or more products. Additionally, dark chocolate is used in several baking and culinary applications, contributing to the growing demand for it in this industry.
Milk chocolate holds a 31.2% value share in 2025 and continues to prove more popular on average with a broader spectrum of consumers across family and mass-market categories. Its creamy consistency and rich flavor make it a childhood staple or a Sunday evening treat for stoners.
Mars, Inc. (Dove, M&M's), Nestlé (KitKat), and Ferrero Group (Ferrero Rocher) account for top manufacturers within the milk chocolate segment and are currently leading the global confectionery segment, i.e., they occupy strongholds in North America, Europe, and emerging Asian industries. These companies are also being inventive with milk chocolate and are coming up with new flavors, textures, and sustainable packaging.
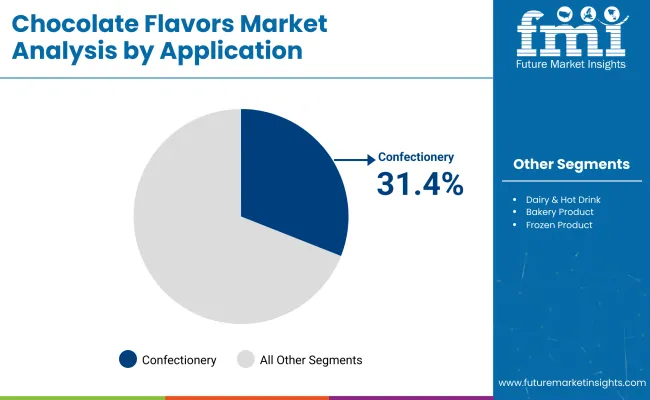
Continuous Product Diversification and Evolving Consumer Tastes Accelerating Confectionery’s Industry
| Segment | Value Share (2025) |
|---|---|
| Confectionery (By Application) | 31.4% |
Based on the application, confectionery continues to account for the largest share of the global chocolate industry, with around 31.4% value share during 2025. Chocolate is an essential part of a large range of confectionery products, chocolate bars, chocolate truffles, pralines, and chocolate-coated snacks.
The segment's growth is driven by innovation in flavors, textures, and formats, along with seasonal demand spikes during holidays, such as Christmas, Valentine's Day, and Easter.
Similarly, core confectionery brands such as Mars, Inc. (Snickers, M&M's), Mondelēz International (Cadbury, Toblerone), and Ferrero Group (Ferrero Rocher, Kinder) remain top players in the industry, keeping their fan base through new product innovation, product launches and limited products that are accessible in-store and across e-commerce platforms.
The chocolate for dairy and hot beverages segment is expected to hold a value share of 22% in 2025, primarily chocolate products that constitute chocolate milk, flavored yogurts, hot cocoa, and specialty coffee drinks.
Demand for premium chocolate ingredients is being stoked by the rising trend toward indulgent, high-quality beverages - in particular, in cafes and quick-service restaurants. Branded retail products and food service channels receive chocolate from companies like Nestlé and Barry Callebaut.
Some key players within this segment are the Hot Chocolate line of Nestlé and the Mocha beverages offered by Starbucks. These shifting consumer preferences for vegan chocolate beverages can also be derived from the popularity of plant-based or dairy-free alternative drinks.
All told, these segments paint a picture of just how broad chocolate can be as a hero ingredient across a range of product categories. With rising consumer demand for indulgence, premium quality, and functional ingredients in food products, both confectionery and beverage applications are expected to remain on a growth path.
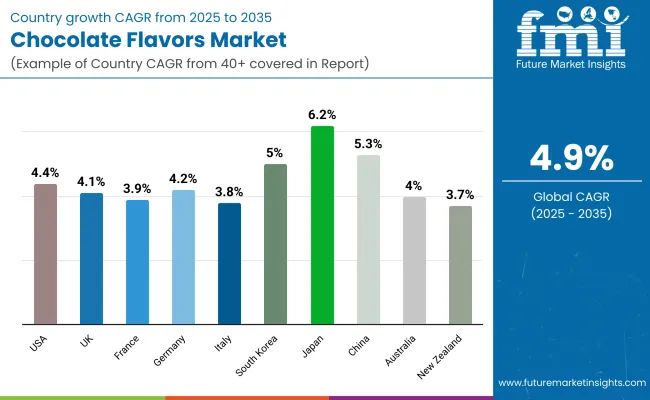
| Countries | CAGR (2025 to 2035) |
|---|---|
| USA | 4.4% |
| UK | 4.1% |
| France | 3.9% |
| Germany | 4.2% |
| Italy | 3.8% |
| South Korea | 5% |
| Japan | 6.2% |
| China | 5.3% |
| Australia | 4% |
| New Zealand | 3.7% |
The USA leadership in the industry is fueled by premium and healthy chocolate innovation products. Growing consumer interest in dark chocolate and functional choco blocks with added ingredients such as superfoods and probiotics has transformed the industry. The leading manufacturers keep investing in state-of-the-art production methods and sustainable cocoa procurement.
In addition, fiscal interventions such as commodity hedging to counter price volatility have also supported operating stability. Increased artisan and craft chocolate creation, together with the desire for ethically sourced goods, will drive industry expansion to 2035.
Britain's chocolate sector is evolving in response to growing customer tastes for organic and healthier chocolate. Low sugar content is increasingly important, and plant-based ingredients are being introduced to cater to the expanding vegan customer base. Premiumization tendencies have fueled surging demand for single-origin chocolate and premium chocolate.
To top it all off, powerful web-based shopping stores and chocolate delivery boxes are the trends influencing the industry. Companies are riding the tide of sustainability measures like carbon-neutral manufacturing to propel loyalty and win out green-aware buyers.
The French sector for chocolate features a focus on artisanal class and conventional sweets-making skills. High-end chocolate boutiques and luxury houses rule, offering personally crafted pralines, ganache, and origin bars. Rising demand for organic and fair-trade chocolates is altering forces in the industry, where customers are prepared to pay a premium price for ethical purchases.
Increased demand for chocolate dessert and pastry consumption is also fueling expansion in the industry. Growth from export-led activity, especially within Asian and European markets, is another impelling force driving France's supremacy in the world market for chocolates.
Germany is still among the top chocolate manufacturers, emphasizing high-quality production. German high-quality production control and innovation have made it dominate both the local and global industries. Investment in the expansion of automated production and sustainability of cocoa supply guarantees long-term growth.
The sugar-free and functional chocolate with vitamin and protein industry has also experienced a boom. Germany's combination of mass-market appeal and premium manufacturing ensures its continued dominance of worldwide chocolate industries.
Italian chocolate is underpinned by its artisanal heritage and pioneering taste profiles. With its reputation as a premium chocolate brand, Italy has seen increasing demand for dark chocolate, particularly for products with high cocoa content. The industry also expands with growing demand for organic and sugar-free chocolates.
Italian chocolatiers are using old methods but combined with new health-focused formulations. Expansion in North American and Asian industries is putting the spotlight on Italy's growing global presence in the luxury chocolate industry.
The South Korean confectionery chocolate industry is expanding fast due to changing food trends and the growing visibility of Western candy styles. The luxury and functional chocolate industry, especially based on Korean products such as matcha and ginseng, is increasing.
Per capita, chocolate consumption is driven up by increasing disposable income and growing middle-class size. Promotional campaigns on the internet and co-branding with international brands also increase industry penetration. The explosion in online trade has also given a major boost to product availability and consumer participation.
The chocolate business in Japan is led by its creative packaging and taste. Japan is the trendsetter for new-type chocolates such as matcha, sake, and low-sugar types. Limited edition and limited seasonal fuel brand loyalty and consumer enthusiasm.
The Japanese culture of convenience stores has made high-end chocolates accessible to the masses. Additionally, Japan's emphasis on quality ingredients and appealing packaging supports its global image of high-end chocolate products. Investment in sustainable production and ethical sourcing is also changing industry strategies.
The Chinese industry is witnessing strong growth as a result of increasing urbanization and the rising middle class. Premium chocolate consumption, particularly dark chocolate with health benefits, is growing at a rapid rate. Foreign brands are investing in local packaging and local preferences to meet the needs of Chinese consumers.
The dominance of e-commerce has also increased industry penetration, with chocolates being easily available in different regions. International and domestic company joint ventures are promoting innovation and enhancing overall industry performance.
The Australian industry is prompted by growing consumer buying of premium and ethical chocolate. Organic and bean-to-bar chocolates are in bigger demand since firms concentrate on open-source and sustainable approaches. Health consumers increasingly prefer chocolates that are rich in cocoa and low in sugar content.
Strong retail channels, in the form of specialty shops dealing in chocolates and supermarkets, bring industry stability for expansion. Additionally, the added emphasis by Australia on exporting high-quality chocolates to industries in Asia contributes further to the expansion of the nation's industry.
New Zealand's industry relies on natural ingredients and fair sources. Higher demand for small-batch and handcrafted chocolates is evident, with buyers buying organic and dairy-free chocolates. Sustainability is a concern, with companies marketing fair-trade cocoa and eco-friendly packaging.
Regional producers are also testing innovative flavors from local materials like Kawakawa and Manuka honey. Expansion by boutique chocolatiers and growing export opportunities to regional industries allow long-term growth opportunities.
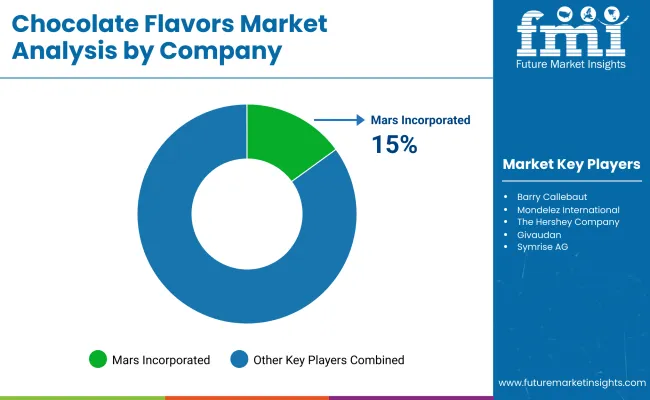
They comprise a very dynamic and competitive industry based on continuous innovations, premiumization, and evolving consumer palates. Mars, Incorporated, Barry Callebaut, Mondelez International, The Hershey Company, and Givaudan have the largest businesses in the industry; they dominate with proprietary technologies in flavors, wide product portfolios, as well as strategic acquisitions.
Advanced cocoa processing, natural flavor extractions, and sustainable sourcing are some of the areas in which these companies have invested to sustain their positions in the industry.
Changing consumer preference toward clean-label and plant-based chocolate formulations has seen these industry leaders invest in organic, fair-trade, and reduced-sugar-chocolate flavor solutions.
This continues to trend, with single-origin cocoa flavors, exotic infusions, and health-enhancing chocolate blends emerging as high-growth areas within the industry, increasingly feeding the demand for high-end and experiential flavor profiles in all confectionery, beverages, and bakery applications.
New entrants and boutique manufacturers are shaking things up by having artisanal, small-batch, and ethically sourced options, thus adding a touch to sustainability-minded consumers. Conversely, advancements in technologies like flavor encapsulation, fat reduction, and cocoa fermentation have given manufacturers an edge in improving taste intensity, shelf stability, and application versatility.
They will have joint efforts whereby chocolate manufacturers will enter collaborative partnerships with food & beverage brands as well as flavor houses. This scenario will enable new industries to be tapped and bespoke flavor solutions to be developed.
As the industry witnesses sustainability and transparency becoming the real drivers of business, the firms that will take this dimension up with traceable sourcing, green packaging, and regenerative cocoa farming practices will find themselves long-term kings of the industry.
Market Share Analysis by Company
| Company Name | Estimated Market Share (%) |
|---|---|
| Mars, Incorporated | 15-18% |
| Barry Callebaut | 12-15% |
| Mondelez International | 10-14% |
| The Hershey Company | 8-12% |
| Givaudan | 6-10% |
| Other Companies (Combined) | 30-40% |
| Company Name | Key Offerings & Activities |
|---|---|
| Mars, Incorporated | Extensive portfolio of chocolate flavors used in confectionery and ice creams, with strong brand influence. |
| Barry Callebaut | Global leader in cocoa and chocolate solutions, focusing on sustainability and premium chocolate flavors. |
| Mondelez International | Innovating with indulgent and health-conscious chocolate flavors, serving bakery and snack segments. |
| The Hershey Company | Strong presence in the North American industry, investing in unique chocolate-based flavor innovations. |
| Givaudan | A major flavor house developing custom chocolate flavors for food and beverage applications. |
Key Company Insights
Mars, Incorporated (15-18%)
A global leader in chocolate-flavored products, Mars continuously innovates in premiumization, plant-based chocolates, and sustainable sourcing.
Barry Callebaut (12-15%)
Known for its high-quality cocoa ingredients and sustainable practices, Barry Callebaut supplies chocolate flavors to confectionery and bakery manufacturers worldwide.
Mondelez International (10-14%)
Mondelez is expanding its indulgent and functional chocolate flavors, focusing on snacks and health-conscious formulations.
The Hershey Company (8-12%)
Hershey is driving growth through unique chocolate flavor infusions, clean-label offerings, and digital engagement strategies.
Givaudan (6-10%)
As a leading flavor house, Givaudan specializes in customized chocolate flavors for beverages, dairy, and plant-based products.
Other Key Players
By product type, the industry is segmented into white chocolate, bitter chocolate, bittersweet chocolate, and milk chocolate.
By application, the industry is segmented into confectionery, dairy & hot drinks, bakery products, frozen products, convenience products, and others.
By region, the industry is analyzed across North America, Latin America, Western Europe, Eastern Europe, East Asia, South Asia & Pacific, Central Asia, Russia and Belarus, Balkan & Baltic Countries, and the Middle East & Africa.
The industry is expected to reach USD 450.7 million in 2025.
The industry is projected to grow to USD 727.1 million by 2035.
Key companies include Mars, Incorporated, Givaudan, Mondelez International, Ferrero Group, The Hershey Company, Symrise AG, Nestlé S.A., Lindt & Sprüngli, Barry Callebaut, Blommer Chocolate Company, Guittard Chocolate Company, Valrhona, and others.
Japan, with a projected CAGR of 6.2% during the forecast period, is expected to witness the fastest growth.
The milk chocolate is among the most widely used in the market.


Our Research Products

The "Full Research Suite" delivers actionable market intel, deep dives on markets or technologies, so clients act faster, cut risk, and unlock growth.

The Leaderboard benchmarks and ranks top vendors, classifying them as Established Leaders, Leading Challengers, or Disruptors & Challengers.

Locates where complements amplify value and substitutes erode it, forecasting net impact by horizon

We deliver granular, decision-grade intel: market sizing, 5-year forecasts, pricing, adoption, usage, revenue, and operational KPIs—plus competitor tracking, regulation, and value chains—across 60 countries broadly.

Spot the shifts before they hit your P&L. We track inflection points, adoption curves, pricing moves, and ecosystem plays to show where demand is heading, why it is changing, and what to do next across high-growth markets and disruptive tech

Real-time reads of user behavior. We track shifting priorities, perceptions of today’s and next-gen services, and provider experience, then pace how fast tech moves from trial to adoption, blending buyer, consumer, and channel inputs with social signals (#WhySwitch, #UX).

Partner with our analyst team to build a custom report designed around your business priorities. From analysing market trends to assessing competitors or crafting bespoke datasets, we tailor insights to your needs.
Supplier Intelligence
Discovery & Profiling
Capacity & Footprint
Performance & Risk
Compliance & Governance
Commercial Readiness
Who Supplies Whom
Scorecards & Shortlists
Playbooks & Docs
Category Intelligence
Definition & Scope
Demand & Use Cases
Cost Drivers
Market Structure
Supply Chain Map
Trade & Policy
Operating Norms
Deliverables
Buyer Intelligence
Account Basics
Spend & Scope
Procurement Model
Vendor Requirements
Terms & Policies
Entry Strategy
Pain Points & Triggers
Outputs
Pricing Analysis
Benchmarks
Trends
Should-Cost
Indexation
Landed Cost
Commercial Terms
Deliverables
Brand Analysis
Positioning & Value Prop
Share & Presence
Customer Evidence
Go-to-Market
Digital & Reputation
Compliance & Trust
KPIs & Gaps
Outputs
Full Research Suite comprises of:
Market outlook & trends analysis
Interviews & case studies
Strategic recommendations
Vendor profiles & capabilities analysis
5-year forecasts
8 regions and 60+ country-level data splits
Market segment data splits
12 months of continuous data updates
DELIVERED AS:
PDF EXCEL ONLINE
Chocolate Powdered Drinks Market Forecast and Outlook 2025 to 2035
Chocolate Bar Packaging Market Size and Share Forecast Outlook 2025 to 2035
Chocolate Market Size and Share Forecast Outlook 2025 to 2035
Chocolate Flavoring Compounds Market Size and Share Forecast Outlook 2025 to 2035
Chocolate Wrapping Machine Market Size and Share Forecast Outlook 2025 to 2035
Chocolate Couverture Market Size, Growth, and Forecast for 2025 to 2035
Chocolate Processing Equipment Market Size, Growth, and Forecast 2025 to 2035
Chocolate Wrapping Films Market from 2025 to 2035
Chocolate Confectionery Market Analysis by Product, Type, Distribution Channel, and Region Through 2035
Chocolate Inclusions and Decorations Market Analysis by Type, End Use, and Region Through 2035
Industry Share Analysis for Chocolate Bar Packaging Companies
Chocolate Syrup Market
Non-Chocolate Candy Market
Vegan Chocolate Market Analysis - Size, Share, and Forecast Outlook 2025 to 2035
Premium Chocolate Market Analysis - Size, Share, and Forecast Outlook 2025 to 2035
Compound Chocolate Market Analysis - Size, Share, and Forecast Outlook 2025 to 2035
Sugarless Chocolate Market
Industrial Chocolate Market Analysis by Product, Application, Type, and Region through 2035
Analysis and Growth Projections for Low-calorie Chocolate Business
Sugar-Free White Chocolate Market Trends - Demand & Growth 2025 to 2035

Thank you!
You will receive an email from our Business Development Manager. Please be sure to check your SPAM/JUNK folder too.
Chat With
MaRIA