Chocolate Flavoring Compounds Market Forecast and Outlook 2025 to 2035

The global chocolate flavoring compounds market is valued at USD 40.7 billion in 2025 and is expected to reach USD 66.3 billion by 2035, reflecting a CAGR of 5.0%.
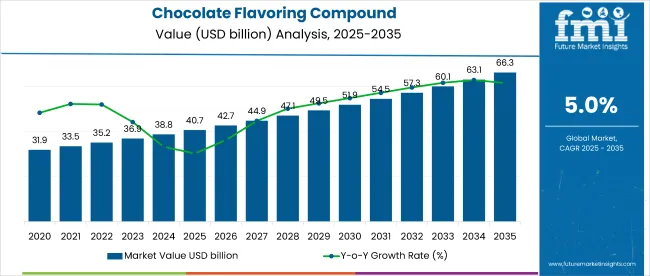
Quick Stats Of Chocolate Flavoring Compounds Market

  • Market Value (2025): USD 40.7 billion
  • Forecast Value (2035): USD 66.3 billion
  • Forecast CAGR: 5.0%
  • Product Leader in 2025: Milk (45% Market Share)
  • Top Form Segment: Paste (52% Share)
  • Key Growth Region: North America (UK is the fastest-growing market with 6.3% CAGR)

Chocolate Flavoring Compound Market

The growth in the market is largely driven by the increasing consumer preference for chocolate-flavored products, the rise of healthier alternatives, and the expansion of the confectionery sector. Rising consumer interest in organic and natural ingredients, along with innovations in low-sugar and fortified chocolate products, will continue to shape the market's evolution.

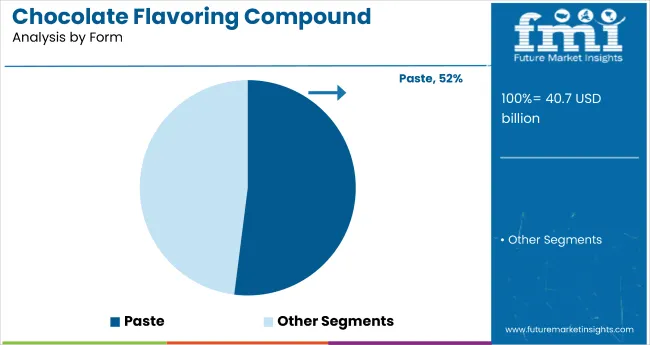
North America, particularly the USA, holds the largest share, growing at a significant CAGR of 5.7% from 2025 to 2035. Meanwhile, the UK and Germany are also witnessing robust growth with significant CAGRs of 6.3% and 6% respectively. By product type, milk chocolate accounts for a significant market share of 45%. Meanwhile, paste form holds a prominent share of 52% being a dominating segment in 2025.

The market holds varying shares across its parent markets. It accounts for around 10-15% of the global chocolate market, driven by the demand for flavored and compound chocolates. In the confectionery market, it holds an estimated 12-18% share, as chocolate is a key ingredient in many confectionery products.

The market contributes 8-12% to the beverage market, especially in chocolate-based drinks. In the dairy market, it represents about 5-7%, particularly in chocolate-flavored dairy items. The bakery market sees around 10-12% of its share, largely due to chocolate-flavored baked goods. In the snack market, the market holds roughly 6-8%, driven by chocolate-coated snacks.

Looking forward, the market is likely to benefit from recent innovations, including the development of healthier chocolate options, such as sugar-free and dairy-free compounds. With the increasing awareness of health and wellness, there is a growing demand for chocolate flavoring compounds that offer lower sugar content and enriched nutritional benefits. Government regulations supporting sustainable cocoa farming practices and eco-friendly packaging solutions are expected to further contribute to the market’s expansion.

Chocolate Flavoring Compounds Market Analysis by Top Investment Segment

The global market is segmented by product type, form, end use, and region. The product type, the market includes dark, milk, and white. In terms of form, the market is divided into solid and paste.

Based on end-use, the market is segmented into variegates, chocolate beverages, bakery, frozen desserts, confectionery, dairy, snacks, sauces & spreads, convenience food, and others (including niche food products). Regionally, the market is classified into North America, Latin America, Europe, the Middle East and Africa, East Asia, South Asia, and Oceania.
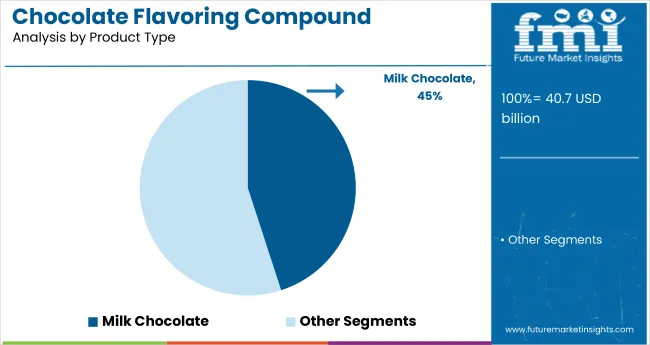
By Product Type, Milk Chocolate Accounts for 45% of the Market Share

Chocolate Flavoring Compound Analysis By Product Type

Milk chocolate remains the dominant segment, commanding the largest market share of 45% due to its widespread popularity across various consumer groups. It is a preferred choice in most confectionery products, including bars, coatings, and other chocolate-based snacks.
  • Growth in health-conscious consumers seeking organic milk chocolate alternatives.
  • Rising demand for dairy-free milk chocolate options.

By Form, Paste Form Accounts for 52% of the Market Share in 2025

Chocolate Flavoring Compound Analysis By Form

Paste chocolate is widely used in a variety of applications, including fillings, spreads, coatings, and confectionery bases. The segment accounts for 52% of the market share. Its smooth texture and versatility make it ideal for products like chocolate creams and fudge, where a semi-liquid consistency is required.
  • Growing demand for paste in premium fillings and spreads for confectionery.
  • The segment benefits from innovations in functional chocolate, such as sugar-free and dairy-free paste.

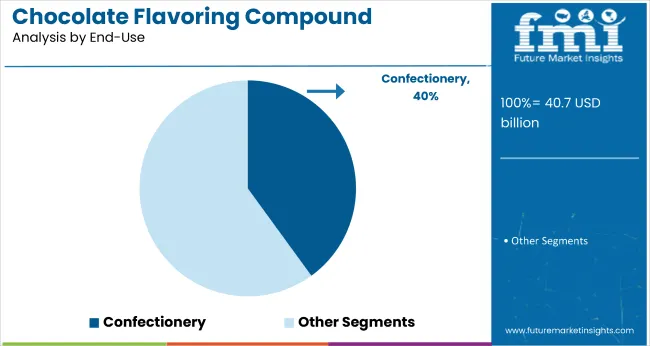
By End Use, the Confectionery Segment Accounts for 40% of the Market Share

Chocolate Flavoring Compound Analysis By End Use

Confectionery continues to lead the end-use segment with 40% of the market share, driven by the global demand for chocolate-based sweets such as bars, truffles, and candies. This sector benefits from consistent consumer preferences for indulgent treats, especially in regions like North America and Europe.

  • The segment is growing due to innovations in low-sugar and organic chocolate.
  • Increased consumption of premium chocolate confections among affluent consumers.

Top Chocolate Flavoring Compound Market Dynamics

The global chocolate flavoring compound market is witnessing sustained growth, fueled by rising demand for indulgent and innovative confectionery products. The surge in artisanal and premium chocolate trends, coupled with growing applications in bakery, dairy, and beverages, is driving market expansion.

Recent Trends in the Chocolate Flavoring Compound Market
  • Growing demand for organic and sugar-free chocolate flavoring compounds.
  • Rising popularity of plant-based and dairy-free chocolate options.
  • Increased focus on sustainability in production and packaging.

Challenges in the Chocolate Flavoring Compound Market

  • Volatility in cocoa prices is affecting overall production costs.
  • Difficulty in maintaining the supply chain for high-quality cocoa beans.
  • Increased competition from emerging local chocolate producers in Asia and Latin America.

Analyzing Top Countries Producing, Using and Supplying Chocolate Flavoring Compounds

Chocolate Flavoring Market Cagr Analysis By Country

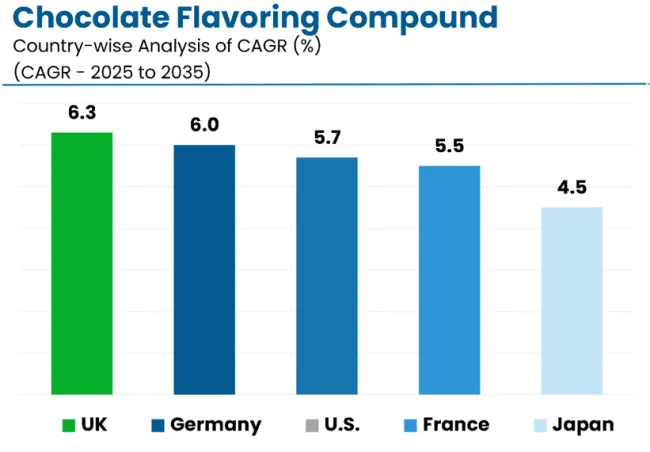
The market shows varied growth across key countries. The USA leads with a CAGR of 5.7%, driven by high demand for milk chocolate, specialty products, and healthier alternatives like sugar-free and organic varieties. The UK follows closely with a prominent CAGR of 6.3%, propelled by growing interest in premium, organic, and ethically sourced chocolates.

Germany and France exhibit similar growth at 6% and 5.5% CAGR, respectively, supported by a strong local demand for dark and milk chocolate, alongside the rise of functional, health-oriented products. Japan has the lowest growth rate at 4.5%, though it benefits from unique flavors and eco-conscious trends.

The report covers an in-depth analysis of 40+ countries; five top-performing OECD countries are highlighted below.
USA Chocolate Flavoring Compounds Analysis

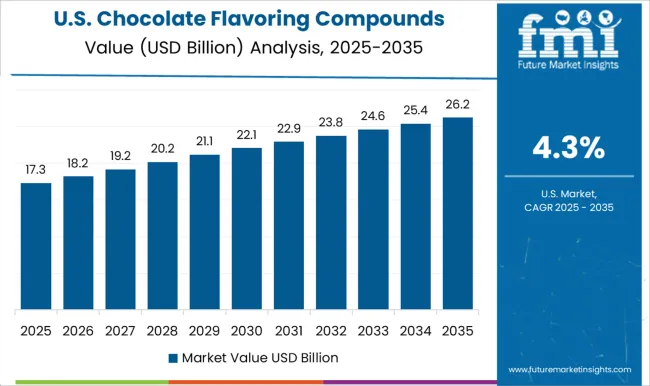
The revenue of chocolate flavoring compounds in the USA is projected to grow at a CAGR of 5.7% from 2025 to 2035. The USA remains the largest consumer and producer of chocolate, with strong demand for milk chocolate and specialty chocolate products. Market growth is driven by increasing consumer preference for healthier alternatives, including sugar-free and organic varieties.

  • Growing demand for organic and low-sugar chocolate products.
  • Increase in the popularity of dark and plant-based chocolate.

Chocolate Flavoring Compounds Demand Analysis in the UK

The chocolate flavoring compounds market in the UK is projected to expand at a CAGR of 6.3% from 2025 to 2035. The country is witnessing a growing trend toward premium and organic chocolate, driven by rising consumer interest in healthier and more sustainable options.
  • Rising consumer preference for premium and ethically sourced chocolates.
  • Growing popularity of chocolate-based beverages and desserts.

Germany Chocolate Flavoring Compounds Sales Analysis

Sales of chocolate flavoring compounds in Germany are estimated to rise at a CAGR of 6% from 2025 to 2035. As one of the largest chocolate producers in Europe, Germany benefits from a strong presence of both domestic and international chocolate manufacturers.

  • Strong local demand for high-quality dark and milk chocolate.
  • Increasing adoption of sustainable sourcing practices by key players.

Chocolate Flavoring Compounds Demand Analysis in France

Revenue from chocolate flavoring compounds in France is projected to grow at a CAGR of 5.5% from 2025 to 2035. The French chocolate market is driven by the country’s rich culinary tradition and a growing preference for premium and artisanal chocolate products.

  • Increase in the demand for premium and artisanal chocolates.
  • Growing interest in organic and sugar-free chocolate options.

Japan Chocolate Flavoring Compounds Market Analysis

The chocolate flavoring compounds market in Japan is anticipated to grow at a CAGR of 4.5% from 2025 to 2035. Japan is known for its innovative approach to chocolate, with strong demand for premium offerings and unique flavor innovations such as matcha-flavored and fruit-infused varieties.

  • Rising popularity of premium and uniquely flavored chocolate products.
  • Increased demand for low-sugar and health-focused chocolate options.

Leading Chocolate Flavoring Compound Suppliers

The market is moderately fragmented, with several key global players competing for market share. Major suppliers such as Clover Hill Food Ingredients Ltd, Cargill, ADM WILD Europe GmbH & Co.KG, Nestlé, and Barry Callebaut are highly influential in this space.

These companies are vying for dominance through strategies that include innovation in chocolate formulations, strategic partnerships, expansion into emerging markets, and competitive pricing. Their focus on sustainability and clean-label products is also reshaping consumer demand, particularly in premium and organic chocolate segments.

Top companies in this sector continually invest in technological advancements to enhance their production processes and supply chains. Innovation in flavors, health-conscious formulations (like sugar-free and dairy-free options), and sustainable sourcing are pivotal to their market strategies.

Additionally, collaborations with retailers and online platforms to expand their distribution networks are key tactics for increasing market penetration. Competitive pricing remains a primary focus, especially in high-volume product lines, while maintaining product differentiation through unique offerings like functional and organic chocolate remains a strong point of competition.

Recent Chocolate Flavoring Compound Industry News

  • In April 2024, Cargill showcased gourmet chocolate and coating innovations at FHA Singapore, aligning with APAC trends for indulgence, health, and sustainability to support chefs and foodservice professionals.

Chocolate Flavoring Compound Market Report Scope

Report Attributes Details
Current Total Market Size (2025) USD 40.7 billion
Projected Market Size (2035) USD 66.3 billion
CAGR (2025 to 2035) 5.0%
Base Year for Estimation 2024
Historical Period 2020 to 2024
Projections Period 2025 to 2035
Market Analysis Parameters Revenue in USD billions/Volume in kilotons
By Product Type Dark, Milk, and White
By Form Solid and Paste
By End Use Variegates, Chocolate Beverages, Bakery, Frozen Desserts, Confectionery, Dairy, Snacks, Sauces & Spreads, Convenience Food, and Others (including niche food products)
Regions Covered North America, Latin America, Europe, Middle East & Africa, East Asia, South Asia, Oceania
Countries Covered United States, Canada, United Kingdom, Germany, France, China, Japan, South Korea, Brazil, Australia add this 40+ countries in report scope
Key Players Clover Hill Food Ingredients Ltd, Cargill, Incorporated, ADM WILD Europe GmbH & Co.KG, Nestlé, Wilmar International Limited, PURATOS, Shellz Overseas Pvt. Ltd., INFORUM Group, Buhler AG, Barry Callebaut, Unigrà S.r.l., Blommer Chocolate Company, CEMOI, HERZA Schokolade GmbH & Co. KG
Additional Attributes Dollar sales by value, market share analysis by region, and country-wise analysis

Chocolate Flavoring Compounds Market by Category

By Product Type:

  • Dark
  • Milk
  • White

By Form:

  • Solid
  • Paste

By End Use:

  • Variegates
  • chocolate beverages
  • Bakery
  • Frozen desserts
  • Confectionery
  • Dairy
  • Snacks
  • Sauces & spreads
  • Convenience food
  • Others

By Region:

  • North America
  • Latin America
  • Europe
  • Middle East and Africa
  • East Asia
  • South Asia
  • Oceania

Table of Content

  1. Executive Summary
    • Global Market Outlook
    • Demand-side Trends
    • Supply-side Trends
    • Technology Roadmap Analysis
    • Analysis and Recommendations
  2. Market Overview
    • Market Coverage / Taxonomy
    • Market Definition / Scope / Limitations
  3. Market Background
    • Market Dynamics
      • Drivers
      • Restraints
      • Opportunity
      • Trends
    • Scenario Forecast
      • Demand in Optimistic Scenario
      • Demand in Likely Scenario
      • Demand in Conservative Scenario
    • Opportunity Map Analysis
    • Product Life Cycle Analysis
    • Supply Chain Analysis
      • Supply Side Participants and their Roles
        • Producers
        • Mid-Level Participants (Traders/ Agents/ Brokers)
        • Wholesalers and Distributors
      • Value Added and Value Created at Node in the Supply Chain
      • List of Raw Material Suppliers
      • List of Existing and Potential Buyer’s
    • Investment Feasibility Matrix
    • Value Chain Analysis
      • Profit Margin Analysis
      • Wholesalers and Distributors
      • Retailers
    • PESTLE and Porter’s Analysis
    • Regulatory Landscape
      • By Key Regions
      • By Key Countries
    • Regional Parent Market Outlook
    • Production and Consumption Statistics
    • Import and Export Statistics
  4. Global Market Analysis 2020 to 2024 and Forecast, 2025 to 2035
    • Historical Market Size Value (USD Billion) & Volume (Kilotons) Analysis, 2020 to 2024
    • Current and Future Market Size Value (USD Billion) & Volume (Kilotons) Projections, 2025 to 2035
      • Y-o-Y Growth Trend Analysis
      • Absolute $ Opportunity Analysis
  5. Global Market Pricing Analysis 2020 to 2024 and Forecast 2025 to 2035
  6. Global Market Analysis 2020 to 2024 and Forecast 2025 to 2035, By Product Type
    • Introduction / Key Findings
    • Historical Market Size Value (USD Billion) & Volume (Kilotons) Analysis By Product Type, 2020 to 2024
    • Current and Future Market Size Value (USD Billion) & Volume (Kilotons) Analysis and Forecast By Product Type, 2025 to 2035
      • Dark
      • Milk
      • White
    • Y-o-Y Growth Trend Analysis By Product Type, 2020 to 2024
    • Absolute $ Opportunity Analysis By Product Type, 2025 to 2035
  7. Global Market Analysis 2020 to 2024 and Forecast 2025 to 2035, By Form
    • Introduction / Key Findings
    • Historical Market Size Value (USD Billion) & Volume (Kilotons) Analysis By Form, 2020 to 2024
    • Current and Future Market Size Value (USD Billion) & Volume (Kilotons) Analysis and Forecast By Form, 2025 to 2035
      • Solid
      • Paste
    • Y-o-Y Growth Trend Analysis By Form, 2020 to 2024
    • Absolute $ Opportunity Analysis By Form, 2025 to 2035
  8. Global Market Analysis 2020 to 2024 and Forecast 2025 to 2035, By End Use
    • Introduction / Key Findings
    • Historical Market Size Value (USD Billion) & Volume (Kilotons) Analysis By End Use, 2020 to 2024
    • Current and Future Market Size Value (USD Billion) & Volume (Kilotons) Analysis and Forecast By End Use, 2025 to 2035
      • Variegates
      • Chocolate Beverages
      • Bakery
      • Frozen Desserts
      • Confectionery
      • Dairy
      • Snacks
      • Sauces & Spreads
      • Convenience Food
      • Others
    • Y-o-Y Growth Trend Analysis By End Use, 2020 to 2024
    • Absolute $ Opportunity Analysis By End Use, 2025 to 2035
  9. Global Market Analysis 2020 to 2024 and Forecast 2025 to 2035, By Region
    • Introduction
    • Historical Market Size Value (USD Billion) & Volume (Kilotons) Analysis By Region, 2020 to 2024
    • Current Market Size Value (USD Billion) & Volume (Kilotons) Analysis and Forecast By Region, 2025 to 2035
      • North America
      • Latin America
      • Western Europe
      • Eastern Europe
      • East Asia
      • South Asia & Pacific
      • Middle East and Africa
    • Market Attractiveness Analysis By Region
  10. North America Market Analysis 2020 to 2024 and Forecast 2025 to 2035, By Country
    • Historical Market Size Value (USD Billion) & Volume (Kilotons) Trend Analysis By Market Taxonomy, 2020 to 2024
    • Market Size Value (USD Billion) & Volume (Kilotons) Forecast By Market Taxonomy, 2025 to 2035
      • By Country
        • USA
        • Canada
        • Mexico
      • By Product Type
      • By Form
      • By End Use
    • Market Attractiveness Analysis
      • By Country
      • By Product Type
      • By Form
      • By End Use
    • Key Takeaways
  11. Latin America Market Analysis 2020 to 2024 and Forecast 2025 to 2035, By Country
    • Historical Market Size Value (USD Billion) & Volume (Kilotons) Trend Analysis By Market Taxonomy, 2020 to 2024
    • Market Size Value (USD Billion) & Volume (Kilotons) Forecast By Market Taxonomy, 2025 to 2035
      • By Country
        • Brazil
        • Argentina
        • Rest of LATAM
      • By Product Type
      • By Form
      • By End Use
    • Market Attractiveness Analysis
      • By Country
      • By Product Type
      • By Form
      • By End Use
    • Key Takeaways
  12. Western Europe Market Analysis 2020 to 2024 and Forecast 2025 to 2035, By Country
    • Historical Market Size Value (USD Billion) & Volume (Kilotons) Trend Analysis By Market Taxonomy, 2020 to 2024
    • Market Size Value (USD Billion) & Volume (Kilotons) Forecast By Market Taxonomy, 2025 to 2035
      • By Country
        • Germany
        • Italy
        • France
        • UK
        • Spain
        • BENELUX
        • Nordic
        • Rest of W.Europe
      • By Product Type
      • By Form
      • By End Use
    • Market Attractiveness Analysis
      • By Country
      • By Product Type
      • By Form
      • By End Use
    • Key Takeaways
  13. Eastern Europe Market Analysis 2020 to 2024 and Forecast 2025 to 2035, By Country
    • Historical Market Size Value (USD Billion) & Volume (Kilotons) Trend Analysis By Market Taxonomy, 2020 to 2024
    • Market Size Value (USD Billion) & Volume (Kilotons) Forecast By Market Taxonomy, 2025 to 2035
      • By Country
        • Russia
        • Hungary
        • Poland
        • Balkan & Baltics
        • Rest of E. Europe
      • By Product Type
      • By Form
      • By End Use
    • Market Attractiveness Analysis
      • By Country
      • By Product Type
      • By Form
      • By End Use
    • Key Takeaways
  14. East Asia Market Analysis 2020 to 2024 and Forecast 2025 to 2035, By Country
    • Historical Market Size Value (USD Billion) & Volume (Kilotons) Trend Analysis By Market Taxonomy, 2020 to 2024
    • Market Size Value (USD Billion) & Volume (Kilotons) Forecast By Market Taxonomy, 2025 to 2035
      • By Country
        • China
        • Japan
        • South Korea
      • By Product Type
      • By Form
      • By End Use
    • Market Attractiveness Analysis
      • By Country
      • By Product Type
      • By Form
      • By End Use
    • Key Takeaways
  15. South Asia & Pacific Market Analysis 2020 to 2024 and Forecast 2025 to 2035, By Country
    • Historical Market Size Value (USD Billion) & Volume (Kilotons) Trend Analysis By Market Taxonomy, 2020 to 2024
    • Market Size Value (USD Billion) & Volume (Kilotons) Forecast By Market Taxonomy, 2025 to 2035
      • By Country
        • India
        • Australia & New Zealand
        • ASEAN
        • Rest of SAP
      • By Product Type
      • By Form
      • By End Use
    • Market Attractiveness Analysis
      • By Country
      • By Product Type
      • By Form
      • By End Use
    • Key Takeaways
  16. Middle East and Africa Market Analysis 2020 to 2024 and Forecast 2025 to 2035, By Country
    • Historical Market Size Value (USD Billion) & Volume (Kilotons) Trend Analysis By Market Taxonomy, 2020 to 2024
    • Market Size Value (USD Billion) & Volume (Kilotons) Forecast By Market Taxonomy, 2025 to 2035
      • By Country
        • GCC Countries
        • Northern Africa
        • South Africa
        • Turkiye
        • Rest of MEA
      • By Product Type
      • By Form
      • By End Use
    • Market Attractiveness Analysis
      • By Country
      • By Product Type
      • By Form
      • By End Use
    • Key Takeaways
  17. Key Countries Market Analysis
    • USA
      • Pricing Analysis
      • Market Share Analysis, 2024
        • By Product Type
        • By Form
        • By End Use
    • Canada
      • Pricing Analysis
      • Market Share Analysis, 2024
        • By Product Type
        • By Form
        • By End Use
    • Brazil
      • Pricing Analysis
      • Market Share Analysis, 2024
        • By Product Type
        • By Form
        • By End Use
    • Mexico
      • Pricing Analysis
      • Market Share Analysis, 2024
        • By Product Type
        • By Form
        • By End Use
    • Argentina
      • Pricing Analysis
      • Market Share Analysis, 2024
        • By Product Type
        • By Form
        • By End Use
  18. Market Structure Analysis
    • Competition Dashboard
    • Competition Benchmarking
    • Market Share Analysis of Top Players
      • By Regional
      • By Product Type
      • By Form
      • By End Use
  19. Competition Analysis
    • Competition Deep Dive
      • Clover Hill Food Ingredients Ltd
        • Overview
        • Product Portfolio
        • Profitability by Market Segments (Product/Age /Sales Channel/Region)
        • Sales Footprint
        • Strategy Overview
          • Marketing Strategy
          • Product Strategy
          • Channel Strategy
      • Cargill, Incorporated
        • Overview
        • Product Portfolio
        • Profitability by Market Segments (Product/Age /Sales Channel/Region)
        • Sales Footprint
        • Strategy Overview
          • Marketing Strategy
          • Product Strategy
          • Channel Strategy
      • ADM WILD Europe GmbH & Co.KG
        • Overview
        • Product Portfolio
        • Profitability by Market Segments (Product/Age /Sales Channel/Region)
        • Sales Footprint
        • Strategy Overview
          • Marketing Strategy
          • Product Strategy
          • Channel Strategy
      • Nestlé
        • Overview
        • Product Portfolio
        • Profitability by Market Segments (Product/Age /Sales Channel/Region)
        • Sales Footprint
        • Strategy Overview
          • Marketing Strategy
          • Product Strategy
          • Channel Strategy
      • Wilmar International Limited
        • Overview
        • Product Portfolio
        • Profitability by Market Segments (Product/Age /Sales Channel/Region)
        • Sales Footprint
        • Strategy Overview
          • Marketing Strategy
          • Product Strategy
          • Channel Strategy
      • PURATOS
        • Overview
        • Product Portfolio
        • Profitability by Market Segments (Product/Age /Sales Channel/Region)
        • Sales Footprint
        • Strategy Overview
          • Marketing Strategy
          • Product Strategy
          • Channel Strategy
      • Shellz Overseas Pvt. Ltd.
        • Overview
        • Product Portfolio
        • Profitability by Market Segments (Product/Age /Sales Channel/Region)
        • Sales Footprint
        • Strategy Overview
          • Marketing Strategy
          • Product Strategy
          • Channel Strategy
      • INFORUM Group
        • Overview
        • Product Portfolio
        • Profitability by Market Segments (Product/Age /Sales Channel/Region)
        • Sales Footprint
        • Strategy Overview
          • Marketing Strategy
          • Product Strategy
          • Channel Strategy
      • Buhler AG, Barry Callebaut
        • Overview
        • Product Portfolio
        • Profitability by Market Segments (Product/Age /Sales Channel/Region)
        • Sales Footprint
        • Strategy Overview
          • Marketing Strategy
          • Product Strategy
          • Channel Strategy
      • Unigrà S.r.l.
        • Overview
        • Product Portfolio
        • Profitability by Market Segments (Product/Age /Sales Channel/Region)
        • Sales Footprint
        • Strategy Overview
          • Marketing Strategy
          • Product Strategy
          • Channel Strategy
      • Blommer Chocolate Company
        • Overview
        • Product Portfolio
        • Profitability by Market Segments (Product/Age /Sales Channel/Region)
        • Sales Footprint
        • Strategy Overview
          • Marketing Strategy
          • Product Strategy
          • Channel Strategy
      • CEMOI
        • Overview
        • Product Portfolio
        • Profitability by Market Segments (Product/Age /Sales Channel/Region)
        • Sales Footprint
        • Strategy Overview
          • Marketing Strategy
          • Product Strategy
          • Channel Strategy
      • HERZA Schokolade GmbH & Co. KG
        • Overview
        • Product Portfolio
        • Profitability by Market Segments (Product/Age /Sales Channel/Region)
        • Sales Footprint
        • Strategy Overview
          • Marketing Strategy
          • Product Strategy
          • Channel Strategy
  20. Assumptions & Acronyms Used
  21. Research Methodology

List of Tables

  • Table 1: Global Market Value (USD Billion) Forecast by Region, 2020 to 2035
  • Table 2: Global Market Volume (Kilotons) Forecast by Region, 2020 to 2035
  • Table 3: Global Market Value (USD Billion) Forecast by Product Type, 2020 to 2035
  • Table 4: Global Market Volume (Kilotons) Forecast by Product Type, 2020 to 2035
  • Table 5: Global Market Value (USD Billion) Forecast by Form, 2020 to 2035
  • Table 6: Global Market Volume (Kilotons) Forecast by Form, 2020 to 2035
  • Table 7: Global Market Value (USD Billion) Forecast by End Use, 2020 to 2035
  • Table 8: Global Market Volume (Kilotons) Forecast by End Use, 2020 to 2035
  • Table 9: North America Market Value (USD Billion) Forecast by Country, 2020 to 2035
  • Table 10: North America Market Volume (Kilotons) Forecast by Country, 2020 to 2035
  • Table 11: North America Market Value (USD Billion) Forecast by Product Type, 2020 to 2035
  • Table 12: North America Market Volume (Kilotons) Forecast by Product Type, 2020 to 2035
  • Table 13: North America Market Value (USD Billion) Forecast by Form, 2020 to 2035
  • Table 14: North America Market Volume (Kilotons) Forecast by Form, 2020 to 2035
  • Table 15: North America Market Value (USD Billion) Forecast by End Use, 2020 to 2035
  • Table 16: North America Market Volume (Kilotons) Forecast by End Use, 2020 to 2035
  • Table 17: Latin America Market Value (USD Billion) Forecast by Country, 2020 to 2035
  • Table 18: Latin America Market Volume (Kilotons) Forecast by Country, 2020 to 2035
  • Table 19: Latin America Market Value (USD Billion) Forecast by Product Type, 2020 to 2035
  • Table 20: Latin America Market Volume (Kilotons) Forecast by Product Type, 2020 to 2035
  • Table 21: Latin America Market Value (USD Billion) Forecast by Form, 2020 to 2035
  • Table 22: Latin America Market Volume (Kilotons) Forecast by Form, 2020 to 2035
  • Table 23: Latin America Market Value (USD Billion) Forecast by End Use, 2020 to 2035
  • Table 24: Latin America Market Volume (Kilotons) Forecast by End Use, 2020 to 2035
  • Table 25: Western Europe Market Value (USD Billion) Forecast by Country, 2020 to 2035
  • Table 26: Western Europe Market Volume (Kilotons) Forecast by Country, 2020 to 2035
  • Table 27: Western Europe Market Value (USD Billion) Forecast by Product Type, 2020 to 2035
  • Table 28: Western Europe Market Volume (Kilotons) Forecast by Product Type, 2020 to 2035
  • Table 29: Western Europe Market Value (USD Billion) Forecast by Form, 2020 to 2035
  • Table 30: Western Europe Market Volume (Kilotons) Forecast by Form, 2020 to 2035
  • Table 31: Western Europe Market Value (USD Billion) Forecast by End Use, 2020 to 2035
  • Table 32: Western Europe Market Volume (Kilotons) Forecast by End Use, 2020 to 2035
  • Table 33: Eastern Europe Market Value (USD Billion) Forecast by Country, 2020 to 2035
  • Table 34: Eastern Europe Market Volume (Kilotons) Forecast by Country, 2020 to 2035
  • Table 35: Eastern Europe Market Value (USD Billion) Forecast by Product Type, 2020 to 2035
  • Table 36: Eastern Europe Market Volume (Kilotons) Forecast by Product Type, 2020 to 2035
  • Table 37: Eastern Europe Market Value (USD Billion) Forecast by Form, 2020 to 2035
  • Table 38: Eastern Europe Market Volume (Kilotons) Forecast by Form, 2020 to 2035
  • Table 39: Eastern Europe Market Value (USD Billion) Forecast by End Use, 2020 to 2035
  • Table 40: Eastern Europe Market Volume (Kilotons) Forecast by End Use, 2020 to 2035
  • Table 41: East Asia Market Value (USD Billion) Forecast by Country, 2020 to 2035
  • Table 42: East Asia Market Volume (Kilotons) Forecast by Country, 2020 to 2035
  • Table 43: East Asia Market Value (USD Billion) Forecast by Product Type, 2020 to 2035
  • Table 44: East Asia Market Volume (Kilotons) Forecast by Product Type, 2020 to 2035
  • Table 45: East Asia Market Value (USD Billion) Forecast by Form, 2020 to 2035
  • Table 46: East Asia Market Volume (Kilotons) Forecast by Form, 2020 to 2035
  • Table 47: East Asia Market Value (USD Billion) Forecast by End Use, 2020 to 2035
  • Table 48: East Asia Market Volume (Kilotons) Forecast by End Use, 2020 to 2035
  • Table 49: South Asia & Pacific Market Value (USD Billion) Forecast by Country, 2020 to 2035
  • Table 50: South Asia & Pacific Market Volume (Kilotons) Forecast by Country, 2020 to 2035
  • Table 51: South Asia & Pacific Market Value (USD Billion) Forecast by Product Type, 2020 to 2035
  • Table 52: South Asia & Pacific Market Volume (Kilotons) Forecast by Product Type, 2020 to 2035
  • Table 53: South Asia & Pacific Market Value (USD Billion) Forecast by Form, 2020 to 2035
  • Table 54: South Asia & Pacific Market Volume (Kilotons) Forecast by Form, 2020 to 2035
  • Table 55: South Asia & Pacific Market Value (USD Billion) Forecast by End Use, 2020 to 2035
  • Table 56: South Asia & Pacific Market Volume (Kilotons) Forecast by End Use, 2020 to 2035
  • Table 57: Middle East and Africa Market Value (USD Billion) Forecast by Country, 2020 to 2035
  • Table 58: Middle East and Africa Market Volume (Kilotons) Forecast by Country, 2020 to 2035
  • Table 59: Middle East and Africa Market Value (USD Billion) Forecast by Product Type, 2020 to 2035
  • Table 60: Middle East and Africa Market Volume (Kilotons) Forecast by Product Type, 2020 to 2035
  • Table 61: Middle East and Africa Market Value (USD Billion) Forecast by Form, 2020 to 2035
  • Table 62: Middle East and Africa Market Volume (Kilotons) Forecast by Form, 2020 to 2035
  • Table 63: Middle East and Africa Market Value (USD Billion) Forecast by End Use, 2020 to 2035
  • Table 64: Middle East and Africa Market Volume (Kilotons) Forecast by End Use, 2020 to 2035

List of Figures

  • Figure 1: Global Market Volume (Kilotons) Forecast 2020 to 2035
  • Figure 2: Global Market Pricing Analysis
  • Figure 3: Global Market Value (USD Billion) Forecast 2020 to 2035
  • Figure 4: Global Market Value Share and BPS Analysis by Product Type, 2025 and 2035
  • Figure 5: Global Market Y-o-Y Growth Comparison by Product Type, 2025 to 2035
  • Figure 6: Global Market Attractiveness Analysis by Product Type
  • Figure 7: Global Market Value Share and BPS Analysis by Form, 2025 and 2035
  • Figure 8: Global Market Y-o-Y Growth Comparison by Form, 2025 to 2035
  • Figure 9: Global Market Attractiveness Analysis by Form
  • Figure 10: Global Market Value Share and BPS Analysis by End Use, 2025 and 2035
  • Figure 11: Global Market Y-o-Y Growth Comparison by End Use, 2025 to 2035
  • Figure 12: Global Market Attractiveness Analysis by End Use
  • Figure 13: Global Market Value (USD Billion) Share and BPS Analysis by Region, 2025 and 2035
  • Figure 14: Global Market Y-o-Y Growth Comparison by Region, 2025 to 2035
  • Figure 15: Global Market Attractiveness Analysis by Region
  • Figure 16: North America Market Incremental $ Opportunity, 2025 to 2035
  • Figure 17: Latin America Market Incremental $ Opportunity, 2025 to 2035
  • Figure 18: Western Europe Market Incremental $ Opportunity, 2025 to 2035
  • Figure 19: Eastern Europe Market Incremental $ Opportunity, 2025 to 2035
  • Figure 20: East Asia Market Incremental $ Opportunity, 2025 to 2035
  • Figure 21: South Asia & Pacific Market Incremental $ Opportunity, 2025 to 2035
  • Figure 22: Middle East and Africa Market Incremental $ Opportunity, 2025 to 2035
  • Figure 23: North America Market Value Share and BPS Analysis by Country, 2025 and 2035
  • Figure 24: North America Market Value Share and BPS Analysis by Product Type, 2025 and 2035
  • Figure 25: North America Market Y-o-Y Growth Comparison by Product Type, 2025 to 2035
  • Figure 26: North America Market Attractiveness Analysis by Product Type
  • Figure 27: North America Market Value Share and BPS Analysis by Form, 2025 and 2035
  • Figure 28: North America Market Y-o-Y Growth Comparison by Form, 2025 to 2035
  • Figure 29: North America Market Attractiveness Analysis by Form
  • Figure 30: North America Market Value Share and BPS Analysis by End Use, 2025 and 2035
  • Figure 31: North America Market Y-o-Y Growth Comparison by End Use, 2025 to 2035
  • Figure 32: North America Market Attractiveness Analysis by End Use
  • Figure 33: Latin America Market Value Share and BPS Analysis by Country, 2025 and 2035
  • Figure 34: Latin America Market Value Share and BPS Analysis by Product Type, 2025 and 2035
  • Figure 35: Latin America Market Y-o-Y Growth Comparison by Product Type, 2025 to 2035
  • Figure 36: Latin America Market Attractiveness Analysis by Product Type
  • Figure 37: Latin America Market Value Share and BPS Analysis by Form, 2025 and 2035
  • Figure 38: Latin America Market Y-o-Y Growth Comparison by Form, 2025 to 2035
  • Figure 39: Latin America Market Attractiveness Analysis by Form
  • Figure 40: Latin America Market Value Share and BPS Analysis by End Use, 2025 and 2035
  • Figure 41: Latin America Market Y-o-Y Growth Comparison by End Use, 2025 to 2035
  • Figure 42: Latin America Market Attractiveness Analysis by End Use
  • Figure 43: Western Europe Market Value Share and BPS Analysis by Country, 2025 and 2035
  • Figure 44: Western Europe Market Value Share and BPS Analysis by Product Type, 2025 and 2035
  • Figure 45: Western Europe Market Y-o-Y Growth Comparison by Product Type, 2025 to 2035
  • Figure 46: Western Europe Market Attractiveness Analysis by Product Type
  • Figure 47: Western Europe Market Value Share and BPS Analysis by Form, 2025 and 2035
  • Figure 48: Western Europe Market Y-o-Y Growth Comparison by Form, 2025 to 2035
  • Figure 49: Western Europe Market Attractiveness Analysis by Form
  • Figure 50: Western Europe Market Value Share and BPS Analysis by End Use, 2025 and 2035
  • Figure 51: Western Europe Market Y-o-Y Growth Comparison by End Use, 2025 to 2035
  • Figure 52: Western Europe Market Attractiveness Analysis by End Use
  • Figure 53: Eastern Europe Market Value Share and BPS Analysis by Country, 2025 and 2035
  • Figure 54: Eastern Europe Market Value Share and BPS Analysis by Product Type, 2025 and 2035
  • Figure 55: Eastern Europe Market Y-o-Y Growth Comparison by Product Type, 2025 to 2035
  • Figure 56: Eastern Europe Market Attractiveness Analysis by Product Type
  • Figure 57: Eastern Europe Market Value Share and BPS Analysis by Form, 2025 and 2035
  • Figure 58: Eastern Europe Market Y-o-Y Growth Comparison by Form, 2025 to 2035
  • Figure 59: Eastern Europe Market Attractiveness Analysis by Form
  • Figure 60: Eastern Europe Market Value Share and BPS Analysis by End Use, 2025 and 2035
  • Figure 61: Eastern Europe Market Y-o-Y Growth Comparison by End Use, 2025 to 2035
  • Figure 62: Eastern Europe Market Attractiveness Analysis by End Use
  • Figure 63: East Asia Market Value Share and BPS Analysis by Country, 2025 and 2035
  • Figure 64: East Asia Market Value Share and BPS Analysis by Product Type, 2025 and 2035
  • Figure 65: East Asia Market Y-o-Y Growth Comparison by Product Type, 2025 to 2035
  • Figure 66: East Asia Market Attractiveness Analysis by Product Type
  • Figure 67: East Asia Market Value Share and BPS Analysis by Form, 2025 and 2035
  • Figure 68: East Asia Market Y-o-Y Growth Comparison by Form, 2025 to 2035
  • Figure 69: East Asia Market Attractiveness Analysis by Form
  • Figure 70: East Asia Market Value Share and BPS Analysis by End Use, 2025 and 2035
  • Figure 71: East Asia Market Y-o-Y Growth Comparison by End Use, 2025 to 2035
  • Figure 72: East Asia Market Attractiveness Analysis by End Use
  • Figure 73: South Asia & Pacific Market Value Share and BPS Analysis by Country, 2025 and 2035
  • Figure 74: South Asia & Pacific Market Value Share and BPS Analysis by Product Type, 2025 and 2035
  • Figure 75: South Asia & Pacific Market Y-o-Y Growth Comparison by Product Type, 2025 to 2035
  • Figure 76: South Asia & Pacific Market Attractiveness Analysis by Product Type
  • Figure 77: South Asia & Pacific Market Value Share and BPS Analysis by Form, 2025 and 2035
  • Figure 78: South Asia & Pacific Market Y-o-Y Growth Comparison by Form, 2025 to 2035
  • Figure 79: South Asia & Pacific Market Attractiveness Analysis by Form
  • Figure 80: South Asia & Pacific Market Value Share and BPS Analysis by End Use, 2025 and 2035
  • Figure 81: South Asia & Pacific Market Y-o-Y Growth Comparison by End Use, 2025 to 2035
  • Figure 82: South Asia & Pacific Market Attractiveness Analysis by End Use
  • Figure 83: Middle East and Africa Market Value Share and BPS Analysis by Country, 2025 and 2035
  • Figure 84: Middle East and Africa Market Value Share and BPS Analysis by Product Type, 2025 and 2035
  • Figure 85: Middle East and Africa Market Y-o-Y Growth Comparison by Product Type, 2025 to 2035
  • Figure 86: Middle East and Africa Market Attractiveness Analysis by Product Type
  • Figure 87: Middle East and Africa Market Value Share and BPS Analysis by Form, 2025 and 2035
  • Figure 88: Middle East and Africa Market Y-o-Y Growth Comparison by Form, 2025 to 2035
  • Figure 89: Middle East and Africa Market Attractiveness Analysis by Form
  • Figure 90: Middle East and Africa Market Value Share and BPS Analysis by End Use, 2025 and 2035
  • Figure 91: Middle East and Africa Market Y-o-Y Growth Comparison by End Use, 2025 to 2035
  • Figure 92: Middle East and Africa Market Attractiveness Analysis by End Use
  • Figure 93: Global Market - Tier Structure Analysis
  • Figure 94: Global Market - Company Share Analysis

Frequently Asked Questions

What is the projected size of the chocolate flavoring compounds market in 2025?

The market size is valued at USD 40.7 billion in 2025.

What is the outlook on the demand for chocolate flavoring compounds by 2035?

The market is forecasted to reach USD 66.3 billion by 2035, reflecting a CAGR of 5.0%.

Which product type leads the chocolate flavoring compounds market in 2025?

Milk chocolate is expected to lead the market with a 45% share in 2025.

What is the projected share of confectionery in the end-use segment of the chocolate flavoring compounds market by 2025?

Confectionery is projected to hold a 40% share of the market in 2025.

Which country is projected to have the fastest-growing chocolate flavoring compounds market?

The UK is anticipated to be the fastest-growing market with a CAGR of 6.3% from 2025 to 2035.

Explore Similar Insights

Future Market Insights

Chocolate Flavoring Compounds Market