Chocolate Powdered Drinks Market Outlook for 2024 to 2034

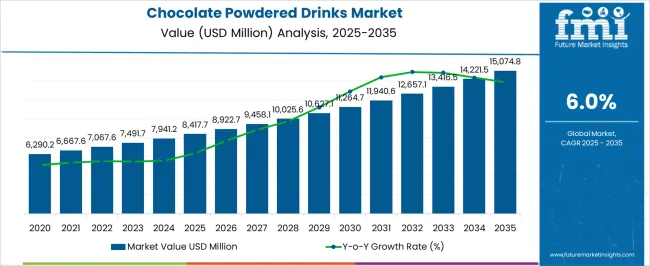
The global chocolate powdered drinks market is estimated to stand at US$ 7,941.2 million in 2024. The market valuation is projected to witness US$ 14,168.2 million by 2034, registering a CAGR of 6%.

The market is experiencing growth, fueled by increasing consumer demand for convenient and indulgent beverages. With a diverse range of products, including hot chocolate mixes, chocolate-flavored milk powders, and instant cocoa blends, the market caters to varied taste preferences.

Key factors driving this growth include the rising trend of at-home consumption, busy lifestyles, and a growing affinity for premium and functional ingredients. Manufacturers are innovating to meet evolving consumer expectations, introducing sugar-free options and incorporating natural ingredients.

Strategic marketing efforts, appealing packaging, and technology integration in distribution channels contribute to the market expansion. As the market continues to evolve, sustained innovation, health-conscious offerings, and strategic partnerships are likely to shape its trajectory.

Key Highlights

  • The market is experiencing significant expansion, driven by robust consumer demand for convenient and indulgent beverage options.
  • The market offers various products, including hot chocolate mixes, chocolate-flavored milk powders, and instant cocoa blends, catering to diverse tastes.
  • Increasing at-home consumption trends contribute to the market growth, reflecting changing consumer lifestyles and preferences.
  • Consumers are growing in preference for premium and functional ingredients in chocolate powdered drinks, prompting manufacturers to innovate and elevate product offerings.
Attributes Details
Estimated Market Size in 2024 US$ 7,941.2 million
Projected Market Size in 2034 US$ 14,168.2 million
Value-based CAGR from 2024 to 2034 6%

Historical Performance and Future Growth of the Chocolate Powdered Drinks Market

The section presents a detailed analysis of the chocolate powdered drinks industry over the past 5 years, highlighting its projected growth trends. With a historical CAGR standing at 5.7%, the market is witnessing a consistent upward momentum. The industry is expected to witness a remarkable CAGR of 6% through 2034.

Historical CAGR 5.7%
Forecast CAGR 6%

The higher forecasted CAGR suggests optimism regarding the future performance of the market, potentially driven by factors such as evolving consumer preferences, product innovations, and market expansion strategies by industry players.

Important factors that are anticipated to impact the demand for chocolate powdered drinks through 2034.

  • Shifting consumer preferences towards convenient and indulgent beverage options, particularly in the chocolate category, are likely to fuel market growth.
  • Continuous innovation by manufacturers, such as the introduction of new flavors, healthier formulations, and premium ingredients, will attract consumers and drive market expansion.
  • The integration of health-conscious elements, like sugar-free alternatives and natural ingredients, aligns with the prevailing health and wellness trends, attracting a broader consumer demographic.
  • The growing prevalence of e-commerce and digital platforms facilitates easier access for consumers, promoting convenience and contributing to market growth.
  • Effective marketing strategies, including branding, promotions, and advertising, will play a pivotal role in creating consumer awareness and sustaining market demand.

Key Trends and Opportunities Influencing the Chocolate Powdered Drinks Market

Attributes Details
Trends
  • Ongoing trends in flavor innovation, with manufacturers introducing unique and exotic flavors, cater to diverse consumer palates, and sustain market interest.
  • Increasing consumer demand for functional ingredients, such as superfoods or adaptogens, reflects a growing interest in health-conscious choices in chocolate powdered drinks.
  • The adoption of convenient and on-the-go packaging formats, like single-serve sachets or portion-controlled packaging, aligns with evolving consumer lifestyles and enhances product accessibility.
Opportunities
  • Leveraging digital marketing channels allows connecting with a wider audience, creating brand awareness, and engaging consumers in an increasingly online-centric marketplace.
  • Capitalizing on the growing demand for health-conscious products, manufacturers have the opportunity to develop and market chocolate powdered drinks with reduced sugar content, natural sweeteners, and added functional benefits.

Country-wise Analysis

The section analyzes the market across key countries, including the United States, Germany, the United Kingdom, France, and China. The section delves into the specific factors driving the demand, adoption, and sales of chocolate powdered drinks in these countries.

Countries Forecast CAGR from 2024 to 2034
United States 5.1%
United Kingdom 4.4%
Germany 4.9%
China 6.5%
France 5.9%

The United States Market Witnesses a Boom in Chocolate Powdered Drinks

With a forecasted CAGR of 5.1%, the United States market anticipates steady growth.

  • The presence of a well-established consumer base in the United States provides a stable foundation for the market.
  • The familiarity and existing preference for such products create a conducive environment for sustained market demand.
  • The prevalent culture of at-home consumption in the United States aligns with the convenience of chocolate powdered drinks.
  • The market can capitalize on this trend by offering chocolate powdered drinks with reduced sugar content, natural ingredients, and other health-oriented features.

Rise in Consumer Needs for Chocolate Powdered Drinks Surges the United Kingdom Market

The market in the United Kingdom is expected to grow at a rate of 4.4%.

  • The market faces competition from various beverage choices, impacting the adoption rate for chocolate powdered drinks.
  • Manufacturers can explore product diversification to cater to broader consumer preferences.
  • Recognizing and addressing evolving consumer needs is vital for sustained market relevance.

Usage of High-Quality and Premium Ingredients Boosts the Germany Market

The market in Germany foresees a CAGR of 4.9%, indicating moderate growth.

  • Consumers in Germany place a premium on the overall quality and excellence of chocolate powdered drinks, influencing their purchasing decisions.
  • Using high-quality and premium ingredients enhances the perceived value of chocolate powdered drinks, aligning with German consumer preferences.
  • Manufacturers can capitalize on this by incorporating sustainable sourcing, production, and packaging practices, resonating with environmentally conscious consumers.

Adoption of Urban Lifestyles and E-commerce Channels Fuels the China Market

With a forecasted CAGR of 6.5%, the market in China demonstrates significant growth potential.

  • A rising middle-income demographic often translates to increased disposable income, fostering greater consumer spending on indulgent and convenient products.
  • Urban lifestyles often involve faster-paced routines, making convenient and on-the-go beverage options like chocolate powdered drinks more appealing.
  • The curiosity of consumers in China and their appreciation for Western flavors and drinking habits create opportunities for the adoption of chocolate powdered drinks.
  • Manufacturers can capitalize on the rising popularity of e-commerce channels in China.

Highlighting Positive Cultural Appreciation Drives the Market in France

The market in France is projected to grow at a rate of 5.9%.

  • Incorporating high-quality components enhances the perceived value of the product and aligns with the cultural preference for premium offerings.
  • Tailoring flavors and formulations to match the preferences of the consumers of France ensures that the products resonate with the cultural palate.
  • Promoting the artisanal and handcrafted aspects of chocolate powdered drinks resonates with the cultural appreciation for craftsmanship.

Category-wise Analysis

This section focuses on providing detailed insights into specific categories in the chocolate powdered drinks industry. The analysis delves into two key attributes, the dark chocolate product type segment and the dairy nature type.

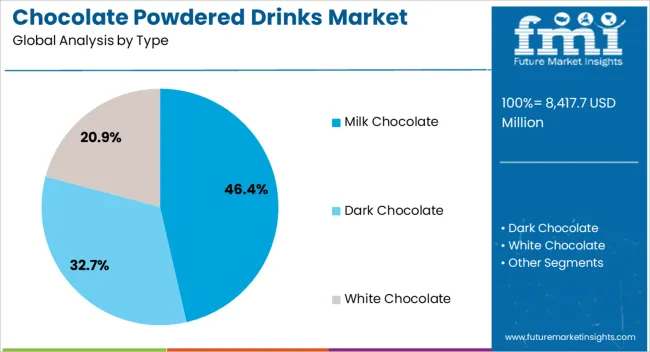
Dark Chocolate Segment to Hold a 32% Share in 2024

Attributes Details
Top Type Dark Chocolate
Market Share in 2024 32%

The dark chocolate segment is expected to hold a substantial market share, accounting for 32% in 2024. The preference for this segment is attributed due to several factors

  • The substantial market share reflects an increasing demand for high-quality, premium dark chocolate products.
  • Consumer awareness of health benefits associated with dark chocolate, such as antioxidants, influences their purchasing decisions.
  • Manufacturers are likely investing in continuous innovation within the dark chocolate segment to meet evolving consumer expectations.

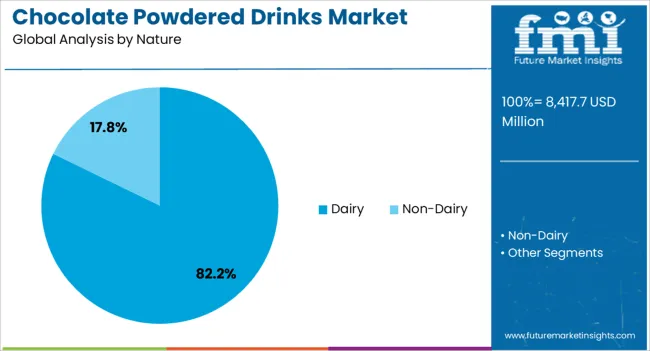
Dairy Segment to Witness a Market Share of 82.3% in 2024

Attributes Details
Top Nature Type Dairy
Market Share in 2024 82.3%

The dairy segment is poised to hold a commanding market share, reaching 82.3% in 2024. The reasons that led to the dominance of this sector
  • The high market share underscores the prevalence of dairy-based products in the market, highlighting their widespread acceptance among consumers.
  • The significant market share suggests a strong consumer preference for products with a dairy nature.
  • Consumers tend to favor products rooted in familiar and traditional culinary practices, contributing to the sustained popularity of dairy-based offerings.
  • New formulations, flavors, and product varieties within the dairy category contribute to meeting diverse consumer expectations and preferences.

Competitive Landscape

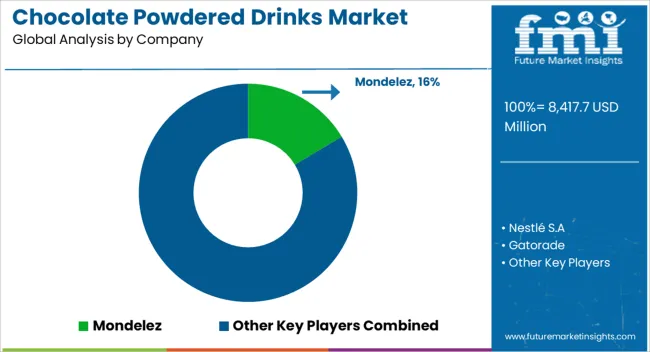
In the competitive landscape of the chocolate powdered drinks market, numerous players vie for market share and consumer attention. Established industry giants and emerging contenders contribute to a dynamic innovation environment and strategic initiatives.

Marketing strategies are pivotal, encompassing branding, promotions, and advertising efforts to enhance product visibility and consumer engagement. The integration of technology in distribution channels and e-commerce platforms has become increasingly significant, offering consumers convenient access to a diverse range of chocolate powdered drinks.

Some of the recent developments are

  • In July 2022, Danone unveiled three new products in China, leveraging online channels such as Tmall and Douyin. These products are described as drinks infused with probiotics, aligning with the growing consumer interest in gut health and functional beverages.
  • In May 2022, KT Tape entered the market with a new product named KTHealth+ AIM drink mix. This product launch reflects the broader trend of consumers seeking wellness-oriented and natural alternatives.

Key Market Players

  • Mondelez
  • Nestlé S.A
  • Gatorade
  • Mars Inc.
  • GlaxoSmithKline Plc
  • PepsiCo Inc.
  • Kanegrade Ltd
  • Barry Callebaut AG
  • Olam International
  • BD Associates Ghana Ltd

Report Scope

Attributes Details
Estimated Market Size in 2024 US$ 7,941.2 million
Projected Market Valuation in 2034 US$ 14,168.2 million
Value-based CAGR 2024 to 2034 6%
Forecast Period 2024 to 2034
Historical Data Available for 2019 to 2023
Market Analysis Value in US$ billion
Key Regions Covered
  • North America
  • Latin America
  • Western Europe
  • Eastern Europe
  • South Asia and Pacific
  • East Asia
  • Middle East and Africa
Key Market Segments Covered
  • Product Type
  • Crop Type
  • Region
Key Countries Profiled
  • The United States
  • Canada
  • Brazil
  • Mexico
  • Germany
  • The United Kingdom
  • France
  • Spain
  • Italy
  • Russia
  • Poland
  • Czech Republic
  • Romania
  • India
  • Bangladesh
  • Australia
  • New Zealand
  • China
  • Japan
  • South Korea
  • GCC countries
  • South Africa
  • Israel
Key Companies Profiled
  • Mondelez
  • Nestlé S.A
  • Gatorade
  • Mars Inc.
  • GlaxoSmithKline Plc
  • PepsiCo Inc.
  • Kanegrade Ltd
  • Barry Callebaut AG
  • Olam International
  • BD Associates Ghana Ltd

Key Segments

By Type:

  • White Chocolate
  • Dark Chocolate
  • Milk Chocolate

By Nature:

  • Dairy
  • Non-Dairy

By Region:

  • North America
  • Latin America
  • Western Europe
  • Eastern Europe
  • South Asia and Pacific
  • East Asia
  • Middle East and Africa

Table of Content

1. Executive Summary

    1.1. Global Market Outlook

    1.2. Demand-side Trends

    1.3. Supply-side Trends

    1.4. Technology Roadmap Analysis

    1.5. Analysis and Recommendations

2. Market Overview

    2.1. Market Coverage / Taxonomy

    2.2. Market Definition / Scope / Limitations

3. Market Background

    3.1. Market Dynamics

        3.1.1. Drivers

        3.1.2. Restraints

        3.1.3. Opportunity

        3.1.4. Trends

    3.2. Scenario Forecast

        3.2.1. Demand in Optimistic Scenario

        3.2.2. Demand in Likely Scenario

        3.2.3. Demand in Conservative Scenario

    3.3. Opportunity Map Analysis

    3.4. Product Life Cycle Analysis

    3.5. Supply Chain Analysis

        3.5.1. Supply Side Participants and their Roles

            3.5.1.1. Producers

            3.5.1.2. Mid-Level Participants (Traders/ Agents/ Brokers)

            3.5.1.3. Wholesalers and Distributors

        3.5.2. Value Added and Value Created at Node in the Supply Chain

        3.5.3. List of Raw Material Suppliers

        3.5.4. List of Existing and Potential Buyer’s

    3.6. Investment Feasibility Matrix

    3.7. Value Chain Analysis

        3.7.1. Profit Margin Analysis

        3.7.2. Wholesalers and Distributors

        3.7.3. Retailers

    3.8. PESTLE and Porter’s Analysis

    3.9. Regulatory Landscape

        3.9.1. By Key Regions

        3.9.2. By Key Countries

    3.10. Regional Parent Market Outlook

    3.11. Production and Consumption Statistics

    3.12. Import and Export Statistics

4. Global Market Analysis 2019 to 2023 and Forecast, 2024 to 2034

    4.1. Historical Market Size Value (US$ Million) & Volume (Unit Pack) Analysis, 2019 to 2023

    4.2. Current and Future Market Size Value (US$ Million) & Volume (Unit Pack) Projections, 2024 to 2034

        4.2.1. Y-o-Y Growth Trend Analysis

        4.2.2. Absolute $ Opportunity Analysis

5. Global Market Analysis 2019 to 2023 and Forecast 2024 to 2034, By Type

    5.1. Introduction / Key Findings

    5.2. Historical Market Size Value (US$ Million) & Volume (Unit Pack) Analysis By Type, 2019 to 2023

    5.3. Current and Future Market Size Value (US$ Million) & Volume (Unit Pack) Analysis and Forecast By Type, 2024 to 2034

        5.3.1. White Chocolate

        5.3.2. Dark Chocolate

        5.3.3. Milk Chocolate

    5.4. Y-o-Y Growth Trend Analysis By Type, 2019 to 2023

    5.5. Absolute $ Opportunity Analysis By Type, 2024 to 2034

6. Global Market Analysis 2019 to 2023 and Forecast 2024 to 2034, By Nature

    6.1. Introduction / Key Findings

    6.2. Historical Market Size Value (US$ Million) & Volume (Unit Pack) Analysis By Application, 2019 to 2023

    6.3. Current and Future Market Size Value (US$ Million) & Volume (Unit Pack) Analysis and Forecast By Nature plication, 2024 to 2034

        6.3.1. Dairy

        6.3.2. Non-Dairy

7. Global Market Analysis 2019 to 2023 and Forecast 2024 to 2034, By Region

    7.1. Introduction

    7.2. Historical Market Size Value (US$ Million) & Volume (Unit Pack) Analysis By Region, 2017-2023

    7.3. Current Market Size Value (US$ Million) & Volume (Unit Pack) Analysis and Forecast By Region, 2024 to 2034

        7.3.1. North America

        7.3.2. Latin America

        7.3.3. Western Europe

        7.3.4. Eastern Europe

        7.3.5. South Asia and Pacific

        7.3.6. East Asia

        7.3.7. Middle East and Africa

    7.4. Market Attractiveness Analysis By Region

8. North America Market Analysis 2019 to 2023 and Forecast 2024 to 2034, By Country

    8.1. Historical Market Size Value (US$ Million) & Volume (Unit Pack) Trend Analysis By Market Taxonomy, 2019 to 2023

    8.2. Market Size Value (US$ Million) & Volume (Unit Pack) Forecast By Market Taxonomy, 2024 to 2034

        8.2.1. By Country

            8.2.1.1. USA

            8.2.1.2. Canada

        8.2.2. By Type

        8.2.3. By Nature

    8.3. Market Attractiveness Analysis

        8.3.1. By Country

        8.3.2. By Type

        8.3.3. By Nature

    8.4. Key Takeaways

9. Latin America Market Analysis 2019 to 2023 and Forecast 2024 to 2034, By Country

    9.1. Historical Market Size Value (US$ Million) & Volume (Unit Pack) Trend Analysis By Market Taxonomy, 2019 to 2023

    9.2. Market Size Value (US$ Million) & Volume (Unit Pack) Forecast By Market Taxonomy, 2024 to 2034

        9.2.1. By Country

            9.2.1.1. Brazil

            9.2.1.2. Mexico

            9.2.1.3. Rest of Latin America

        9.2.2. By Type

        9.2.3. By Nature

    9.3. Market Attractiveness Analysis

        9.3.1. By Country

        9.3.2. By Type

        9.3.3. By Nature

    9.4. Key Takeaways

10. Western Europe Market Analysis 2019 to 2023 and Forecast 2024 to 2034, By Country

    10.1. Historical Market Size Value (US$ Million) & Volume (Unit Pack) Trend Analysis By Market Taxonomy, 2019 to 2023

    10.2. Market Size Value (US$ Million) & Volume (Unit Pack) Forecast By Market Taxonomy, 2024 to 2034

        10.2.1. By Country

            10.2.1.1. Germany

            10.2.1.2. UK

            10.2.1.3. France

            10.2.1.4. Spain

            10.2.1.5. Italy

            10.2.1.6. Rest of Western Europe

        10.2.2. By Type

        10.2.3. By Nature

    10.3. Market Attractiveness Analysis

        10.3.1. By Country

        10.3.2. By Type

        10.3.3. By Nature

    10.4. Key Takeaways

11. Eastern Europe Market Analysis 2019 to 2023 and Forecast 2024 to 2034, By Country

    11.1. Historical Market Size Value (US$ Million) & Volume (Unit Pack) Trend Analysis By Market Taxonomy, 2019 to 2023

    11.2. Market Size Value (US$ Million) & Volume (Unit Pack) Forecast By Market Taxonomy, 2024 to 2034

        11.2.1. By Country

            11.2.1.1. Poland

            11.2.1.2. Russia

            11.2.1.3. Czech Republic

            11.2.1.4. Romania

            11.2.1.5. Rest of Eastern Europe

        11.2.2. By Type

        11.2.3. By Nature

    11.3. Market Attractiveness Analysis

        11.3.1. By Country

        11.3.2. By Type

        11.3.3. By Nature

    11.4. Key Takeaways

12. South Asia and Pacific Market Analysis 2019 to 2023 and Forecast 2024 to 2034, By Country

    12.1. Historical Market Size Value (US$ Million) & Volume (Unit Pack) Trend Analysis By Market Taxonomy, 2019 to 2023

    12.2. Market Size Value (US$ Million) & Volume (Unit Pack) Forecast By Market Taxonomy, 2024 to 2034

        12.2.1. By Country

            12.2.1.1. India

            12.2.1.2. Bangladesh

            12.2.1.3. Australia

            12.2.1.4. New Zealand

            12.2.1.5. Rest of South Asia and Pacific

        12.2.2. By Type

        12.2.3. By Nature

    12.3. Market Attractiveness Analysis

        12.3.1. By Country

        12.3.2. By Type

        12.3.3. By Nature

    12.4. Key Takeaways

13. East Asia Market Analysis 2019 to 2023 and Forecast 2024 to 2034, By Country

    13.1. Historical Market Size Value (US$ Million) & Volume (Unit Pack) Trend Analysis By Market Taxonomy, 2019 to 2023

    13.2. Market Size Value (US$ Million) & Volume (Unit Pack) Forecast By Market Taxonomy, 2024 to 2034

        13.2.1. By Country

            13.2.1.1. China

            13.2.1.2. Japan

            13.2.1.3. South Korea

        13.2.2. By Type

        13.2.3. By Application

        13.2.4. By Distribution Channel

        13.2.5. By Age Group

    13.3. Market Attractiveness Analysis

        13.3.1. By Country

        13.3.2. By Type

        13.3.3. By Application

        13.3.4. By Distribution Channel

        13.3.5. By Age Group

    13.4. Key Takeaways

14. Middle East and Africa Market Analysis 2019 to 2023 and Forecast 2024 to 2034, By Country

    14.1. Historical Market Size Value (US$ Million) & Volume (Unit Pack) Trend Analysis By Market Taxonomy, 2019 to 2023

    14.2. Market Size Value (US$ Million) & Volume (Unit Pack) Forecast By Market Taxonomy, 2024 to 2034

        14.2.1. By Country

            14.2.1.1. GCC Countries

            14.2.1.2. South Africa

            14.2.1.3. Israel

            14.2.1.4. Rest of MEA

        14.2.2. By Type

        14.2.3. By Nature

    14.3. Market Attractiveness Analysis

        14.3.1. By Country

        14.3.2. By Type

        14.3.3. By Nature

    14.4. Key Takeaways

15. Key Countries Market Analysis

    15.1. USA

        15.1.1. Pricing Analysis

        15.1.2. Market Share Analysis, 2023

            15.1.2.1. By Type

            15.1.2.2. By Nature

    15.2. Canada

        15.2.1. Pricing Analysis

        15.2.2. Market Share Analysis, 2023

            15.2.2.1. By Type

            15.2.2.2. By Application

            15.2.2.3. By Distribution Channel

            15.2.2.4. By Age Group

    15.3. Brazil

        15.3.1. Pricing Analysis

        15.3.2. Market Share Analysis, 2023

            15.3.2.1. By Type

            15.3.2.2. By Application

            15.3.2.3. By Distribution Channel

            15.3.2.4. By Age Group

    15.4. Mexico

        15.4.1. Pricing Analysis

        15.4.2. Market Share Analysis, 2023

            15.4.2.1. By Type

            15.4.2.2. By Application

            15.4.2.3. By Distribution Channel

            15.4.2.4. By Age Group

    15.5. Germany

        15.5.1. Pricing Analysis

        15.5.2. Market Share Analysis, 2023

            15.5.2.1. By Type

            15.5.2.2. By Application

            15.5.2.3. By Distribution Channel

            15.5.2.4. By Age Group

    15.6. UK

        15.6.1. Pricing Analysis

        15.6.2. Market Share Analysis, 2023

            15.6.2.1. By Type

            15.6.2.2. By Application

            15.6.2.3. By Distribution Channel

            15.6.2.4. By Age Group

    15.7. France

        15.7.1. Pricing Analysis

        15.7.2. Market Share Analysis, 2023

            15.7.2.1. By Type

            15.7.2.2. By Application

            15.7.2.3. By Distribution Channel

            15.7.2.4. By Age Group

    15.8. Spain

        15.8.1. Pricing Analysis

        15.8.2. Market Share Analysis, 2023

            15.8.2.1. By Type

            15.8.2.2. By Application

            15.8.2.3. By Distribution Channel

            15.8.2.4. By Age Group

    15.9. Italy

        15.9.1. Pricing Analysis

        15.9.2. Market Share Analysis, 2023

            15.9.2.1. By Type

            15.9.2.2. By Application

            15.9.2.3. By Distribution Channel

            15.9.2.4. By Age Group

    15.10. Poland

        15.10.1. Pricing Analysis

        15.10.2. Market Share Analysis, 2023

            15.10.2.1. By Type

            15.10.2.2. By Application

            15.10.2.3. By Distribution Channel

            15.10.2.4. By Age Group

    15.11. Russia

        15.11.1. Pricing Analysis

        15.11.2. Market Share Analysis, 2023

            15.11.2.1. By Type

            15.11.2.2. By Application

            15.11.2.3. By Distribution Channel

            15.11.2.4. By Age Group

    15.12. Czech Republic

        15.12.1. Pricing Analysis

        15.12.2. Market Share Analysis, 2023

            15.12.2.1. By Type

            15.12.2.2. By Application

            15.12.2.3. By Distribution Channel

            15.12.2.4. By Age Group

    15.13. Romania

        15.13.1. Pricing Analysis

        15.13.2. Market Share Analysis, 2023

            15.13.2.1. By Type

            15.13.2.2. By Application

            15.13.2.3. By Distribution Channel

            15.13.2.4. By Age Group

    15.14. India

        15.14.1. Pricing Analysis

        15.14.2. Market Share Analysis, 2023

            15.14.2.1. By Type

            15.14.2.2. By Application

            15.14.2.3. By Distribution Channel

            15.14.2.4. By Age Group

    15.15. Bangladesh

        15.15.1. Pricing Analysis

        15.15.2. Market Share Analysis, 2023

            15.15.2.1. By Type

            15.15.2.2. By Application

            15.15.2.3. By Distribution Channel

            15.15.2.4. By Age Group

    15.16. Australia

        15.16.1. Pricing Analysis

        15.16.2. Market Share Analysis, 2023

            15.16.2.1. By Type

            15.16.2.2. By Application

            15.16.2.3. By Distribution Channel

            15.16.2.4. By Age Group

    15.17. New Zealand

        15.17.1. Pricing Analysis

        15.17.2. Market Share Analysis, 2023

            15.17.2.1. By Type

            15.17.2.2. By Application

            15.17.2.3. By Distribution Channel

            15.17.2.4. By Age Group

    15.18. China

        15.18.1. Pricing Analysis

        15.18.2. Market Share Analysis, 2023

            15.18.2.1. By Type

            15.18.2.2. By Application

            15.18.2.3. By Distribution Channel

            15.18.2.4. By Age Group

    15.19. Japan

        15.19.1. Pricing Analysis

        15.19.2. Market Share Analysis, 2023

            15.19.2.1. By Type

            15.19.2.2. By Application

            15.19.2.3. By Distribution Channel

            15.19.2.4. By Age Group

    15.20. South Korea

        15.20.1. Pricing Analysis

        15.20.2. Market Share Analysis, 2023

            15.20.2.1. By Type

            15.20.2.2. By Application

            15.20.2.3. By Distribution Channel

            15.20.2.4. By Age Group

    15.21. GCC Countries

        15.21.1. Pricing Analysis

        15.21.2. Market Share Analysis, 2023

            15.21.2.1. By Type

            15.21.2.2. By Application

            15.21.2.3. By Distribution Channel

            15.21.2.4. By Age Group

    15.22. South Africa

        15.22.1. Pricing Analysis

        15.22.2. Market Share Analysis, 2023

            15.22.2.1. By Type

            15.22.2.2. By Application

            15.22.2.3. By Distribution Channel

            15.22.2.4. By Age Group

    15.23. Israel

        15.23.1. Pricing Analysis

        15.23.2. Market Share Analysis, 2023

            15.23.2.1. By Type

            15.23.2.2. By Application

            15.23.2.3. By Distribution Channel

            15.23.2.4. By Age Group

16. Competition Analysis

    16.1. Competition Deep Dive

        16.1.1. Mondelez

            16.1.1.1. Overview

            16.1.1.2. Product Portfolio

            16.1.1.3. Profitability by Market Segments

            16.1.1.4. Sales Footprint

            16.1.1.5. Strategy Overview

                16.1.1.5.1. Marketing Strategy

                16.1.1.5.2. Product Strategy

                16.1.1.5.3. Channel Strategy

        16.1.2. Nestlé S.A

            16.1.2.1. Overview

            16.1.2.2. Product Portfolio

            16.1.2.3. Profitability by Market Segments

            16.1.2.4. Sales Footprint

            16.1.2.5. Strategy Overview

                16.1.2.5.1. Marketing Strategy

                16.1.2.5.2. Product Strategy

                16.1.2.5.3. Channel Strategy

        16.1.3. Gatorade

            16.1.3.1. Overview

            16.1.3.2. Product Portfolio

            16.1.3.3. Profitability by Market Segments

            16.1.3.4. Sales Footprint

            16.1.3.5. Strategy Overview

                16.1.3.5.1. Marketing Strategy

                16.1.3.5.2. Product Strategy

                16.1.3.5.3. Channel Strategy

        16.1.4. Mars Inc.

            16.1.4.1. Overview

            16.1.4.2. Product Portfolio

            16.1.4.3. Profitability by Market Segments

            16.1.4.4. Sales Footprint

            16.1.4.5. Strategy Overview

                16.1.4.5.1. Marketing Strategy

                16.1.4.5.2. Product Strategy

                16.1.4.5.3. Channel Strategy

        16.1.5. GlaxoSmithKline Plc

            16.1.5.1. Overview

            16.1.5.2. Product Portfolio

            16.1.5.3. Profitability by Market Segments

            16.1.5.4. Sales Footprint

            16.1.5.5. Strategy Overview

                16.1.5.5.1. Marketing Strategy

                16.1.5.5.2. Product Strategy

                16.1.5.5.3. Channel Strategy

        16.1.6. PepsiCo Inc.

            16.1.6.1. Overview

            16.1.6.2. Product Portfolio

            16.1.6.3. Profitability by Market Segments

            16.1.6.4. Sales Footprint

            16.1.6.5. Strategy Overview

                16.1.6.5.1. Marketing Strategy

                16.1.6.5.2. Product Strategy

                16.1.6.5.3. Channel Strategy

        16.1.7. Kanegrade Ltd

            16.1.7.1. Overview

            16.1.7.2. Product Portfolio

            16.1.7.3. Profitability by Market Segments

            16.1.7.4. Sales Footprint

            16.1.7.5. Strategy Overview

                16.1.7.5.1. Marketing Strategy

                16.1.7.5.2. Product Strategy

                16.1.7.5.3. Channel Strategy

        16.1.8. Barry Callebaut AG

            16.1.8.1. Overview

            16.1.8.2. Product Portfolio

            16.1.8.3. Profitability by Market Segments

            16.1.8.4. Sales Footprint

            16.1.8.5. Strategy Overview

                16.1.8.5.1. Marketing Strategy

                16.1.8.5.2. Product Strategy

                16.1.8.5.3. Channel Strategy

        16.1.9. Olam International

            16.1.9.1. Overview

            16.1.9.2. Product Portfolio

            16.1.9.3. Profitability by Market Segments

            16.1.9.4. Sales Footprint

            16.1.9.5. Strategy Overview

                16.1.9.5.1. Marketing Strategy

                16.1.9.5.2. Product Strategy

                16.1.9.5.3. Channel Strategy

        16.1.10. BD Associates Ghana Ltd

            16.1.10.1. Overview

            16.1.10.2. Product Portfolio

            16.1.10.3. Profitability by Market Segments

            16.1.10.4. Sales Footprint

            16.1.10.5. Strategy Overview

                16.1.10.5.1. Marketing Strategy

                16.1.10.5.2. Product Strategy

                16.1.10.5.3. Channel Strategy

17. Assumptions & Acronyms Used

18. Research Methodology

List of Tables

Table 1: Global Market Value (US$ Million) Forecast by Region, 2019 to 2034

Table 2: Global Market Volume (Unit Pack) Forecast by Region, 2019 to 2034

Table 3: Global Market Value (US$ Million) Forecast by Type, 2019 to 2034

Table 4: Global Market Volume (Unit Pack) Forecast by Type, 2019 to 2034

Table 5: Global Market Value (US$ Million) Forecast by Application, 2019 to 2034

Table 6: Global Market Volume (Unit Pack) Forecast by Application, 2019 to 2034

Table 7: Global Market Value (US$ Million) Forecast by Distribution Channel, 2019 to 2034

Table 8: Global Market Volume (Unit Pack) Forecast by Distribution Channel, 2019 to 2034

Table 9: Global Market Value (US$ Million) Forecast by Age Group, 2019 to 2034

Table 10: Global Market Volume (Unit Pack) Forecast by Age Group, 2019 to 2034

Table 11: North America Market Value (US$ Million) Forecast by Country, 2019 to 2034

Table 12: North America Market Volume (Unit Pack) Forecast by Country, 2019 to 2034

Table 13: North America Market Value (US$ Million) Forecast by Type, 2019 to 2034

Table 14: North America Market Volume (Unit Pack) Forecast by Type, 2019 to 2034

Table 15: North America Market Value (US$ Million) Forecast by Application, 2019 to 2034

Table 16: North America Market Volume (Unit Pack) Forecast by Application, 2019 to 2034

Table 17: North America Market Value (US$ Million) Forecast by Distribution Channel, 2019 to 2034

Table 18: North America Market Volume (Unit Pack) Forecast by Distribution Channel, 2019 to 2034

Table 19: North America Market Value (US$ Million) Forecast by Age Group, 2019 to 2034

Table 20: North America Market Volume (Unit Pack) Forecast by Age Group, 2019 to 2034

Table 21: Latin America Market Value (US$ Million) Forecast by Country, 2019 to 2034

Table 22: Latin America Market Volume (Unit Pack) Forecast by Country, 2019 to 2034

Table 23: Latin America Market Value (US$ Million) Forecast by Type, 2019 to 2034

Table 24: Latin America Market Volume (Unit Pack) Forecast by Type, 2019 to 2034

Table 25: Latin America Market Value (US$ Million) Forecast by Application, 2019 to 2034

Table 26: Latin America Market Volume (Unit Pack) Forecast by Application, 2019 to 2034

Table 27: Latin America Market Value (US$ Million) Forecast by Distribution Channel, 2019 to 2034

Table 28: Latin America Market Volume (Unit Pack) Forecast by Distribution Channel, 2019 to 2034

Table 29: Latin America Market Value (US$ Million) Forecast by Age Group, 2019 to 2034

Table 30: Latin America Market Volume (Unit Pack) Forecast by Age Group, 2019 to 2034

Table 31: Western Europe Market Value (US$ Million) Forecast by Country, 2019 to 2034

Table 32: Western Europe Market Volume (Unit Pack) Forecast by Country, 2019 to 2034

Table 33: Western Europe Market Value (US$ Million) Forecast by Type, 2019 to 2034

Table 34: Western Europe Market Volume (Unit Pack) Forecast by Type, 2019 to 2034

Table 35: Western Europe Market Value (US$ Million) Forecast by Application, 2019 to 2034

Table 36: Western Europe Market Volume (Unit Pack) Forecast by Application, 2019 to 2034

Table 37: Western Europe Market Value (US$ Million) Forecast by Distribution Channel, 2019 to 2034

Table 38: Western Europe Market Volume (Unit Pack) Forecast by Distribution Channel, 2019 to 2034

Table 39: Western Europe Market Value (US$ Million) Forecast by Age Group, 2019 to 2034

Table 40: Western Europe Market Volume (Unit Pack) Forecast by Age Group, 2019 to 2034

Table 41: Eastern Europe Market Value (US$ Million) Forecast by Country, 2019 to 2034

Table 42: Eastern Europe Market Volume (Unit Pack) Forecast by Country, 2019 to 2034

Table 43: Eastern Europe Market Value (US$ Million) Forecast by Type, 2019 to 2034

Table 44: Eastern Europe Market Volume (Unit Pack) Forecast by Type, 2019 to 2034

Table 45: Eastern Europe Market Value (US$ Million) Forecast by Application, 2019 to 2034

Table 46: Eastern Europe Market Volume (Unit Pack) Forecast by Application, 2019 to 2034

Table 47: Eastern Europe Market Value (US$ Million) Forecast by Distribution Channel, 2019 to 2034

Table 48: Eastern Europe Market Volume (Unit Pack) Forecast by Distribution Channel, 2019 to 2034

Table 49: Eastern Europe Market Value (US$ Million) Forecast by Age Group, 2019 to 2034

Table 50: Eastern Europe Market Volume (Unit Pack) Forecast by Age Group, 2019 to 2034

Table 51: South Asia and Pacific Market Value (US$ Million) Forecast by Country, 2019 to 2034

Table 52: South Asia and Pacific Market Volume (Unit Pack) Forecast by Country, 2019 to 2034

Table 53: South Asia and Pacific Market Value (US$ Million) Forecast by Type, 2019 to 2034

Table 54: South Asia and Pacific Market Volume (Unit Pack) Forecast by Type, 2019 to 2034

Table 55: South Asia and Pacific Market Value (US$ Million) Forecast by Application, 2019 to 2034

Table 56: South Asia and Pacific Market Volume (Unit Pack) Forecast by Application, 2019 to 2034

Table 57: South Asia and Pacific Market Value (US$ Million) Forecast by Distribution Channel, 2019 to 2034

Table 58: South Asia and Pacific Market Volume (Unit Pack) Forecast by Distribution Channel, 2019 to 2034

Table 59: South Asia and Pacific Market Value (US$ Million) Forecast by Age Group, 2019 to 2034

Table 60: South Asia and Pacific Market Volume (Unit Pack) Forecast by Age Group, 2019 to 2034

Table 61: East Asia Market Value (US$ Million) Forecast by Country, 2019 to 2034

Table 62: East Asia Market Volume (Unit Pack) Forecast by Country, 2019 to 2034

Table 63: East Asia Market Value (US$ Million) Forecast by Type, 2019 to 2034

Table 64: East Asia Market Volume (Unit Pack) Forecast by Type, 2019 to 2034

Table 65: East Asia Market Value (US$ Million) Forecast by Application, 2019 to 2034

Table 66: East Asia Market Volume (Unit Pack) Forecast by Application, 2019 to 2034

Table 67: East Asia Market Value (US$ Million) Forecast by Distribution Channel, 2019 to 2034

Table 68: East Asia Market Volume (Unit Pack) Forecast by Distribution Channel, 2019 to 2034

Table 69: East Asia Market Value (US$ Million) Forecast by Age Group, 2019 to 2034

Table 70: East Asia Market Volume (Unit Pack) Forecast by Age Group, 2019 to 2034

Table 71: Middle East and Africa Market Value (US$ Million) Forecast by Country, 2019 to 2034

Table 72: Middle East and Africa Market Volume (Unit Pack) Forecast by Country, 2019 to 2034

Table 73: Middle East and Africa Market Value (US$ Million) Forecast by Type, 2019 to 2034

Table 74: Middle East and Africa Market Volume (Unit Pack) Forecast by Type, 2019 to 2034

Table 75: Middle East and Africa Market Value (US$ Million) Forecast by Application, 2019 to 2034

Table 76: Middle East and Africa Market Volume (Unit Pack) Forecast by Application, 2019 to 2034

Table 77: Middle East and Africa Market Value (US$ Million) Forecast by Distribution Channel, 2019 to 2034

Table 78: Middle East and Africa Market Volume (Unit Pack) Forecast by Distribution Channel, 2019 to 2034

Table 79: Middle East and Africa Market Value (US$ Million) Forecast by Age Group, 2019 to 2034

Table 80: Middle East and Africa Market Volume (Unit Pack) Forecast by Age Group, 2019 to 2034

List of Figures

Figure 1: Global Market Value (US$ Million) by Type, 2024 to 2034

Figure 2: Global Market Value (US$ Million) by Application, 2024 to 2034

Figure 3: Global Market Value (US$ Million) by Distribution Channel, 2024 to 2034

Figure 4: Global Market Value (US$ Million) by Age Group, 2024 to 2034

Figure 5: Global Market Value (US$ Million) by Region, 2024 to 2034

Figure 6: Global Market Value (US$ Million) Analysis by Region, 2019 to 2034

Figure 7: Global Market Volume (Unit Pack) Analysis by Region, 2019 to 2034

Figure 8: Global Market Value Share (%) and BPS Analysis by Region, 2024 to 2034

Figure 9: Global Market Y-o-Y Growth (%) Projections by Region, 2024 to 2034

Figure 10: Global Market Value (US$ Million) Analysis by Type, 2019 to 2034

Figure 11: Global Market Volume (Unit Pack) Analysis by Type, 2019 to 2034

Figure 12: Global Market Value Share (%) and BPS Analysis by Type, 2024 to 2034

Figure 13: Global Market Y-o-Y Growth (%) Projections by Type, 2024 to 2034

Figure 14: Global Market Value (US$ Million) Analysis by Application, 2019 to 2034

Figure 15: Global Market Volume (Unit Pack) Analysis by Application, 2019 to 2034

Figure 16: Global Market Value Share (%) and BPS Analysis by Application, 2024 to 2034

Figure 17: Global Market Y-o-Y Growth (%) Projections by Application, 2024 to 2034

Figure 18: Global Market Value (US$ Million) Analysis by Distribution Channel, 2019 to 2034

Figure 19: Global Market Volume (Unit Pack) Analysis by Distribution Channel, 2019 to 2034

Figure 20: Global Market Value Share (%) and BPS Analysis by Distribution Channel, 2024 to 2034

Figure 21: Global Market Y-o-Y Growth (%) Projections by Distribution Channel, 2024 to 2034

Figure 22: Global Market Value (US$ Million) Analysis by Age Group, 2019 to 2034

Figure 23: Global Market Volume (Unit Pack) Analysis by Age Group, 2019 to 2034

Figure 24: Global Market Value Share (%) and BPS Analysis by Age Group, 2024 to 2034

Figure 25: Global Market Y-o-Y Growth (%) Projections by Age Group, 2024 to 2034

Figure 26: Global Market Attractiveness by Type, 2024 to 2034

Figure 27: Global Market Attractiveness by Application, 2024 to 2034

Figure 28: Global Market Attractiveness by Distribution Channel, 2024 to 2034

Figure 29: Global Market Attractiveness by Age Group, 2024 to 2034

Figure 30: Global Market Attractiveness by Region, 2024 to 2034

Figure 31: North America Market Value (US$ Million) by Type, 2024 to 2034

Figure 32: North America Market Value (US$ Million) by Application, 2024 to 2034

Figure 33: North America Market Value (US$ Million) by Distribution Channel, 2024 to 2034

Figure 34: North America Market Value (US$ Million) by Age Group, 2024 to 2034

Figure 35: North America Market Value (US$ Million) by Country, 2024 to 2034

Figure 36: North America Market Value (US$ Million) Analysis by Country, 2019 to 2034

Figure 37: North America Market Volume (Unit Pack) Analysis by Country, 2019 to 2034

Figure 38: North America Market Value Share (%) and BPS Analysis by Country, 2024 to 2034

Figure 39: North America Market Y-o-Y Growth (%) Projections by Country, 2024 to 2034

Figure 40: North America Market Value (US$ Million) Analysis by Type, 2019 to 2034

Figure 41: North America Market Volume (Unit Pack) Analysis by Type, 2019 to 2034

Figure 42: North America Market Value Share (%) and BPS Analysis by Type, 2024 to 2034

Figure 43: North America Market Y-o-Y Growth (%) Projections by Type, 2024 to 2034

Figure 44: North America Market Value (US$ Million) Analysis by Application, 2019 to 2034

Figure 45: North America Market Volume (Unit Pack) Analysis by Application, 2019 to 2034

Figure 46: North America Market Value Share (%) and BPS Analysis by Application, 2024 to 2034

Figure 47: North America Market Y-o-Y Growth (%) Projections by Application, 2024 to 2034

Figure 48: North America Market Value (US$ Million) Analysis by Distribution Channel, 2019 to 2034

Figure 49: North America Market Volume (Unit Pack) Analysis by Distribution Channel, 2019 to 2034

Figure 50: North America Market Value Share (%) and BPS Analysis by Distribution Channel, 2024 to 2034

Figure 51: North America Market Y-o-Y Growth (%) Projections by Distribution Channel, 2024 to 2034

Figure 52: North America Market Value (US$ Million) Analysis by Age Group, 2019 to 2034

Figure 53: North America Market Volume (Unit Pack) Analysis by Age Group, 2019 to 2034

Figure 54: North America Market Value Share (%) and BPS Analysis by Age Group, 2024 to 2034

Figure 55: North America Market Y-o-Y Growth (%) Projections by Age Group, 2024 to 2034

Figure 56: North America Market Attractiveness by Type, 2024 to 2034

Figure 57: North America Market Attractiveness by Application, 2024 to 2034

Figure 58: North America Market Attractiveness by Distribution Channel, 2024 to 2034

Figure 59: North America Market Attractiveness by Age Group, 2024 to 2034

Figure 60: North America Market Attractiveness by Country, 2024 to 2034

Figure 61: Latin America Market Value (US$ Million) by Type, 2024 to 2034

Figure 62: Latin America Market Value (US$ Million) by Application, 2024 to 2034

Figure 63: Latin America Market Value (US$ Million) by Distribution Channel, 2024 to 2034

Figure 64: Latin America Market Value (US$ Million) by Age Group, 2024 to 2034

Figure 65: Latin America Market Value (US$ Million) by Country, 2024 to 2034

Figure 66: Latin America Market Value (US$ Million) Analysis by Country, 2019 to 2034

Figure 67: Latin America Market Volume (Unit Pack) Analysis by Country, 2019 to 2034

Figure 68: Latin America Market Value Share (%) and BPS Analysis by Country, 2024 to 2034

Figure 69: Latin America Market Y-o-Y Growth (%) Projections by Country, 2024 to 2034

Figure 70: Latin America Market Value (US$ Million) Analysis by Type, 2019 to 2034

Figure 71: Latin America Market Volume (Unit Pack) Analysis by Type, 2019 to 2034

Figure 72: Latin America Market Value Share (%) and BPS Analysis by Type, 2024 to 2034

Figure 73: Latin America Market Y-o-Y Growth (%) Projections by Type, 2024 to 2034

Figure 74: Latin America Market Value (US$ Million) Analysis by Application, 2019 to 2034

Figure 75: Latin America Market Volume (Unit Pack) Analysis by Application, 2019 to 2034

Figure 76: Latin America Market Value Share (%) and BPS Analysis by Application, 2024 to 2034

Figure 77: Latin America Market Y-o-Y Growth (%) Projections by Application, 2024 to 2034

Figure 78: Latin America Market Value (US$ Million) Analysis by Distribution Channel, 2019 to 2034

Figure 79: Latin America Market Volume (Unit Pack) Analysis by Distribution Channel, 2019 to 2034

Figure 80: Latin America Market Value Share (%) and BPS Analysis by Distribution Channel, 2024 to 2034

Figure 81: Latin America Market Y-o-Y Growth (%) Projections by Distribution Channel, 2024 to 2034

Figure 82: Latin America Market Value (US$ Million) Analysis by Age Group, 2019 to 2034

Figure 83: Latin America Market Volume (Unit Pack) Analysis by Age Group, 2019 to 2034

Figure 84: Latin America Market Value Share (%) and BPS Analysis by Age Group, 2024 to 2034

Figure 85: Latin America Market Y-o-Y Growth (%) Projections by Age Group, 2024 to 2034

Figure 86: Latin America Market Attractiveness by Type, 2024 to 2034

Figure 87: Latin America Market Attractiveness by Application, 2024 to 2034

Figure 88: Latin America Market Attractiveness by Distribution Channel, 2024 to 2034

Figure 89: Latin America Market Attractiveness by Age Group, 2024 to 2034

Figure 90: Latin America Market Attractiveness by Country, 2024 to 2034

Figure 91: Western Europe Market Value (US$ Million) by Type, 2024 to 2034

Figure 92: Western Europe Market Value (US$ Million) by Application, 2024 to 2034

Figure 93: Western Europe Market Value (US$ Million) by Distribution Channel, 2024 to 2034

Figure 94: Western Europe Market Value (US$ Million) by Age Group, 2024 to 2034

Figure 95: Western Europe Market Value (US$ Million) by Country, 2024 to 2034

Figure 96: Western Europe Market Value (US$ Million) Analysis by Country, 2019 to 2034

Figure 97: Western Europe Market Volume (Unit Pack) Analysis by Country, 2019 to 2034

Figure 98: Western Europe Market Value Share (%) and BPS Analysis by Country, 2024 to 2034

Figure 99: Western Europe Market Y-o-Y Growth (%) Projections by Country, 2024 to 2034

Figure 100: Western Europe Market Value (US$ Million) Analysis by Type, 2019 to 2034

Figure 101: Western Europe Market Volume (Unit Pack) Analysis by Type, 2019 to 2034

Figure 102: Western Europe Market Value Share (%) and BPS Analysis by Type, 2024 to 2034

Figure 103: Western Europe Market Y-o-Y Growth (%) Projections by Type, 2024 to 2034

Figure 104: Western Europe Market Value (US$ Million) Analysis by Application, 2019 to 2034

Figure 105: Western Europe Market Volume (Unit Pack) Analysis by Application, 2019 to 2034

Figure 106: Western Europe Market Value Share (%) and BPS Analysis by Application, 2024 to 2034

Figure 107: Western Europe Market Y-o-Y Growth (%) Projections by Application, 2024 to 2034

Figure 108: Western Europe Market Value (US$ Million) Analysis by Distribution Channel, 2019 to 2034

Figure 109: Western Europe Market Volume (Unit Pack) Analysis by Distribution Channel, 2019 to 2034

Figure 110: Western Europe Market Value Share (%) and BPS Analysis by Distribution Channel, 2024 to 2034

Figure 111: Western Europe Market Y-o-Y Growth (%) Projections by Distribution Channel, 2024 to 2034

Figure 112: Western Europe Market Value (US$ Million) Analysis by Age Group, 2019 to 2034

Figure 113: Western Europe Market Volume (Unit Pack) Analysis by Age Group, 2019 to 2034

Figure 114: Western Europe Market Value Share (%) and BPS Analysis by Age Group, 2024 to 2034

Figure 115: Western Europe Market Y-o-Y Growth (%) Projections by Age Group, 2024 to 2034

Figure 116: Western Europe Market Attractiveness by Type, 2024 to 2034

Figure 117: Western Europe Market Attractiveness by Application, 2024 to 2034

Figure 118: Western Europe Market Attractiveness by Distribution Channel, 2024 to 2034

Figure 119: Western Europe Market Attractiveness by Age Group, 2024 to 2034

Figure 120: Western Europe Market Attractiveness by Country, 2024 to 2034

Figure 121: Eastern Europe Market Value (US$ Million) by Type, 2024 to 2034

Figure 122: Eastern Europe Market Value (US$ Million) by Application, 2024 to 2034

Figure 123: Eastern Europe Market Value (US$ Million) by Distribution Channel, 2024 to 2034

Figure 124: Eastern Europe Market Value (US$ Million) by Age Group, 2024 to 2034

Figure 125: Eastern Europe Market Value (US$ Million) by Country, 2024 to 2034

Figure 126: Eastern Europe Market Value (US$ Million) Analysis by Country, 2019 to 2034

Figure 127: Eastern Europe Market Volume (Unit Pack) Analysis by Country, 2019 to 2034

Figure 128: Eastern Europe Market Value Share (%) and BPS Analysis by Country, 2024 to 2034

Figure 129: Eastern Europe Market Y-o-Y Growth (%) Projections by Country, 2024 to 2034

Figure 130: Eastern Europe Market Value (US$ Million) Analysis by Type, 2019 to 2034

Figure 131: Eastern Europe Market Volume (Unit Pack) Analysis by Type, 2019 to 2034

Figure 132: Eastern Europe Market Value Share (%) and BPS Analysis by Type, 2024 to 2034

Figure 133: Eastern Europe Market Y-o-Y Growth (%) Projections by Type, 2024 to 2034

Figure 134: Eastern Europe Market Value (US$ Million) Analysis by Application, 2019 to 2034

Figure 135: Eastern Europe Market Volume (Unit Pack) Analysis by Application, 2019 to 2034

Figure 136: Eastern Europe Market Value Share (%) and BPS Analysis by Application, 2024 to 2034

Figure 137: Eastern Europe Market Y-o-Y Growth (%) Projections by Application, 2024 to 2034

Figure 138: Eastern Europe Market Value (US$ Million) Analysis by Distribution Channel, 2019 to 2034

Figure 139: Eastern Europe Market Volume (Unit Pack) Analysis by Distribution Channel, 2019 to 2034

Figure 140: Eastern Europe Market Value Share (%) and BPS Analysis by Distribution Channel, 2024 to 2034

Figure 141: Eastern Europe Market Y-o-Y Growth (%) Projections by Distribution Channel, 2024 to 2034

Figure 142: Eastern Europe Market Value (US$ Million) Analysis by Age Group, 2019 to 2034

Figure 143: Eastern Europe Market Volume (Unit Pack) Analysis by Age Group, 2019 to 2034

Figure 144: Eastern Europe Market Value Share (%) and BPS Analysis by Age Group, 2024 to 2034

Figure 145: Eastern Europe Market Y-o-Y Growth (%) Projections by Age Group, 2024 to 2034

Figure 146: Eastern Europe Market Attractiveness by Type, 2024 to 2034

Figure 147: Eastern Europe Market Attractiveness by Application, 2024 to 2034

Figure 148: Eastern Europe Market Attractiveness by Distribution Channel, 2024 to 2034

Figure 149: Eastern Europe Market Attractiveness by Age Group, 2024 to 2034

Figure 150: Eastern Europe Market Attractiveness by Country, 2024 to 2034

Figure 151: South Asia and Pacific Market Value (US$ Million) by Type, 2024 to 2034

Figure 152: South Asia and Pacific Market Value (US$ Million) by Application, 2024 to 2034

Figure 153: South Asia and Pacific Market Value (US$ Million) by Distribution Channel, 2024 to 2034

Figure 154: South Asia and Pacific Market Value (US$ Million) by Age Group, 2024 to 2034

Figure 155: South Asia and Pacific Market Value (US$ Million) by Country, 2024 to 2034

Figure 156: South Asia and Pacific Market Value (US$ Million) Analysis by Country, 2019 to 2034

Figure 157: South Asia and Pacific Market Volume (Unit Pack) Analysis by Country, 2019 to 2034

Figure 158: South Asia and Pacific Market Value Share (%) and BPS Analysis by Country, 2024 to 2034

Figure 159: South Asia and Pacific Market Y-o-Y Growth (%) Projections by Country, 2024 to 2034

Figure 160: South Asia and Pacific Market Value (US$ Million) Analysis by Type, 2019 to 2034

Figure 161: South Asia and Pacific Market Volume (Unit Pack) Analysis by Type, 2019 to 2034

Figure 162: South Asia and Pacific Market Value Share (%) and BPS Analysis by Type, 2024 to 2034

Figure 163: South Asia and Pacific Market Y-o-Y Growth (%) Projections by Type, 2024 to 2034

Figure 164: South Asia and Pacific Market Value (US$ Million) Analysis by Application, 2019 to 2034

Figure 165: South Asia and Pacific Market Volume (Unit Pack) Analysis by Application, 2019 to 2034

Figure 166: South Asia and Pacific Market Value Share (%) and BPS Analysis by Application, 2024 to 2034

Figure 167: South Asia and Pacific Market Y-o-Y Growth (%) Projections by Application, 2024 to 2034

Figure 168: South Asia and Pacific Market Value (US$ Million) Analysis by Distribution Channel, 2019 to 2034

Figure 169: South Asia and Pacific Market Volume (Unit Pack) Analysis by Distribution Channel, 2019 to 2034

Figure 170: South Asia and Pacific Market Value Share (%) and BPS Analysis by Distribution Channel, 2024 to 2034

Figure 171: South Asia and Pacific Market Y-o-Y Growth (%) Projections by Distribution Channel, 2024 to 2034

Figure 172: South Asia and Pacific Market Value (US$ Million) Analysis by Age Group, 2019 to 2034

Figure 173: South Asia and Pacific Market Volume (Unit Pack) Analysis by Age Group, 2019 to 2034

Figure 174: South Asia and Pacific Market Value Share (%) and BPS Analysis by Age Group, 2024 to 2034

Figure 175: South Asia and Pacific Market Y-o-Y Growth (%) Projections by Age Group, 2024 to 2034

Figure 176: South Asia and Pacific Market Attractiveness by Type, 2024 to 2034

Figure 177: South Asia and Pacific Market Attractiveness by Application, 2024 to 2034

Figure 178: South Asia and Pacific Market Attractiveness by Distribution Channel, 2024 to 2034

Figure 179: South Asia and Pacific Market Attractiveness by Age Group, 2024 to 2034

Figure 180: South Asia and Pacific Market Attractiveness by Country, 2024 to 2034

Figure 181: East Asia Market Value (US$ Million) by Type, 2024 to 2034

Figure 182: East Asia Market Value (US$ Million) by Application, 2024 to 2034

Figure 183: East Asia Market Value (US$ Million) by Distribution Channel, 2024 to 2034

Figure 184: East Asia Market Value (US$ Million) by Age Group, 2024 to 2034

Figure 185: East Asia Market Value (US$ Million) by Country, 2024 to 2034

Figure 186: East Asia Market Value (US$ Million) Analysis by Country, 2019 to 2034

Figure 187: East Asia Market Volume (Unit Pack) Analysis by Country, 2019 to 2034

Figure 188: East Asia Market Value Share (%) and BPS Analysis by Country, 2024 to 2034

Figure 189: East Asia Market Y-o-Y Growth (%) Projections by Country, 2024 to 2034

Figure 190: East Asia Market Value (US$ Million) Analysis by Type, 2019 to 2034

Figure 191: East Asia Market Volume (Unit Pack) Analysis by Type, 2019 to 2034

Figure 192: East Asia Market Value Share (%) and BPS Analysis by Type, 2024 to 2034

Figure 193: East Asia Market Y-o-Y Growth (%) Projections by Type, 2024 to 2034

Figure 194: East Asia Market Value (US$ Million) Analysis by Application, 2019 to 2034

Figure 195: East Asia Market Volume (Unit Pack) Analysis by Application, 2019 to 2034

Figure 196: East Asia Market Value Share (%) and BPS Analysis by Application, 2024 to 2034

Figure 197: East Asia Market Y-o-Y Growth (%) Projections by Application, 2024 to 2034

Figure 198: East Asia Market Value (US$ Million) Analysis by Distribution Channel, 2019 to 2034

Figure 199: East Asia Market Volume (Unit Pack) Analysis by Distribution Channel, 2019 to 2034

Figure 200: East Asia Market Value Share (%) and BPS Analysis by Distribution Channel, 2024 to 2034

Figure 201: East Asia Market Y-o-Y Growth (%) Projections by Distribution Channel, 2024 to 2034

Figure 202: East Asia Market Value (US$ Million) Analysis by Age Group, 2019 to 2034

Figure 203: East Asia Market Volume (Unit Pack) Analysis by Age Group, 2019 to 2034

Figure 204: East Asia Market Value Share (%) and BPS Analysis by Age Group, 2024 to 2034

Figure 205: East Asia Market Y-o-Y Growth (%) Projections by Age Group, 2024 to 2034

Figure 206: East Asia Market Attractiveness by Type, 2024 to 2034

Figure 207: East Asia Market Attractiveness by Application, 2024 to 2034

Figure 208: East Asia Market Attractiveness by Distribution Channel, 2024 to 2034

Figure 209: East Asia Market Attractiveness by Age Group, 2024 to 2034

Figure 210: East Asia Market Attractiveness by Country, 2024 to 2034

Figure 211: Middle East and Africa Market Value (US$ Million) by Type, 2024 to 2034

Figure 212: Middle East and Africa Market Value (US$ Million) by Application, 2024 to 2034

Figure 213: Middle East and Africa Market Value (US$ Million) by Distribution Channel, 2024 to 2034

Figure 214: Middle East and Africa Market Value (US$ Million) by Age Group, 2024 to 2034

Figure 215: Middle East and Africa Market Value (US$ Million) by Country, 2024 to 2034

Figure 216: Middle East and Africa Market Value (US$ Million) Analysis by Country, 2019 to 2034

Figure 217: Middle East and Africa Market Volume (Unit Pack) Analysis by Country, 2019 to 2034

Figure 218: Middle East and Africa Market Value Share (%) and BPS Analysis by Country, 2024 to 2034

Figure 219: Middle East and Africa Market Y-o-Y Growth (%) Projections by Country, 2024 to 2034

Figure 220: Middle East and Africa Market Value (US$ Million) Analysis by Type, 2019 to 2034

Figure 221: Middle East and Africa Market Volume (Unit Pack) Analysis by Type, 2019 to 2034

Figure 222: Middle East and Africa Market Value Share (%) and BPS Analysis by Type, 2024 to 2034

Figure 223: Middle East and Africa Market Y-o-Y Growth (%) Projections by Type, 2024 to 2034

Figure 224: Middle East and Africa Market Value (US$ Million) Analysis by Application, 2019 to 2034

Figure 225: Middle East and Africa Market Volume (Unit Pack) Analysis by Application, 2019 to 2034

Figure 226: Middle East and Africa Market Value Share (%) and BPS Analysis by Application, 2024 to 2034

Figure 227: Middle East and Africa Market Y-o-Y Growth (%) Projections by Application, 2024 to 2034

Figure 228: Middle East and Africa Market Value (US$ Million) Analysis by Distribution Channel, 2019 to 2034

Figure 229: Middle East and Africa Market Volume (Unit Pack) Analysis by Distribution Channel, 2019 to 2034

Figure 230: Middle East and Africa Market Value Share (%) and BPS Analysis by Distribution Channel, 2024 to 2034

Figure 231: Middle East and Africa Market Y-o-Y Growth (%) Projections by Distribution Channel, 2024 to 2034

Figure 232: Middle East and Africa Market Value (US$ Million) Analysis by Age Group, 2019 to 2034

Figure 233: Middle East and Africa Market Volume (Unit Pack) Analysis by Age Group, 2019 to 2034

Figure 234: Middle East and Africa Market Value Share (%) and BPS Analysis by Age Group, 2024 to 2034

Figure 235: Middle East and Africa Market Y-o-Y Growth (%) Projections by Age Group, 2024 to 2034

Figure 236: Middle East and Africa Market Attractiveness by Type, 2024 to 2034

Figure 237: Middle East and Africa Market Attractiveness by Application, 2024 to 2034

Figure 238: Middle East and Africa Market Attractiveness by Distribution Channel, 2024 to 2034

Figure 239: Middle East and Africa Market Attractiveness by Age Group, 2024 to 2034

Figure 240: Middle East and Africa Market Attractiveness by Country, 2024 to 2034

Frequently Asked Questions

What is the expected value of the chocolate powdered drinks market in 2024?

By 2024, the chocolate powdered drinks landscape is anticipated to be valued at US$ 7,941.2 million.

What is the projected forecast CAGR for the chocolate powdered drinks market from 2024 to 2034?

The chocolate powdered drinks market is expected to flourish at a CAGR of 6% from 2024 to 2034.

At what value the chocolate powdered drinks market is expected to conclude in 2034?

By 2034, the chocolate powdered drinks market will generate US$ 14,168.2 million in value terms.

Based on type, which segment dominates the chocolate powdered drinks market?

The dark chocolate segment is expected to hold a market share of 32% in 2024.

Which country dominates the chocolate powdered drinks market?

With a CAGR of 6.5%, China is expected to dominate the market for chocolate powdered drinks.

Explore Similar Insights

Future Market Insights

Chocolate Powdered Drinks Market