Soft Drinks Packaging Market Size and Share Forecast Outlook 2025 to 2035

The Soft Drinks Packaging Market is estimated to be valued at USD 90.0 billion in 2025 and is projected to reach USD 125.7 billion by 2035, registering a compound annual growth rate (CAGR) of 3.4% over the forecast period.
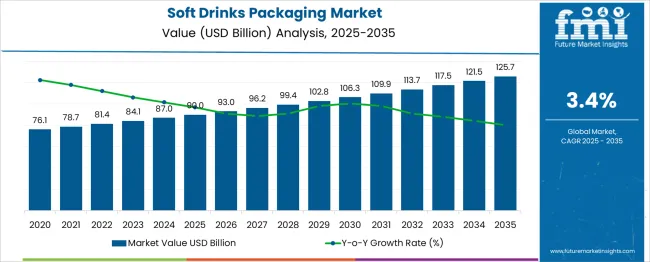
Quick Stats for Soft Drinks Packaging Market

  • Soft Drinks Packaging Market Value (2025): USD 90.0 billion
  • Soft Drinks Packaging Market Forecast Value (2035): USD 125.7 billion
  • Soft Drinks Packaging Market Forecast CAGR: 3.4%
  • Leading Segment in Soft Drinks Packaging Market in 2025: Plastic (53.8%)
  • Key Growth Regions in Soft Drinks Packaging Market: North America, Asia-Pacific, Europe
  • Top Key Players in Soft Drinks Packaging Market: Amcor, AptarGroup, Ardagh Group, Ball Corporation, Berry Global Group, CAN-PACK, CPMC Holdings, Crown Holdings, Graham Packaging, Graphic Packaging International, Novelis, Plastipak Holdings, SIG, Silgan Holdings, Smurfit Kappa, Tetra Pak, Visy Industries, WestRock

Soft Drinks Packaging Market

Soft Drinks Packaging Market Key Takeaways

Metric Value
Soft Drinks Packaging Market Estimated Value in (2025 E) USD 90.0 billion
Soft Drinks Packaging Market Forecast Value in (2035 F) USD 125.7 billion
Forecast CAGR (2025 to 2035) 3.4%

Why is the Soft Drinks Packaging Market growing?

The soft drinks packaging market is experiencing robust growth fueled by increasing consumer demand for convenient and portable beverage formats. Changing lifestyles and rising consumption of ready-to-drink products have driven the need for innovative packaging solutions that ensure product freshness and ease of use.

Environmental concerns have prompted manufacturers to explore recyclable and lightweight materials without compromising durability. Market players are focusing on packaging that enhances shelf appeal and meets regulatory requirements related to food safety.

Additionally, growth in urban populations and the expansion of retail channels have improved product accessibility. The market outlook remains positive as companies invest in sustainable materials and smarter packaging designs to align with consumer preferences. Segmental growth is expected to be led by plastic as the preferred packaging material, bottles as the dominant product type, and medium packaging capacities ranging from 251 ml to 1 liter.

Segmental Analysis

The soft drinks packaging market is segmented by material, product type, capacity, and soft drink type and geographic regions. By material of the soft drinks packaging market is divided into Plastic, Glass, Metal, Paper & paperboard, and Others. In terms of product type of the soft drinks packaging market is classified into Bottles, Cans, Cartons, Pouches, and Others. Based on capacity of the soft drinks packaging market is segmented into Medium packaging (251 ml to 1 liter), Small packaging (Up to 250 ml), and Large packaging (Above 1 liter). By soft drink type of the soft drinks packaging market is segmented into Carbonated soft drinks and Non-carbonated soft drinks. Regionally, the soft drinks packaging industry is classified into North America, Latin America, Western Europe, Eastern Europe, Balkan & Baltic Countries, Russia & Belarus, Central Asia, East Asia, South Asia & Pacific, and the Middle East & Africa.
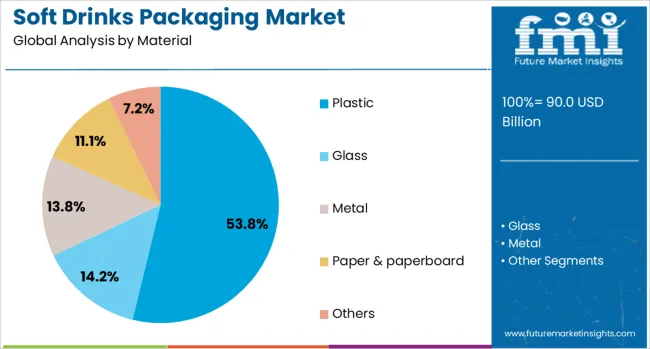
Insights into the Material Segment: Plastic

Soft Drinks Packaging Market Analysis By Material

The plastic segment is projected to hold 53.8% of the soft drinks packaging market revenue in 2025, maintaining its leading position. This growth is attributed to plastic’s versatility, lightweight nature, and cost-effectiveness, which make it ideal for mass production and distribution. Plastic packaging offers excellent barrier properties that help preserve product quality and extend shelf life.

Its recyclability and the development of bio-based plastics have enhanced its appeal amid growing environmental concerns. Manufacturers value plastic for its ability to be molded into various shapes and sizes, enabling innovative bottle designs that attract consumers.

The segment’s dominance is expected to continue as plastic remains a preferred choice for both manufacturers and consumers seeking convenience.

Insights into the Product Type Segment: Bottles

Bottles are forecasted to account for 46.1% of the market revenue in 2025, leading the product type segment. Their popularity is driven by ease of use, portability, and the ability to maintain carbonation in carbonated beverages. Bottles also provide a premium look and feel, enhancing brand visibility on shelves.

Innovations such as lightweight bottles and ergonomic designs have further boosted consumer preference. Retailers favor bottles for their convenience in display and transportation.

As consumers increasingly seek on-the-go beverage options, bottles are expected to retain their market leadership.
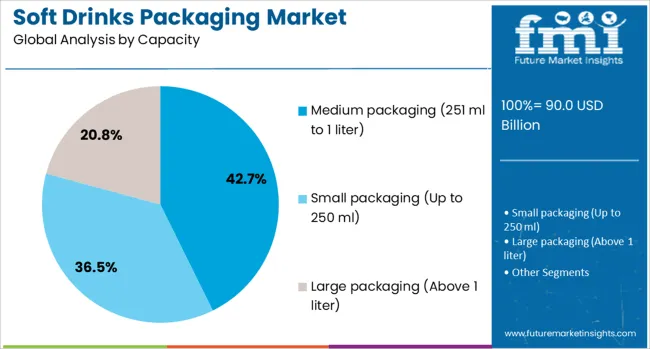
Insights into the Capacity Segment: Medium Packaging (251 ml to 1 liter)

Soft Drinks Packaging Market Analysis By Capacity

The medium packaging segment, ranging from 251 ml to 1 liter, is projected to contribute 42.7% of the market revenue in 2025, making it the dominant capacity category. This segment has grown due to its balance between portability and value, meeting the needs of diverse consumer occasions from single servings to sharing sizes.

Packaging within this range is widely used in retail and vending machine channels, making it highly accessible. Consumer trends favor medium-sized packages for their convenience without excess waste.

As beverage companies continue to innovate within this segment to offer variety and convenience, the medium packaging capacity is expected to maintain its stronghold.

What are the Drivers, Restraints, and Key Trends of the Soft Drinks Packaging Market?

Soft drinks packaging is shifting toward formats that improve freshness, reduce leakage, and enable better shelf appeal. Resealable PET bottles, barrier-coated cans, and smart caps are gaining traction in 2024. These shifts are driven by faster SKU rotation and demand for packaging that aligns with portability, portion control, and cold-chain preservation.

Freshness Control and SKU Reformatting

Soft drink manufacturers have reduced flavor degradation by using oxygen scavenger films and nitrogen-flush filling. By Q2 2025, 19 % of new SKUs adopted barrier-coated PET or aluminum substrates, extending shelf life by 14 %. Carbonated fruit-based beverages now favor multilayer canisters with anti-UV coatings to stabilize volatile ingredients. Refillable PET bottles with tamper-resistant caps have expanded 23 % YoY in club-store packs. Several mid-size producers introduced batch-coded labels with QR integration, enabling consumer verification and retail traceability. This tech accelerated market clearance of slow-moving lines, reducing expiry-linked write-offs by 11 %. Faster turnaround formats have also pushed co-packers to realign line-speed settings, allowing smaller production runs and reducing overstock accumulation by 17 % across regional distributors.

Material Complexity and Labeling Constraints

Multilayered pack formats raise recyclability concerns across PET–aluminum hybrids and barrier-film pouches. While demand for visually distinctive designs climbed 14 % YoY, regulatory pressure on recyclability slowed rollouts. In Q1 2025, 37 % of launches with metallized finishes required extension waivers for material declarations. Print-to-pack vendors faced a 3-week average delay due to conflicting labeling standards across EU and GCC markets. Brands switching from virgin plastic to rigid paperboard bottles encountered a 9 % increase in leakage complaints, triggering partial retraction in e-commerce segments. Packaging vendors operating below 85 % compliance with deposit return or post-consumer resin thresholds saw a 6 % drop in procurement volume. These hurdles have forced some private-label brands to delay promotional rollouts, altering seasonal product timelines.
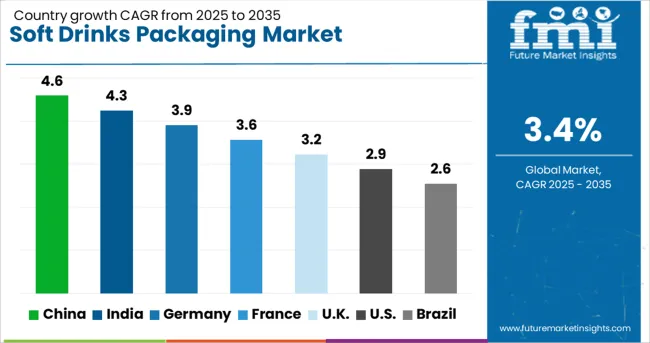
Analysis of Soft Drinks Packaging Market By Key Countries

Soft Drinks Packaging Market Cagr Analysis By Country

Country CAGR
China 4.6%
India 4.3%
Germany 3.9%
France 3.6%
UK 3.2%
USA 2.9%
Brazil 2.6%

The global soft drinks packaging market is projected to grow at a 3.4% CAGR from 2025 to 2035, driven by demand for lightweight materials, sustainable packaging alternatives, and digital labeling technologies. Of the 40 countries assessed, China leads with 4.6%, followed by India at 4.3%, while Germany posts 3.9%, the United Kingdom records 3.2%, and the United States trails at 2.9%. BRICS economies focus on cost-optimized PET formats and localized manufacturing, whereas OECD nations prioritize recyclable designs, smart packaging features, and e-commerce-ready formats. The report covers detailed analysis of 40+ countries, with the top five countries shared as a reference.

Sales Analysis of Soft Drinks Packaging Market in China

China is expected to grow at a 4.6% CAGR, driven by rising beverage production and adoption of advanced packaging technologies. PET bottles dominate the market, supported by automation in blow-molding and lightweight preform systems. Digital printing and smart labeling solutions gain popularity for brand differentiation. Increased investment in tethered caps and recyclable closures aligns with evolving environmental regulations. E-commerce expansion adds demand for secondary protective packaging, pushing manufacturers toward lightweight corrugated solutions and flexible pouches for last-mile delivery.

  • PET bottles remain core packaging format across soft drink categories.
  • Digital printing enhances customization for premium beverage lines.
  • E-commerce fosters secondary protective packaging adoption.

In-depth Analysis of Soft Drinks Packaging Market in India

India is forecast to grow at a 4.3% CAGR, supported by demand for PET and flexible pouches in urban and semi-urban markets. Beverage brands focus on cost-effective packaging with quick turnaround times for seasonal campaigns. Adoption of lightweight PET bottles and tethered caps aligns with government plastic waste reduction initiatives. Local converters expand high-speed PET preform molding capacity to meet bulk production requirements for carbonated drinks and packaged water. Digital printing integration into shrink sleeves and labels supports limited-edition launches and targeted marketing strategies.
  • Lightweight PET bottles and tethered caps dominate market preferences.
  • Converters scale PET preform capacity for mass beverage production.
  • Digital labels gain popularity in personalized marketing initiatives.

Opportunity Analysis of Soft Drinks Packaging Market in Germany

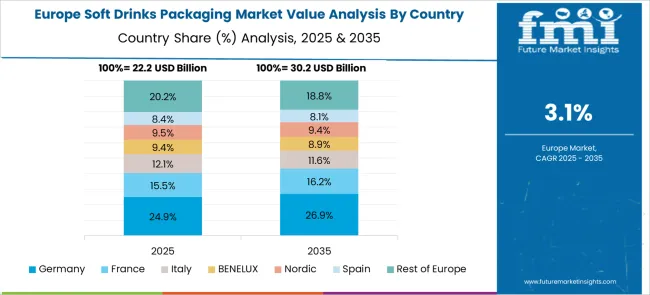
Soft Drinks Packaging Market Europe Country Market Share Analysis, 2025 & 2035

Germany is projected to grow at a 3.9% CAGR, driven by demand for sustainable packaging formats in carbonated and functional beverages. Packaging suppliers prioritize recyclable PET, glass return systems, and biodegradable shrink sleeves to comply with EU directives. Deployment of digital track-and-trace systems for supply chain transparency accelerates adoption of smart packaging technologies. Brands adopt premium glass packaging formats for craft beverages and mineral water, supported by return logistics infrastructure. The market also witnesses growing preference for lightweight closures and energy-efficient blow-molding systems.

  • Recyclable PET and glass dominate under EU circular economy goals.
  • Smart packaging solutions integrated with QR-based engagement tools.
  • Energy-efficient blow-molding systems improve production sustainability.

Future Prospects for Soft Drinks Packaging Market in the United Kingdom

The United Kingdom is expected to grow at a 3.2% CAGR, supported by e-commerce-ready packaging and lightweight formats for carbonated beverages. Beverage brands emphasize tethered closures and mono-material designs to meet Extended Producer Responsibility (EPR) regulations. Demand for shrink sleeves with digital watermarks is rising to facilitate recycling and improve brand authentication. Glass packaging in premium soft drink categories maintains niche relevance due to strong heritage branding. Packaging automation upgrades dominate investment priorities, driven by labor cost challenges and the need for precision in high-speed lines.
  • Tethered closures comply with EPR and EU design requirements.
  • Mono-material flexible films dominate e-commerce beverage shipments.
  • Digital watermarks embedded in shrink sleeves enhance recyclability.

Growth Outlook for Soft Drinks Packaging Market in the United States

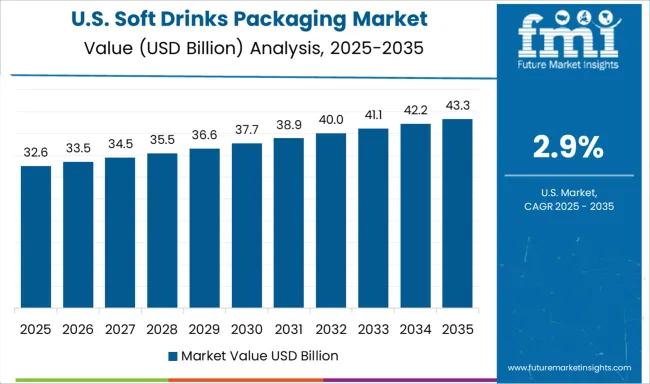
Soft Drinks Packaging Market Country Value Analysis

The United States is anticipated to grow at a 2.9% CAGR, influenced by lightweighting initiatives and growth of ready-to-drink (RTD) beverage segments. PET bottles with higher recycled content dominate packaging innovation pipelines. Brands invest in smart packaging for digital consumer engagement and enhanced traceability in direct-to-consumer (D2C) channels. Aluminum cans retain popularity due to recyclability advantages, with major bottlers expanding can-filling capacities. Automation of bottling and labeling lines becomes critical to offset labor shortages, while robotics and AI integration in secondary packaging processes enhance operational efficiency.
  • PET bottles with recycled content set benchmarks for packaging design.
  • Aluminum cans maintain growth in carbonated drink categories.
  • Robotics-enabled secondary packaging accelerates production optimization.

Competitive Landscape of Soft Drinks Packaging Market

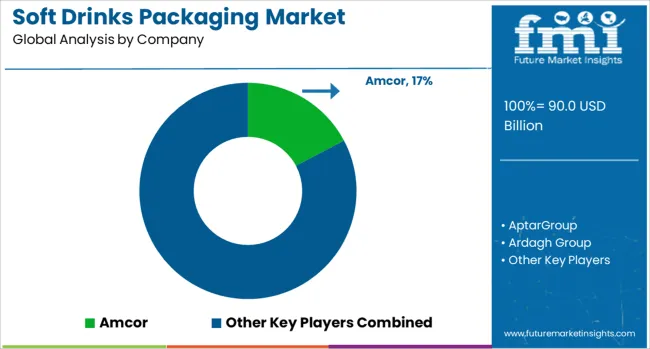
Soft Drinks Packaging Market Analysis By Company

The soft drinks packaging market is dominated by major players focusing on lightweight materials, sustainability, and enhanced shelf appeal. Amcor leads with advanced flexible and rigid packaging solutions, while Ball Corporation, Crown Holdings, and CAN-PACK specialize in aluminum cans supporting growing demand for recyclability. Berry Global, Plastipak Holdings, and Graham Packaging provide PET and plastic-based formats with improved barrier properties. Tetra Pak and SIG dominate carton packaging for juices and functional beverages, emphasizing renewable materials. Paperboard and corrugated solutions from Smurfit Kappa, WestRock, and Graphic Packaging International address secondary packaging needs. Ardagh Group and Novelis strengthen the metal packaging segment with lightweight designs, while AptarGroup contributes closures and dispensing systems. Competition focuses on sustainability, smart labeling, and cost-efficient supply chain solutions across global beverage markets.

Scope of the Report

Item Value
Quantitative Units USD 90.0 Billion
Material Plastic, Glass, Metal, Paper & paperboard, and Others
Product Type Bottles, Cans, Cartons, Pouches, and Others
Capacity Medium packaging (251 ml to 1 liter), Small packaging (Up to 250 ml), and Large packaging (Above 1 liter)
Soft Drink Type Carbonated soft drinks and Non-carbonated soft drinks
Regions Covered North America, Europe, Asia-Pacific, Latin America, Middle East & Africa
Country Covered United States, Canada, Germany, France, United Kingdom, China, Japan, India, Brazil, South Africa
Key Companies Profiled Amcor, AptarGroup, Ardagh Group, Ball Corporation, Berry Global Group, CAN-PACK, CPMC Holdings, Crown Holdings, Graham Packaging, Graphic Packaging International, Novelis, Plastipak Holdings, SIG, Silgan Holdings, Smurfit Kappa, Tetra Pak, Visy Industries, and WestRock
Additional Attributes Dollar sales by packaging type (bottles, cans, cartons) and material (PET, aluminum, glass), demand dynamics across carbonated beverages, flavored water, and functional drinks, regional trends led by North America with Asia‑Pacific diversifying format mixes, innovation in tethered caps and lightweight barrier coatings, and environmental impact of recyclability thresholds and single-use packaging regulations.

Soft Drinks Packaging Market by Segments

Material:

  • Plastic
  • Glass
  • Metal
  • Paper & paperboard
  • Others

Product Type:

  • Bottles
  • Cans
  • Cartons
  • Pouches
  • Others

Capacity:

  • Medium packaging (251 ml to 1 liter)
  • Small packaging (Up to 250 ml)
  • Large packaging (Above 1 liter)

Soft Drink Type:

  • Carbonated soft drinks
  • Non-carbonated soft drinks

Region:

  • North America
    • USA
    • Canada
    • Mexico
  • Latin America
    • Brazil
    • Chile
    • Rest of Latin America
  • Western Europe
    • Germany
    • UK
    • Italy
    • Spain
    • France
    • Nordic
    • BENELUX
    • Rest of Western Europe
  • Eastern Europe
    • Russia
    • Poland
    • Hungary
    • Balkan & Baltic
    • Rest of Eastern Europe
  • East Asia
    • China
    • Japan
    • South Korea
  • South Asia and Pacific
    • India
    • ASEAN
    • Australia & New Zealand
    • Rest of South Asia and Pacific
  • Middle East & Africa
    • Kingdom of Saudi Arabia
    • Other GCC Countries
    • Turkiye
    • South Africa
    • Other African Union
    • Rest of Middle East & Africa

Table of Content

  1. Executive Summary
    • Global Market Outlook
    • Demand-side Trends
    • Supply-side Trends
    • Technology Roadmap Analysis
    • Analysis and Recommendations
  2. Market Overview
    • Market Coverage / Taxonomy
    • Market Definition / Scope / Limitations
  3. Market Background
    • Market Dynamics
      • Drivers
      • Restraints
      • Opportunity
      • Trends
    • Scenario Forecast
      • Demand in Optimistic Scenario
      • Demand in Likely Scenario
      • Demand in Conservative Scenario
    • Opportunity Map Analysis
    • Product Life Cycle Analysis
    • Supply Chain Analysis
    • Investment Feasibility Matrix
    • Value Chain Analysis
    • PESTLE and Porter’s Analysis
    • Regulatory Landscape
    • Regional Parent Market Outlook
    • Production and Consumption Statistics
    • Import and Export Statistics
  4. Global Soft Drinks Packaging Market Analysis 2020-2024 and Forecast, 2025-2035
    • Historical Market Size Value (USD Mn) Analysis, 2020-2024
    • Current and Future Market Size Value (USD Mn) Projections, 2025-2035
      • Y-o-Y Growth Trend Analysis
      • Absolute $ Opportunity Analysis
  5. Global Soft Drinks Packaging Market Pricing Analysis 2020-2024 and Forecast 2025-2035
  6. Global Soft Drinks Packaging Market Analysis 2020-2024 and Forecast 2025-2035, By Material
    • Introduction / Key Findings
    • Historical Market Size Value (USD Mn) Analysis By Material , 2020-2024
    • Current and Future Market Size Value (USD Mn) Analysis and Forecast By Material , 2025-2035
      • Plastic
      • Glass
      • Metal
      • Paper & paperboard
      • Others
    • Y-o-Y Growth Trend Analysis By Material , 2020-2024
    • Absolute $ Opportunity Analysis By Material , 2025-2035
  7. Global Soft Drinks Packaging Market Analysis 2020-2024 and Forecast 2025-2035, By Product Type
    • Introduction / Key Findings
    • Historical Market Size Value (USD Mn) Analysis By Product Type, 2020-2024
    • Current and Future Market Size Value (USD Mn) Analysis and Forecast By Product Type, 2025-2035
      • Bottles
      • Cans
      • Cartons
      • Pouches
      • Others
    • Y-o-Y Growth Trend Analysis By Product Type, 2020-2024
    • Absolute $ Opportunity Analysis By Product Type, 2025-2035
  8. Global Soft Drinks Packaging Market Analysis 2020-2024 and Forecast 2025-2035, By Capacity
    • Introduction / Key Findings
    • Historical Market Size Value (USD Mn) Analysis By Capacity, 2020-2024
    • Current and Future Market Size Value (USD Mn) Analysis and Forecast By Capacity, 2025-2035
      • Medium packaging (251 ml to 1 liter)
      • Small packaging (Up to 250 ml)
      • Large packaging (Above 1 liter)
    • Y-o-Y Growth Trend Analysis By Capacity, 2020-2024
    • Absolute $ Opportunity Analysis By Capacity, 2025-2035
  9. Global Soft Drinks Packaging Market Analysis 2020-2024 and Forecast 2025-2035, By Soft Drink Type
    • Introduction / Key Findings
    • Historical Market Size Value (USD Mn) Analysis By Soft Drink Type, 2020-2024
    • Current and Future Market Size Value (USD Mn) Analysis and Forecast By Soft Drink Type, 2025-2035
      • Carbonated soft drinks
      • Non-carbonated soft drinks
    • Y-o-Y Growth Trend Analysis By Soft Drink Type, 2020-2024
    • Absolute $ Opportunity Analysis By Soft Drink Type, 2025-2035
  10. Global Soft Drinks Packaging Market Analysis 2020-2024 and Forecast 2025-2035, By Region
    • Introduction
    • Historical Market Size Value (USD Mn) Analysis By Region, 2020-2024
    • Current Market Size Value (USD Mn) Analysis and Forecast By Region, 2025-2035
      • North America
      • Latin America
      • Western Europe
      • Eastern Europe
      • East Asia
      • South Asia and Pacific
      • Middle East & Africa
    • Market Attractiveness Analysis By Region
  11. North America Soft Drinks Packaging Market Analysis 2020-2024 and Forecast 2025-2035, By Country
    • Historical Market Size Value (USD Mn) Trend Analysis By Market Taxonomy, 2020-2024
    • Market Size Value (USD Mn) Forecast By Market Taxonomy, 2025-2035
      • By Country
        • USA
        • Canada
        • Mexico
      • By Material
      • By Product Type
      • By Capacity
      • By Soft Drink Type
    • Market Attractiveness Analysis
      • By Country
      • By Material
      • By Product Type
      • By Capacity
      • By Soft Drink Type
    • Key Takeaways
  12. Latin America Soft Drinks Packaging Market Analysis 2020-2024 and Forecast 2025-2035, By Country
    • Historical Market Size Value (USD Mn) Trend Analysis By Market Taxonomy, 2020-2024
    • Market Size Value (USD Mn) Forecast By Market Taxonomy, 2025-2035
      • By Country
        • Brazil
        • Chile
        • Rest of Latin America
      • By Material
      • By Product Type
      • By Capacity
      • By Soft Drink Type
    • Market Attractiveness Analysis
      • By Country
      • By Material
      • By Product Type
      • By Capacity
      • By Soft Drink Type
    • Key Takeaways
  13. Western Europe Soft Drinks Packaging Market Analysis 2020-2024 and Forecast 2025-2035, By Country
    • Historical Market Size Value (USD Mn) Trend Analysis By Market Taxonomy, 2020-2024
    • Market Size Value (USD Mn) Forecast By Market Taxonomy, 2025-2035
      • By Country
        • Germany
        • UK
        • Italy
        • Spain
        • France
        • Nordic
        • BENELUX
        • Rest of Western Europe
      • By Material
      • By Product Type
      • By Capacity
      • By Soft Drink Type
    • Market Attractiveness Analysis
      • By Country
      • By Material
      • By Product Type
      • By Capacity
      • By Soft Drink Type
    • Key Takeaways
  14. Eastern Europe Soft Drinks Packaging Market Analysis 2020-2024 and Forecast 2025-2035, By Country
    • Historical Market Size Value (USD Mn) Trend Analysis By Market Taxonomy, 2020-2024
    • Market Size Value (USD Mn) Forecast By Market Taxonomy, 2025-2035
      • By Country
        • Russia
        • Poland
        • Hungary
        • Balkan & Baltic
        • Rest of Eastern Europe
      • By Material
      • By Product Type
      • By Capacity
      • By Soft Drink Type
    • Market Attractiveness Analysis
      • By Country
      • By Material
      • By Product Type
      • By Capacity
      • By Soft Drink Type
    • Key Takeaways
  15. East Asia Soft Drinks Packaging Market Analysis 2020-2024 and Forecast 2025-2035, By Country
    • Historical Market Size Value (USD Mn) Trend Analysis By Market Taxonomy, 2020-2024
    • Market Size Value (USD Mn) Forecast By Market Taxonomy, 2025-2035
      • By Country
        • China
        • Japan
        • South Korea
      • By Material
      • By Product Type
      • By Capacity
      • By Soft Drink Type
    • Market Attractiveness Analysis
      • By Country
      • By Material
      • By Product Type
      • By Capacity
      • By Soft Drink Type
    • Key Takeaways
  16. South Asia and Pacific Soft Drinks Packaging Market Analysis 2020-2024 and Forecast 2025-2035, By Country
    • Historical Market Size Value (USD Mn) Trend Analysis By Market Taxonomy, 2020-2024
    • Market Size Value (USD Mn) Forecast By Market Taxonomy, 2025-2035
      • By Country
        • India
        • ASEAN
        • Australia & New Zealand
        • Rest of South Asia and Pacific
      • By Material
      • By Product Type
      • By Capacity
      • By Soft Drink Type
    • Market Attractiveness Analysis
      • By Country
      • By Material
      • By Product Type
      • By Capacity
      • By Soft Drink Type
    • Key Takeaways
  17. Middle East & Africa Soft Drinks Packaging Market Analysis 2020-2024 and Forecast 2025-2035, By Country
    • Historical Market Size Value (USD Mn) Trend Analysis By Market Taxonomy, 2020-2024
    • Market Size Value (USD Mn) Forecast By Market Taxonomy, 2025-2035
      • By Country
        • Kingdom of Saudi Arabia
        • Other GCC Countries
        • Turkiye
        • South Africa
        • Other African Union
        • Rest of Middle East & Africa
      • By Material
      • By Product Type
      • By Capacity
      • By Soft Drink Type
    • Market Attractiveness Analysis
      • By Country
      • By Material
      • By Product Type
      • By Capacity
      • By Soft Drink Type
    • Key Takeaways
  18. Key Countries Soft Drinks Packaging Market Analysis
    • USA
      • Pricing Analysis
      • Market Share Analysis, 2024
        • By Material
        • By Product Type
        • By Capacity
        • By Soft Drink Type
    • Canada
      • Pricing Analysis
      • Market Share Analysis, 2024
        • By Material
        • By Product Type
        • By Capacity
        • By Soft Drink Type
    • Mexico
      • Pricing Analysis
      • Market Share Analysis, 2024
        • By Material
        • By Product Type
        • By Capacity
        • By Soft Drink Type
    • Brazil
      • Pricing Analysis
      • Market Share Analysis, 2024
        • By Material
        • By Product Type
        • By Capacity
        • By Soft Drink Type
    • Chile
      • Pricing Analysis
      • Market Share Analysis, 2024
        • By Material
        • By Product Type
        • By Capacity
        • By Soft Drink Type
    • Germany
      • Pricing Analysis
      • Market Share Analysis, 2024
        • By Material
        • By Product Type
        • By Capacity
        • By Soft Drink Type
    • UK
      • Pricing Analysis
      • Market Share Analysis, 2024
        • By Material
        • By Product Type
        • By Capacity
        • By Soft Drink Type
    • Italy
      • Pricing Analysis
      • Market Share Analysis, 2024
        • By Material
        • By Product Type
        • By Capacity
        • By Soft Drink Type
    • Spain
      • Pricing Analysis
      • Market Share Analysis, 2024
        • By Material
        • By Product Type
        • By Capacity
        • By Soft Drink Type
    • France
      • Pricing Analysis
      • Market Share Analysis, 2024
        • By Material
        • By Product Type
        • By Capacity
        • By Soft Drink Type
    • India
      • Pricing Analysis
      • Market Share Analysis, 2024
        • By Material
        • By Product Type
        • By Capacity
        • By Soft Drink Type
    • ASEAN
      • Pricing Analysis
      • Market Share Analysis, 2024
        • By Material
        • By Product Type
        • By Capacity
        • By Soft Drink Type
    • Australia & New Zealand
      • Pricing Analysis
      • Market Share Analysis, 2024
        • By Material
        • By Product Type
        • By Capacity
        • By Soft Drink Type
    • China
      • Pricing Analysis
      • Market Share Analysis, 2024
        • By Material
        • By Product Type
        • By Capacity
        • By Soft Drink Type
    • Japan
      • Pricing Analysis
      • Market Share Analysis, 2024
        • By Material
        • By Product Type
        • By Capacity
        • By Soft Drink Type
    • South Korea
      • Pricing Analysis
      • Market Share Analysis, 2024
        • By Material
        • By Product Type
        • By Capacity
        • By Soft Drink Type
    • Russia
      • Pricing Analysis
      • Market Share Analysis, 2024
        • By Material
        • By Product Type
        • By Capacity
        • By Soft Drink Type
    • Poland
      • Pricing Analysis
      • Market Share Analysis, 2024
        • By Material
        • By Product Type
        • By Capacity
        • By Soft Drink Type
    • Hungary
      • Pricing Analysis
      • Market Share Analysis, 2024
        • By Material
        • By Product Type
        • By Capacity
        • By Soft Drink Type
    • Kingdom of Saudi Arabia
      • Pricing Analysis
      • Market Share Analysis, 2024
        • By Material
        • By Product Type
        • By Capacity
        • By Soft Drink Type
    • Turkiye
      • Pricing Analysis
      • Market Share Analysis, 2024
        • By Material
        • By Product Type
        • By Capacity
        • By Soft Drink Type
    • South Africa
      • Pricing Analysis
      • Market Share Analysis, 2024
        • By Material
        • By Product Type
        • By Capacity
        • By Soft Drink Type
  19. Market Structure Analysis
    • Competition Dashboard
    • Competition Benchmarking
    • Market Share Analysis of Top Players
      • By Regional
      • By Material
      • By Product Type
      • By Capacity
      • By Soft Drink Type
  20. Competition Analysis
    • Competition Deep Dive
      • Company1
        • Overview
        • Product Portfolio
        • Profitability by Market Segments (Product/Age /Sales Channel/Region)
        • Sales Footprint
        • Strategy Overview
          • Marketing Strategy
          • Product Strategy
          • Channel Strategy
      • Company2
      • Company3
      • Company4
      • Company5
      • Company6
      • Company7
      • Company8
      • Company9
      • Company10
      • Company11
      • Company12
      • Company13
      • Company14
      • Company15
      • Company16
      • Company17
      • Company18
      • Company19
      • Company20
  21. Assumptions & Acronyms Used
  22. Research Methodology

List of Tables

  • Table 1: Global Soft Drinks Packaging Market Value (USD Mn) Forecast by Region, 2020-2035
  • Table 2: Global Soft Drinks Packaging Market Value (USD Mn) Forecast by Material , 2020-2035
  • Table 3: Global Soft Drinks Packaging Market Value (USD Mn) Forecast by Product Type, 2020-2035
  • Table 4: Global Soft Drinks Packaging Market Value (USD Mn) Forecast by Capacity, 2020-2035
  • Table 5: Global Soft Drinks Packaging Market Value (USD Mn) Forecast by Soft Drink Type, 2020-2035
  • Table 6: North America Soft Drinks Packaging Market Value (USD Mn) Forecast by Country, 2020-2035
  • Table 7: North America Soft Drinks Packaging Market Value (USD Mn) Forecast by Material , 2020-2035
  • Table 8: North America Soft Drinks Packaging Market Value (USD Mn) Forecast by Product Type, 2020-2035
  • Table 9: North America Soft Drinks Packaging Market Value (USD Mn) Forecast by Capacity, 2020-2035
  • Table 10: North America Soft Drinks Packaging Market Value (USD Mn) Forecast by Soft Drink Type, 2020-2035
  • Table 11: Latin America Soft Drinks Packaging Market Value (USD Mn) Forecast by Country, 2020-2035
  • Table 12: Latin America Soft Drinks Packaging Market Value (USD Mn) Forecast by Material , 2020-2035
  • Table 13: Latin America Soft Drinks Packaging Market Value (USD Mn) Forecast by Product Type, 2020-2035
  • Table 14: Latin America Soft Drinks Packaging Market Value (USD Mn) Forecast by Capacity, 2020-2035
  • Table 15: Latin America Soft Drinks Packaging Market Value (USD Mn) Forecast by Soft Drink Type, 2020-2035
  • Table 16: Western Europe Soft Drinks Packaging Market Value (USD Mn) Forecast by Country, 2020-2035
  • Table 17: Western Europe Soft Drinks Packaging Market Value (USD Mn) Forecast by Material , 2020-2035
  • Table 18: Western Europe Soft Drinks Packaging Market Value (USD Mn) Forecast by Product Type, 2020-2035
  • Table 19: Western Europe Soft Drinks Packaging Market Value (USD Mn) Forecast by Capacity, 2020-2035
  • Table 20: Western Europe Soft Drinks Packaging Market Value (USD Mn) Forecast by Soft Drink Type, 2020-2035
  • Table 21: Eastern Europe Soft Drinks Packaging Market Value (USD Mn) Forecast by Country, 2020-2035
  • Table 22: Eastern Europe Soft Drinks Packaging Market Value (USD Mn) Forecast by Material , 2020-2035
  • Table 23: Eastern Europe Soft Drinks Packaging Market Value (USD Mn) Forecast by Product Type, 2020-2035
  • Table 24: Eastern Europe Soft Drinks Packaging Market Value (USD Mn) Forecast by Capacity, 2020-2035
  • Table 25: Eastern Europe Soft Drinks Packaging Market Value (USD Mn) Forecast by Soft Drink Type, 2020-2035
  • Table 26: East Asia Soft Drinks Packaging Market Value (USD Mn) Forecast by Country, 2020-2035
  • Table 27: East Asia Soft Drinks Packaging Market Value (USD Mn) Forecast by Material , 2020-2035
  • Table 28: East Asia Soft Drinks Packaging Market Value (USD Mn) Forecast by Product Type, 2020-2035
  • Table 29: East Asia Soft Drinks Packaging Market Value (USD Mn) Forecast by Capacity, 2020-2035
  • Table 30: East Asia Soft Drinks Packaging Market Value (USD Mn) Forecast by Soft Drink Type, 2020-2035
  • Table 31: South Asia and Pacific Soft Drinks Packaging Market Value (USD Mn) Forecast by Country, 2020-2035
  • Table 32: South Asia and Pacific Soft Drinks Packaging Market Value (USD Mn) Forecast by Material , 2020-2035
  • Table 33: South Asia and Pacific Soft Drinks Packaging Market Value (USD Mn) Forecast by Product Type, 2020-2035
  • Table 34: South Asia and Pacific Soft Drinks Packaging Market Value (USD Mn) Forecast by Capacity, 2020-2035
  • Table 35: South Asia and Pacific Soft Drinks Packaging Market Value (USD Mn) Forecast by Soft Drink Type, 2020-2035
  • Table 36: Middle East & Africa Soft Drinks Packaging Market Value (USD Mn) Forecast by Country, 2020-2035
  • Table 37: Middle East & Africa Soft Drinks Packaging Market Value (USD Mn) Forecast by Material , 2020-2035
  • Table 38: Middle East & Africa Soft Drinks Packaging Market Value (USD Mn) Forecast by Product Type, 2020-2035
  • Table 39: Middle East & Africa Soft Drinks Packaging Market Value (USD Mn) Forecast by Capacity, 2020-2035
  • Table 40: Middle East & Africa Soft Drinks Packaging Market Value (USD Mn) Forecast by Soft Drink Type, 2020-2035

List of Figures

  • Figure 1: Global Soft Drinks Packaging Market Pricing Analysis
  • Figure 2: Global Soft Drinks Packaging Market Value (USD Mn) Forecast 2020–2035
  • Figure 3: Global Soft Drinks Packaging Market Value (USD Mn) Share and BPS Analysis by Region, 2025 and 2035
  • Figure 4: Global Soft Drinks Packaging Market Y-o-Y Growth Comparison by Region, 2025–2035
  • Figure 5: Global Soft Drinks Packaging Market Attractiveness Analysis by Region
  • Figure 6: North America Soft Drinks Packaging Market Incremental Dollar Opportunity, 2025–2035
  • Figure 7: Latin America Soft Drinks Packaging Market Incremental Dollar Opportunity, 2025–2035
  • Figure 8: Western Europe Soft Drinks Packaging Market Incremental Dollar Opportunity, 2025–2035
  • Figure 9: Eastern Europe Soft Drinks Packaging Market Incremental Dollar Opportunity, 2025–2035
  • Figure 10: East Asia Soft Drinks Packaging Market Incremental Dollar Opportunity, 2025–2035
  • Figure 11: South Asia and Pacific Soft Drinks Packaging Market Incremental Dollar Opportunity, 2025–2035
  • Figure 12: Middle East & Africa Soft Drinks Packaging Market Incremental Dollar Opportunity, 2025–2035
  • Figure 13: North America Soft Drinks Packaging Market Value Share and BPS Analysis by Country, 2025 and 2035
  • Figure 14: Latin America Soft Drinks Packaging Market Value Share and BPS Analysis by Country, 2025 and 2035
  • Figure 15: Western Europe Soft Drinks Packaging Market Value Share and BPS Analysis by Country, 2025 and 2035
  • Figure 16: Eastern Europe Soft Drinks Packaging Market Value Share and BPS Analysis by Country, 2025 and 2035
  • Figure 17: East Asia Soft Drinks Packaging Market Value Share and BPS Analysis by Country, 2025 and 2035
  • Figure 18: South Asia and Pacific Soft Drinks Packaging Market Value Share and BPS Analysis by Country, 2025 and 2035
  • Figure 19: Middle East & Africa Soft Drinks Packaging Market Value Share and BPS Analysis by Country, 2025 and 2035
  • Figure 20: Global Soft Drinks Packaging Market – Tier Structure Analysis
  • Figure 21: Global Soft Drinks Packaging Market – Company Share Analysis

Frequently Asked Questions

How big is the soft drinks packaging market in 2025?

The global soft drinks packaging market is estimated to be valued at USD 90.0 billion in 2025.

What will be the size of soft drinks packaging market in 2035?

The market size for the soft drinks packaging market is projected to reach USD 125.7 billion by 2035.

How much will be the soft drinks packaging market growth between 2025 and 2035?

The soft drinks packaging market is expected to grow at a 3.4% CAGR between 2025 and 2035.

What are the key product types in the soft drinks packaging market?

The key product types in soft drinks packaging market are plastic, glass, metal, paper & paperboard and others.

Which product type segment to contribute significant share in the soft drinks packaging market in 2025?

In terms of product type, bottles segment to command 46.1% share in the soft drinks packaging market in 2025.

Explore Similar Insights

Future Market Insights

Soft Drinks Packaging Market