The Software Defined Networking Market is estimated to be valued at USD 30.6 billion in 2025 and is projected to reach USD 149.6 billion by 2035, registering a compound annual growth rate (CAGR) of 17.2% over the forecast period.
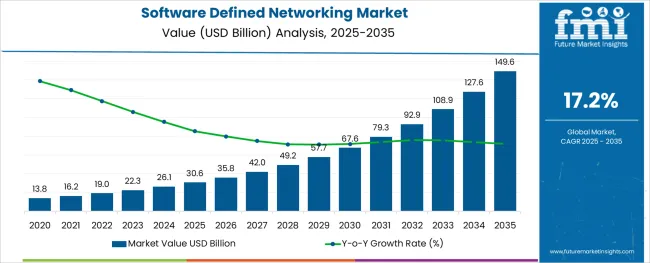
The software defined networking market is undergoing rapid evolution, supported by growing demand for agile, programmable, and scalable network infrastructure across data centers, telecom, and cloud service environments. Enterprises and service providers are transitioning away from traditional hardware-based architectures toward software-defined models to enhance network flexibility, reduce operational expenditure, and accelerate service deployment. The convergence of SDN with technologies like network function virtualization, edge computing, and multi-cloud orchestration is further expanding use cases.
Security is being embedded through micro-segmentation and policy-based controls, enabling centralized management of distributed resources. As 5G rollouts intensify and hybrid cloud models mature, software defined networks are becoming foundational to digital transformation initiatives.
The ability to abstract, automate, and centrally manage complex network environments is expected to continue shaping market momentum. Future opportunities will lie in open standards-based platforms, AI-driven traffic management, and industry-specific SDN deployments across financial services, healthcare, and manufacturing.
The market is segmented by SDN Type, End-User, Organization Size, and Application and region. By SDN Type, the market is divided into Open SDN, SDN via API, and SDN via Overlay. In terms of End-User, the market is classified into Service Providers and Enterprises. Based on Organization Size, the market is segmented into Large Enterprises and Small & Medium Enterprises.
By Application, the market is divided into BFSI, ITeS, Education, Retail, Manufacturing, Government & defence, Healthcare, and Others. Regionally, the market is classified into North America, Latin America, Western Europe, Eastern Europe, Balkan & Baltic Countries, Russia & Belarus, Central Asia, East Asia, South Asia & Pacific, and the Middle East & Africa.
The market is segmented by SDN Type, End-User, Organization Size, and Application and region. By SDN Type, the market is divided into Open SDN, SDN via API, and SDN via Overlay. In terms of End-User, the market is classified into Service Providers and Enterprises.
Based on Organization Size, the market is segmented into Large Enterprises and Small & Medium Enterprises. By Application, the market is divided into BFSI, ITeS, Education, Retail, Manufacturing, Government & defence, Healthcare, and Others. Regionally, the market is classified into North America, Latin America, Western Europe, Eastern Europe, Balkan & Baltic Countries, Russia & Belarus, Central Asia, East Asia, South Asia & Pacific, and the Middle East & Africa.
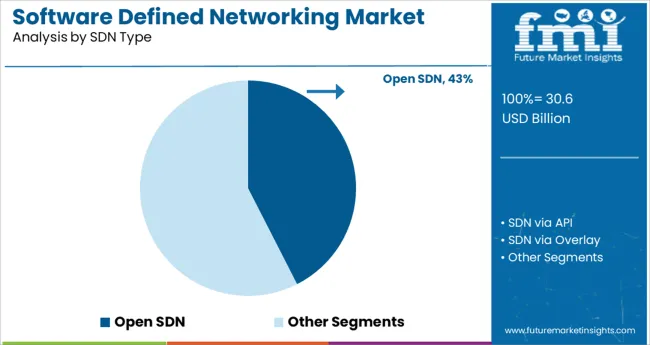
Within the SDN type category, the open SDN segment is expected to account for 42.5% of the total revenue share in 2025, making it the leading architecture model. This dominance is being driven by the global shift toward vendor-neutral, open-source-based frameworks that enable flexible integration and interoperability across network components.
Open SDN architectures support disaggregation of control and data planes, allowing enterprises and service providers to customize network behavior based on workload needs. The widespread support from communities and alliances such as the Open Networking Foundation has accelerated ecosystem development, further enhancing adoption.
Additionally, open SDN facilitates faster innovation cycles, reduces vendor lock-in, and aligns with DevOps-driven network management strategies. These capabilities have positioned open SDN as the preferred choice for operators seeking scalable and cost-efficient networking infrastructure.
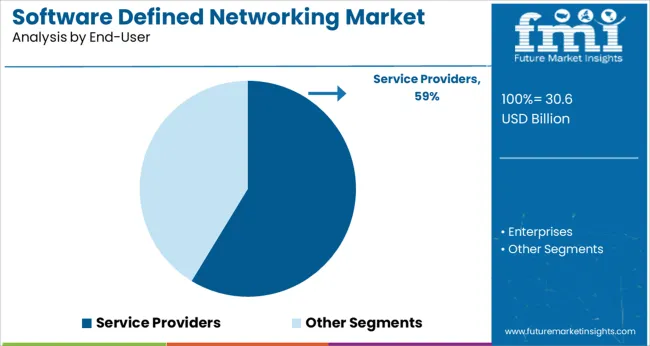
Among end-users, service providers are projected to capture 58.7% of the software defined networking market revenue in 2025, maintaining their position as the largest user group. The transition to software-centric infrastructure has become essential for telecom and internet service providers seeking to meet escalating bandwidth demands while improving agility and reducing operational complexity.
SDN enables dynamic bandwidth allocation, traffic engineering, and network slicing, which are critical for 5G deployment and edge service delivery. Service providers are leveraging SDN to enhance automation in provisioning, improve quality of service, and enable real-time network adjustments.
Investments in programmable core and transport networks are also being prioritized to support virtualization of services and cloud-native operations. These transformations have solidified the central role of service providers in driving market growth.
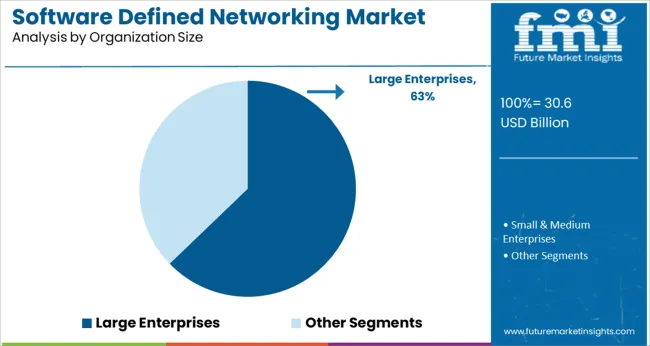
In the organization size category, large enterprises are forecast to hold a 62.8% share of the software defined networking market revenue in 2025, marking them as the dominant adopters. This leadership is attributed to the increasing complexity of enterprise IT environments, which require scalable and secure network solutions to support hybrid cloud, multi-site operations, and distributed applications.
SDN allows large organizations to centrally orchestrate network resources, enforce security policies, and optimize traffic flows in real time. The need for agility in digital transformation, combined with cost control objectives, has driven demand for infrastructure that supports automation, network segmentation, and self-service provisioning.
Furthermore, large enterprises are actively integrating SDN with AI and analytics tools to improve visibility, detect anomalies, and enhance performance. These capabilities have reinforced SDN’s strategic importance across enterprise IT infrastructures.
As per the Software-Defined Networking Market research by Future Market Insights - a market research and competitive intelligence provider, historically, from 2020 to 2024, the market value of the Software-Defined Networking Market increased at around 19.8% CAGR.
The enormous growth in the size and complex network infrastructures over the last decade has created a demand for solutions that can simplify and effectively manage the whole network. Software-defined networking technologies address these issues directly by giving the operator more freedom in traffic control to improve network efficiency.
As a result, a high percentage of Communication Service Providers (CSPs) worldwide are investing in software-defined networking technologies for end-to-end network and service administration and control.
Simplifying and automating network administration leads to better service provisioning. CSPs are configuring their networks to reap the benefits of a virtualized network infrastructure, which include increased agility, visibility, flexibility, and cost-efficiency.
CSPs are being forced to invest in software-defined networking technologies to reduce total CAPEX and OPEX costs and compete effectively in data-driven digitalization, which is progressively dominated and controlled by Over-the-Top (OTT) companies.
SDN serves as a link between applications, routers, and switches, relaying data, and information among them. SDN technologies aid in the rapid deployment of applications and services by providing a simulated view of the storage and network. The market for SD solutions is expected to increase owing to the rising need for service providers and key companies to increase the operational capability and bandwidth of carrier networks.
Increased data traffic from social media cloud computing, mobile devices, as well as the Internet of Things (IoT), is predicted to push data traffic in the future years, creating a rising need for upgraded networks.
Rising consumer preference for network virtualization and automation is a critical factor accelerating market growth. Furthermore, rising IoT adoption, the surge in demand for hybrid clouds, and expanding advancement of open-source SDN will provide new possibilities for the software-defined networking industry throughout the projection period.
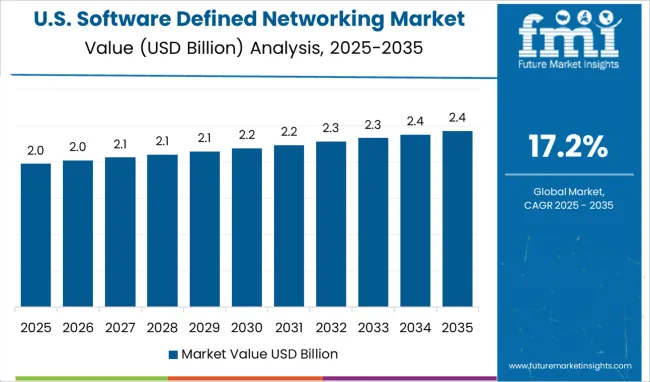
During the projected period, North America is projected to hold the largest share in the global Software-Defined Networking Market with a market size of over USD 50 Billion. North America leads the software-defined networking market owing to the increased acceptance of sophisticated technologies across multiple business verticals, increased usage of cloud computing and mobility solutions, and a surge in the need for network management for huge network traffic.
As they focus on shifting their network and IT services to the cloud, enterprises are swiftly embracing software-defined networking and network function virtualization technologies.
The SDN market in North America is likely to grow during the forecast period, owing to an increased market for 5G-based Internet of Things (IoT) technologies. Massive volumes of data are generated by IoT systems, necessitating a large quantity of bandwidth. Businesses are deploying SDN technology solutions to fully leverage data center networking resources to address these concerns.
Due to the increased IoT expenditures and 5G adoption, the demand for SDN is expected to stay during the projected period. Additionally, the requirement for high connectivity with low latency from sectors such as banking, financial services and insurance, multimedia, and digital media, is projected to drive demand for SDN solutions in North America.
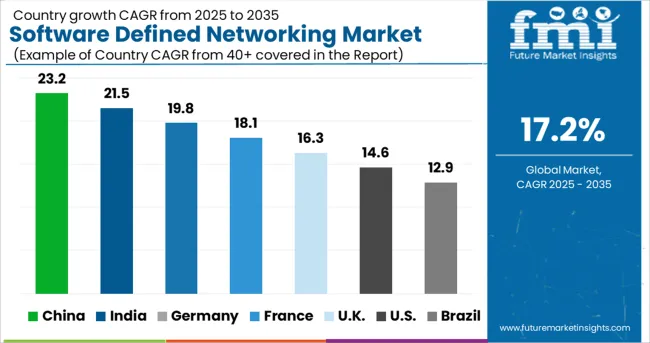
The United States is expected to have the highest market share of USD 149.6 Billion by the end of 2035 with an expected CAGR of 17% by the end of 2035. The number of mobile phone users in the USA surpassed 13.8 million in 2020 which is further expected to rise in the future years, consequently increasing the requirement for SDN for mobility and the development of resilient networking infrastructure.
The United States would require to invest approximately USD 150 Billion in fiber infrastructure over the next several years to meet the country's ever-increasing networking demand, fuelling the country's need for SDN.
IBM, Juniper Network, Cisco Systems, and Hewlett-Packard are among the leading participants the in the country. Due to the expanding business services and applications flowing across networks, these organizations have enormous development prospects in the SDN industry.
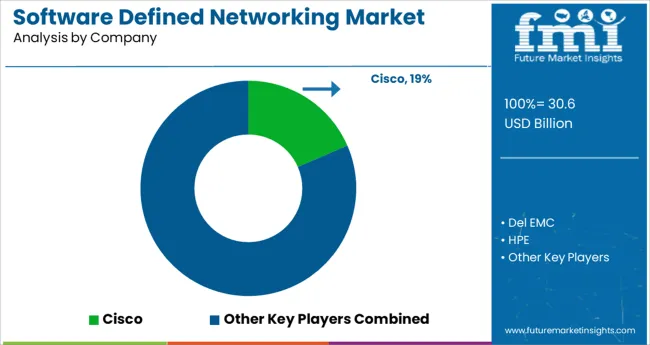
Network Equipment Providers (NEPs), network operators, corporations, and end users are key actors in the SDN value chain. Among the NEPs, the key players include Alcatel-Lucent, Cisco, NEC, IBM, VMware, and Juniper Networks.
They create SDN controller functions as well as simulated switches and routers. They provide a comprehensive variety of technologies and turnkey services that will be critical in driving SDN into conventional data center applications.
As new SDN entrants emerge and dominate the legacy networking system, SDN technology is exposed to a long-term challenge to incumbent hardware-based networking equipment providers. Furthermore, market rivalry and increasing network complexity have increased the demand for network robustness, network efficiency, and cloud services.
Similarly, recent developments related to companies in the Software-Defined Networking Market have been tracked by the team at Future Market Insights, which are available in the full report.
The global software defined networking market is estimated to be valued at USD 30.6 USD billion in 2025.
It is projected to reach USD 149.6 USD billion by 2035.
The market is expected to grow at a 17.2% CAGR between 2025 and 2035.
The key product types are open sdn, sdn via api and sdn via overlay.
service providers segment is expected to dominate with a 58.7% industry share in 2025.


Full Research Suite comprises of:
Market outlook & trends analysis
Interviews & case studies
Strategic recommendations
Vendor profiles & capabilities analysis
5-year forecasts
8 regions and 60+ country-level data splits
Market segment data splits
12 months of continuous data updates
DELIVERED AS:
PDF EXCEL ONLINE
Software Defined Networking (SDN) And Network Function Virtualization (NFV) Market Size and Share Forecast Outlook 2025 to 2035
Software-Defined Networking SDN Market Size and Share Forecast Outlook 2025 to 2035
Software Defined Video Networking Market
Software License Management (SLM) Market Size and Share Forecast Outlook 2025 to 2035
Software Containers Market Size and Share Forecast Outlook 2025 to 2035
Examining Market Share Trends in the Software Distribution Industry
Software Distribution Market Analysis by Deployment Type, by Organization Size and by Industry Vertical Through 2035
Software Defined Vehicle Market Size and Share Forecast Outlook 2025 to 2035
Software Defined Perimeter (SDP) Market Size and Share Forecast Outlook 2025 to 2035
Software-Defined Wide Area Network SD-WAN Market Size and Share Forecast Outlook 2025 to 2035
Software Defined Radio (SDR) Market Size and Share Forecast Outlook 2025 to 2035
Software-Defined Anything (SDx) Market Size and Share Forecast Outlook 2025 to 2035
Software-Defined Data Center Market Size and Share Forecast Outlook 2025 to 2035
Software Defined Application And Infrastructure Market Size and Share Forecast Outlook 2025 to 2035
Software-Defined Camera (SDC) Market Size and Share Forecast Outlook 2025 to 2035
Software-Defined WAN Market - Growth & Forecast through 2034
UK Software Distribution Market Analysis – Size & Industry Trends 2025-2035
VPN Software Market Size and Share Forecast Outlook 2025 to 2035
3PL Software Market Size and Share Forecast Outlook 2025 to 2035
GCC Software Distribution Market Analysis - Size, Share & Trends 2025 to 2035

Thank you!
You will receive an email from our Business Development Manager. Please be sure to check your SPAM/JUNK folder too.
Chat With
MaRIA