The Software-Defined Data Center Market is estimated to be valued at USD 74.6 billion in 2025 and is projected to reach USD 367.7 billion by 2035, registering a compound annual growth rate (CAGR) of 17.3% over the forecast period.
The software defined data center market is witnessing accelerated adoption as enterprises modernize infrastructure to support dynamic workloads, cost optimization, and hybrid cloud strategies. The growing demand for agile, scalable, and policy-driven data center architectures is being addressed through virtualization of compute, storage, and network layers managed by intelligent software controllers.
Enterprises are increasingly focusing on automation, workload orchestration, and real-time analytics to ensure efficient resource utilization while maintaining security and compliance. Cloud-native applications, AI-driven data operations, and containerization are reshaping how businesses approach infrastructure, with software defined solutions offering enhanced flexibility and reduced capital expenditure.
The market is further influenced by the growing shift toward remote operations, multi-cloud environments, and edge computing, which require cohesive management platforms. Future growth is expected from large-scale digital transformation programs across sectors such as BFSI, telecom, and government, where data center agility and centralized control are critical enablers of innovation and service continuity.
The market is segmented by Component, Organization Size, and Vertical and region. By Component, the market is divided into Software, Hardware, and Services. In terms of Organization Size, the market is classified into Large Enterprises and Small and Medium-sized Enterprises (SMEs). Based on Vertical, the market is segmented into BFSI, IT and Telecom, Government and Defense, Healthcare, Education, Retail, Manufacturing, and Others (Media and Entertainment, and Energy and Utilities). Regionally, the market is classified into North America, Latin America, Western Europe, Eastern Europe, Balkan & Baltic Countries, Russia & Belarus, Central Asia, East Asia, South Asia & Pacific, and the Middle East & Africa.
The market is segmented by Component, Organization Size, and Vertical and region. By Component, the market is divided into Software, Hardware, and Services. In terms of Organization Size, the market is classified into Large Enterprises and Small and Medium-sized Enterprises (SMEs). Based on Vertical, the market is segmented into BFSI, IT and Telecom, Government and Defense, Healthcare, Education, Retail, Manufacturing, and Others (Media and Entertainment, and Energy and Utilities). Regionally, the market is classified into North America, Latin America, Western Europe, Eastern Europe, Balkan & Baltic Countries, Russia & Belarus, Central Asia, East Asia, South Asia & Pacific, and the Middle East & Africa.
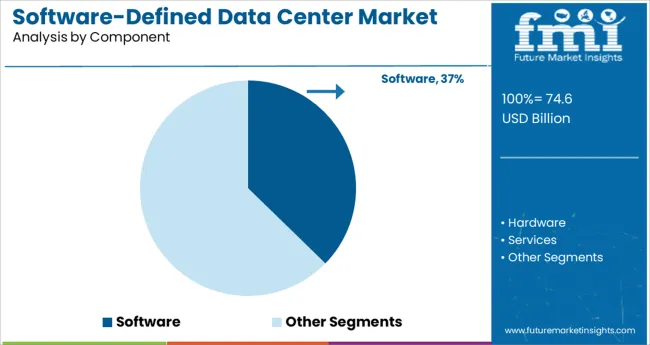
Within the component category, the software segment is anticipated to account for 37.3% of the total revenue share in 2025, positioning it as the dominant segment. This leadership is being driven by the increasing virtualization of traditional hardware-defined infrastructure elements such as servers, storage, and networks.
Software platforms that deliver centralized control, policy enforcement, and dynamic resource allocation have become fundamental to the modern data center. The flexibility offered by software components in managing hybrid and multi-cloud environments has significantly elevated their adoption across both enterprise and service provider landscapes.
Additionally, the evolution of AI-powered orchestration tools and intent-based networking has reinforced the shift toward software-first architecture. The ability to decouple physical infrastructure from service delivery while enhancing operational efficiency and reducing downtime has firmly established the software segment as a foundational element in next-generation data center deployments.
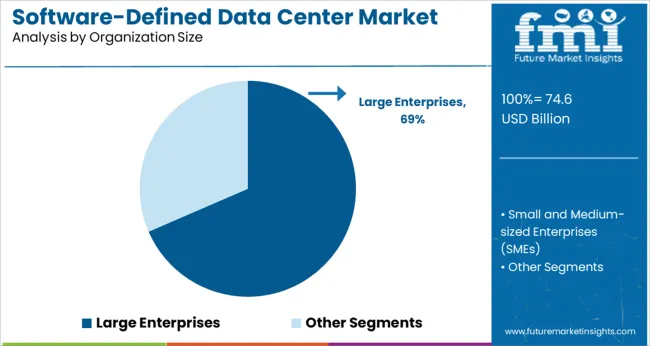
Large enterprises are projected to contribute 68.5% of the overall revenue in the organization size segment by 2025, making them the primary adopters of software defined data center technologies. This is due to their extensive infrastructure requirements, complex data management needs, and the need for continuous availability and scalability.
Large organizations are investing heavily in software defined frameworks to reduce operational overhead, improve energy efficiency, and accelerate digital transformation. Their capacity to implement comprehensive virtualization strategies across global operations has made them early adopters of intelligent data center automation.
Moreover, compliance demands, cybersecurity frameworks, and cross-region data redundancy requirements are being managed more efficiently through software defined platforms. Large enterprises are also leveraging data center abstraction to support evolving workloads like AI, big data analytics, and high-performance computing, further solidifying their dominant share in the market.
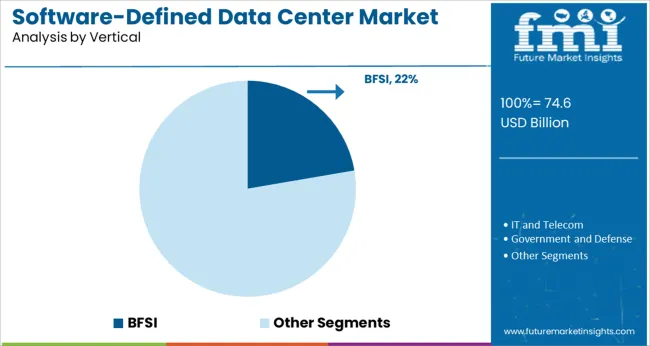
The BFSI vertical is expected to hold 22.3% of the total revenue share in 2025, securing its position as the leading industry within the software defined data center market. This dominance is driven by the sector’s continuous need for secure, compliant, and highly available infrastructure to manage sensitive financial data, real-time transactions, and growing volumes of customer interactions.
Financial institutions are prioritizing modernization of their core systems and data storage environments to align with regulatory requirements and ensure uninterrupted service delivery. Software defined architectures enable BFSI enterprises to achieve operational agility, disaster recovery resilience, and better risk management.
The adoption of digital banking, mobile platforms, and cloud-native services has further necessitated flexible and scalable data center frameworks. Additionally, software defined data centers support zero trust architecture and microsegmentation, both of which are critical for enhancing cybersecurity in the financial ecosystem, thereby reinforcing the vertical’s lead in the market.
As per the Software-Defined Data Center Market research by Future Market Insights - a market research and competitive intelligence provider, historically, from 2020 to 2024, the market value of the Software-Defined Data Center Market increased at around 22.8% CAGR.
Software Defined Data Center (SDDC) use has increased across industries such as telecom & IT, BFSI, retail, and healthcare due to the significant growth in big data and its cost-effectiveness. As a result of simplified and computerized software data Center operations, the market size of SDDC is expected to rise rapidly in near future.
The current market competitiveness and the global economic crisis have pushed the use of cost-effective strategies to restructure company models. Organizations are transitioning away from the process of purchasing and controlling hardware and adopting the dependable operations and maintenance Expenditure (OPEX) model. IT infrastructure spending accounts for a significant proportion of the companies’ overall cost.
DataCenter operators are attempting to reduce their OPEX and SDDC technologies which can help them reduce Capital Expenditure (CAPEX) and contribute to overall IT performance. SDDC systems can considerably reduce total energy consumption by automatically shutting off the hardware or lowering power levels when there is no or little demand. According to a VMware analysis of SDDC IT results, SDDC OPEX was 50% lesser than general data Centers, and SDDC IT productivity rose by 67%.
A significant reduction in OPEX is projected to make an impact on the company's overall financial performance. The integrated management of data Centers enables a unified interface control, which aids in enhancing efficiency and minimizing data Center costs and administration time. As per the Enterprise Strategy Group's 2020 poll, 49% of respondents believed that they were considerably ahead of their competitors in terms of the economic benefits of deploying Software-Defined Networking (SDN) which has increased the demand for SDDC globally.
The rapidly changing IT landscape is a key driving force for the demand for software-defined data centers. Organizations are using software-defined data Centers to boost IT agility and reduce IT infrastructure complexity. It will aid in the standardization of management solutions across infrastructure layers, allowing policy-driven provisions and pooled infrastructure resources to respond to new IT resource needs more quickly. It also enables end-user IT managers to cut operating expenses, chart a course for end-use modernization, and maintain control over provisioning. It enables apps to supply IT resources independently, and when appropriate software is deployed, the effort of an administration may be reduced significantly or totally in some circumstances. Such variables are the key drivers of the Software-Defined Data Center Market.
End-user businesses' desire to cut capital expenditure by reducing the data center footprint is fuelling industry growth. The technology simplifies and automates data Center operations, assisting end-user organizations in driving operational efficiency. The rapid use of modern technologies such as cloud, IoT, and AI is expected to increase demand for SDDC solutions. Its cloud management provides end-user organizations with an end-to-end overview of infrastructure services as well as significant capital investment savings via capacity planning and machine learning.
During the projected period, North America is projected to hold the largest size in the global Software-Defined Data Center Market with a market size of over USD 100 Billion.
Due to a large number of new SDDC installations and upgrades to existing data Center infrastructure systems in the region, North America leads the software-defined data center industry. The presence of firms including VMware, Inc., IBM Corporation, Cisco Systems, Inc., and others have further contributed to the demand growth.
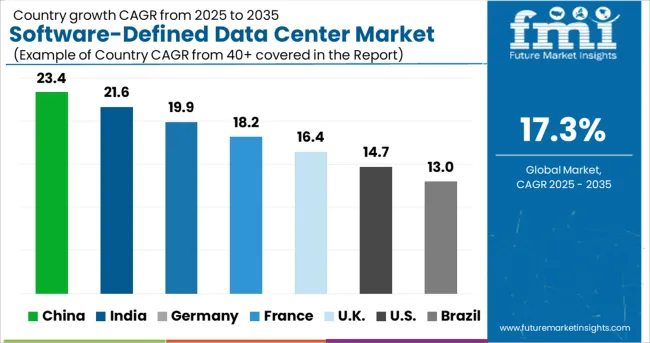
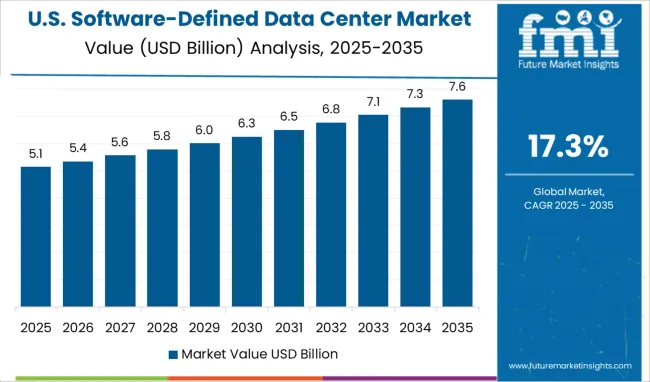
The United States is expected to account for the highest market size of USD 367.7 Billion by the end of 2035 with an expected CAGR of 16.7% by the end of 2035. The US is home to some of the most powerful IT corporations across the globe that have established data Centers in the United States. Northern Virginia, Northern New Jersey, Santa Clara, Dallas, and Chicago are among the key data center metro regions in the country. Companies in the United States are working on adapting to newer technologies.
Companies are focusing on software-defined data Centers over old hardware data Centers to reduce costs and enhance scalability, availability, and efficiency. As a result, the presence of a large number of IT and telecom behemoths, as well as the growing emphasis of companies on improving efficiency and lowering operational costs, have been the key factors that are expected to boost the development of the software-defined data center market in the United States.
The hardware segment is forecasted to grow at the highest CAGR of around 19.5% from 2025 to 2035. SDDC eliminates the need for businesses to purchase hardware, and acquire vendor-specific skills to manage and execute it or manage physical machine changes. It increases resource management in the firm, resulting in greater overall efficiency.
In addition, the popularity of software-defined data Centers is increasing to ensure more control and administration of both hardware and software. According to a Computer World white paper, up to 13% of servers acquired over the coming years would be used to handle machine learning, predictive analytics, and artificial intelligence in software-defined data Centers. Firms, on the other hand, may underestimate the challenges of employing obsolete platforms and maintaining new IT infrastructure.
The Software-Defined Computing (SDC) segment is forecasted to grow at the highest CAGR of around 18.7% from 2025 to 2035. Due to the popularity of the cloud-native application, SDC accounts for a large market share. A cloud-native application uses cloud computing concepts to decrease deployment risks while improving performance, service flexibility, and quality. Cloud-native apps are compatible with both on-premises as well as cloud application platforms.
One of the primary benefits of software-defined computing is that it allows infrastructure to become more adaptable, allowing them to serve several clients or consumers simultaneously. The infrastructure may be divided into components that can be provided on demand using virtualization technologies. This has been a defining feature of the cloud services revolution.
Virtualization and software-defined computing have also resulted in the software-defined data Center, in which all a data Center’s technological components are virtualized and represented as software functions. Network administrators may expedite many management operations by streamlining the data center and making it more readily scalable by utilizing software-defined computing and virtualization.
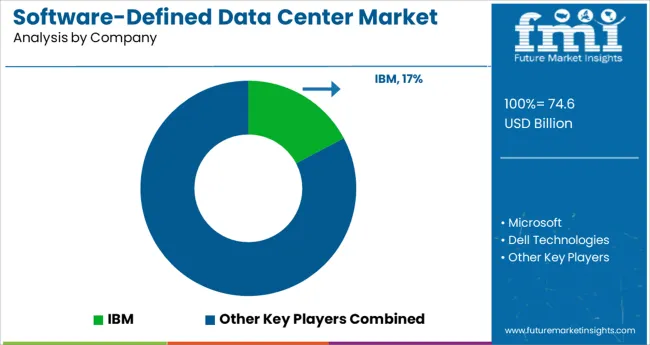
The Software-Defined Data Center Market is highly concentrated, with fewer competitors accounting for the vast majority of the market share. The established firms are attempting to obtain supremacy in this sector. These firms are increasing their profits and market shares through smart joint projects.
Some of the recent developments in the Software-Defined Data Center market include:
Similarly, recent developments related to companies in Software-Defined Data Centers Market have been tracked by the team at Future Market Insights, which is available in the full report.
The global software-defined data center market is estimated to be valued at USD 74.6 billion in 2025.
It is projected to reach USD 367.7 billion by 2035.
The market is expected to grow at a 17.3% CAGR between 2025 and 2035.
The key product types are software, hardware, services, _training and consulting, _integration and deployment, _support and maintenance and _managed services.
large enterprises segment is expected to dominate with a 68.5% industry share in 2025.


Full Research Suite comprises of:
Market outlook & trends analysis
Interviews & case studies
Strategic recommendations
Vendor profiles & capabilities analysis
5-year forecasts
8 regions and 60+ country-level data splits
Market segment data splits
12 months of continuous data updates
DELIVERED AS:
PDF EXCEL ONLINE
DataOps Platform Market Size and Share Forecast Outlook 2025 to 2035
Data Acquisition Hardware Market Size and Share Forecast Outlook 2025 to 2035
Data Discovery Market Size and Share Forecast Outlook 2025 to 2035
Data Masking Technology Market Size and Share Forecast Outlook 2025 to 2035
Data Centre Rack Server Market Size and Share Forecast Outlook 2025 to 2035
Data Business in Oil & Gas Market Size and Share Forecast Outlook 2025 to 2035
Data Centre Colocation Market Size and Share Forecast Outlook 2025 to 2035
Data Lake Market Size and Share Forecast Outlook 2025 to 2035
Data Lakehouse Market Size and Share Forecast Outlook 2025 to 2035
Data Centre UPS Market Size and Share Forecast Outlook 2025 to 2035
Data-Driven Retail Solution Market Size and Share Forecast Outlook 2025 to 2035
Data Science Platform Market Size and Share Forecast Outlook 2025 to 2035
Data Monetization Platform Market Size and Share Forecast Outlook 2025 to 2035
Data Conversion Services Market Size and Share Forecast Outlook 2025 to 2035
Data Exfiltration Market Size and Share Forecast Outlook 2025 to 2035
Data Virtualization Cloud Market Analysis – Growth & Forecast 2025 to 2035
Data Management Platforms Market Analysis and Forecast 2025 to 2035, By Type, End User, and Region
Data Fabric Market Analysis - Trends, Size & Forecast 2025 to 2035
Data Warehouse as a Service Market - Cloud Trends & Forecast 2025 to 2035
Data Catalog Market Trends - Growth & Forecast 2025 to 2035

Thank you!
You will receive an email from our Business Development Manager. Please be sure to check your SPAM/JUNK folder too.
Chat With
MaRIA