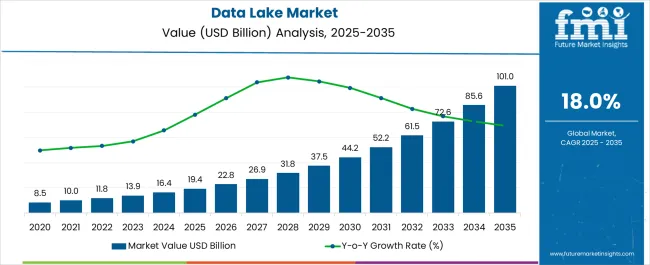
The Data Lake Market is estimated to be valued at USD 19.4 billion in 2025 and is projected to reach USD 101.0 billion by 2035, registering a compound annual growth rate (CAGR) of 18.0% over the forecast period.
| Metric | Value |
|---|---|
| Data Lake Market Estimated Value in (2025 E) | USD 19.4 billion |
| Data Lake Market Forecast Value in (2035 F) | USD 101.0 billion |
| Forecast CAGR (2025 to 2035) | 18.0% |
The data lake market is expanding steadily as enterprises seek scalable platforms to manage growing volumes of structured and unstructured data. Current demand is being driven by rising digital transformation initiatives, greater reliance on advanced analytics, and the integration of artificial intelligence and machine learning into core business processes.
Cloud-based adoption is accelerating due to its cost efficiency, flexibility, and ability to handle dynamic workloads, while on-premises deployment continues to be preferred in highly regulated sectors. The market outlook remains strong with increasing investment in big data technologies, expanding use cases across industries, and a greater focus on data governance and security.
Growth rationale is built on the need for real-time insights, operational agility, and improved decision-making enabled by centralized data storage and access As businesses enhance customer engagement and optimize operations through advanced analytics, the data lake market is positioned to achieve consistent growth, underpinned by technological advancements and strategic industry adoption.
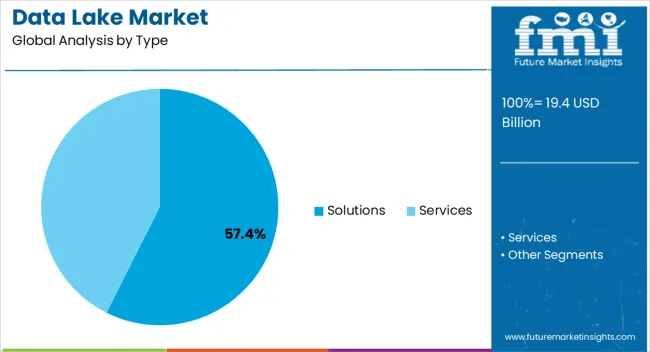
The solutions segment, holding 57.40% of the type category, has been leading due to its comprehensive role in addressing the growing need for efficient data management frameworks. Enterprises are increasingly deploying solutions that provide scalability, integration with advanced analytics, and robust security features.
The dominance of this segment has been reinforced by its ability to support diverse industry requirements, ranging from real-time analytics to predictive modeling. Adoption has been further supported by innovation in metadata management, governance frameworks, and compliance capabilities, which enhance the overall value proposition.
As organizations continue to consolidate data from multiple sources, the solutions segment is expected to sustain its leadership and capture further opportunities driven by expanding demand for enterprise-grade big data architectures.
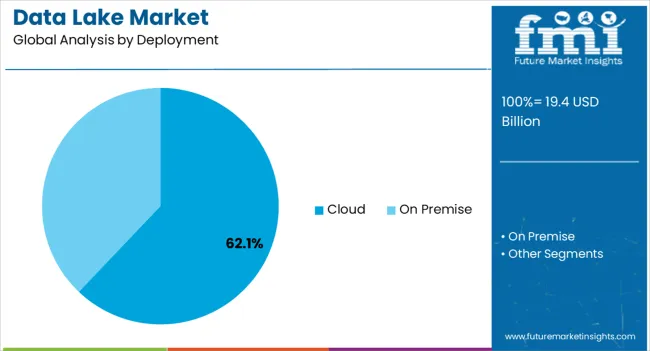
The cloud deployment segment, accounting for 62.10% of the deployment category, has emerged as the dominant model due to its inherent scalability and cost efficiency. Organizations are leveraging cloud-based data lakes to reduce infrastructure costs, ensure flexibility, and achieve faster deployment cycles.
Growth is being reinforced by increasing adoption of hybrid and multi-cloud strategies, which allow businesses to balance compliance with performance. Enhanced cloud-native tools for analytics, governance, and security are contributing to accelerated uptake.
The segment’s leadership is expected to persist as enterprises prioritize agility, data accessibility, and global scalability, making cloud deployment the preferred choice for both established corporations and emerging businesses across industries.
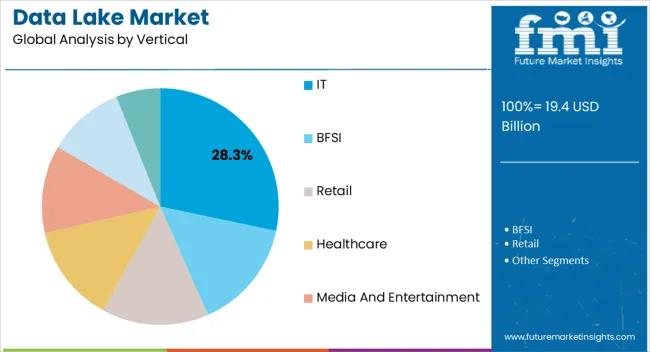
The IT vertical, representing 28.30% of the vertical category, has remained at the forefront of adoption, reflecting its critical role in leveraging data lakes for operational efficiency and service delivery optimization. IT organizations are utilizing data lakes to integrate vast amounts of customer, operational, and transactional data, enabling improved analytics and strategic decision-making.
The segment has been supported by the rising demand for digital transformation solutions, continuous innovation in IT service models, and the growing need for cloud-native architectures. Data lake adoption within the IT sector has been further driven by requirements for real-time insights, enhanced cybersecurity monitoring, and automation support.
This vertical is expected to continue its leadership role as enterprises increasingly rely on IT services and solutions to power data-driven strategies.
| Report Attributes | Details |
|---|---|
| Market value in 2020 | USD 7.5 billion |
| Market value in 2025 | USD 13.7 billion |
| CAGR from 2020 to 2025 | 16% |
During the historical period, 2020 to 2025, the market rose at a CAGR of 16%. The need for advanced data analytical and storage solutions like data lakes has increased due to the exponential rise in data creation from a variety of sources, including social media, IoT devices, and linked technologies. Companies are using data lakes to handle massive, varied information and extract insights from them, which is propelling market expansion.
Companies in a variety of sectors are realizing more and more how important data is to making wise decisions. Data lake solutions are being used more often as a result of the change to a data driven culture. This gives companies the ability to use big data for strategic decision making and to obtain an advantage in the global market.
The table below lists the top five nations expected to forecast prominent growth during the forecast period. Japan and Australia are predicted to have the maximum development among these nations.
Forecast CAGRs from 2025 to 2035
| Countries | CAGR from 2025 to 2035 |
|---|---|
| The United States | 16.80% |
| Japan | 20.20% |
| Germany | 18.40% |
| China | 19.50% |
| Australia | 22.50% |
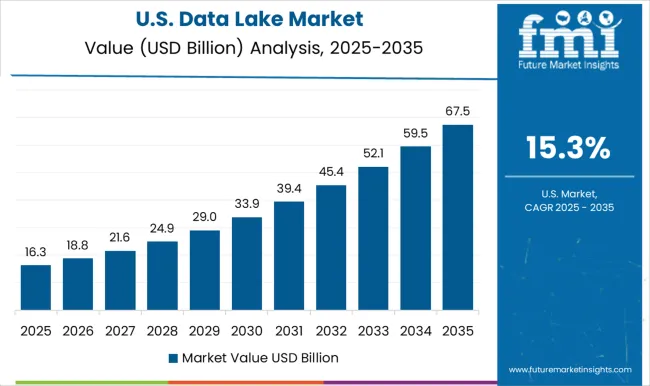
The United States market for data lakes is likely to garner a 16.80% CAGR during the forecast period. The growing usage of cloud computing is driving considerable development in the data lake market in the United States. Data lakes are becoming more and more popular among businesses as a scalable and affordable option for managing enormous volumes of heterogeneous data.
There is strong focus on machine learning and sophisticated analytics, especially in the financial, banking and healthcare industries. The country has a determination to leverage data for breakthrough insights that will spur innovation and competitiveness in a rapidly changing digital environment.
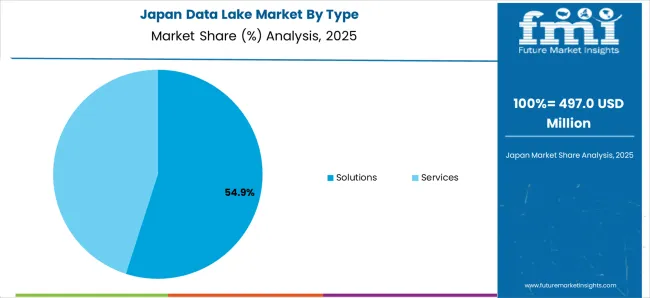
The data lake market in Japan is poised to expand at a 20.20% CAGR from 2025 to 2035. Japan is moving towards fast adoption of Industry 4.0 as well as smart manufacturing, which has positively affected the data lake industry of Japan in a unique way.
One key factor that increases operational efficiency and promotes technical improvements is the integration of robots and Internet of Things (IoT) technologies with data lakes. A significant motivator is the strict emphasis on data security and privacy, which is reflected in its strong regulations.
These factors demonstrate the dedication of Japan towards establishing a reliable and safe data environment, which is necessary for long term development and technological leadership.
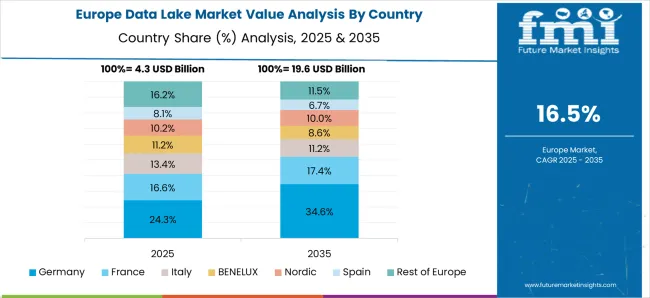
The Germany market for data lake is poised to develop at an 18.40% CAGR during the forecast period. The dedication of the country towards data sovereignty is a distinctive factor propelling the national data lake industry.
Maintaining ownership and control over data is highly valued in Germany, particularly in delicate industries like healthcare and banking. The need for data lake solutions that provide safe and compliant storage and guarantee that sensitive data stays inside national boundaries reflects this emphasis on data sovereignty.
The China market for data lakes is likely to expand at a 19.50% CAGR from 2025 to 2035. The data lake industry in China is expanding rapidly owing to government programs like 'Internet Plus' and a deliberate emphasis on the creation of smart cities.
Incorporation of data lakes, which enable all encompassing urban development and planning is supporting such initiatives. Traditional industries like manufacturing and agriculture have a specific regional driver in the emphasis on data driven decision making. In the future, China aims to use data as a catalyst for social progress, technical innovation, and economic expansion.
The Australia data lake market is poised to expand at a 22.50% CAGR during the forecast period. The market for data lakes in Australia is booming as companies focus more on data driven initiatives to improve customer experiences.
The utilization of data lakes in the energy and mining industries of the natural resource industry is a distinct regional accelerator. Businesses may optimize operations and increase their competitiveness by effectively managing and gaining insights from the enormous datasets present in resource intensive sectors.
The importance of data lakes as vital facilitators of creativity, effectiveness, and sustainability in the Australian region is underscored by its geographical size and the distinct problems presented by its sectors.
The table below highlights how the on premise data is projected to take up a significant global market share. The solutions segment is likely to garner a significant market share in 2025.
| Category | Market share in 2025 |
|---|---|
| On Premise | 62.30% |
| Solutions | 64.50% |
The on premise segment is expected to acquire a market share of 62.30% in 2025. Concerns about compliance, data security, and regulatory requirements are driving the global data lake market toward an increasing number of on premise data solutions. In order to maintain better control over sensitive data and guarantee that it stays within their physical infrastructure, many firms are choosing to use on premise data lakes.
By addressing latency issues, this deployment type facilitates quicker access to data for important decision making. The on premise approach provides a strong alternative for enterprises looking to balance the advantages of data lake technology alongside the need to maintain a safe and compliant data environment.
Based on the data type, the solutions segment is anticipated to take up a significant global market share. In 2025, the solutions segment is likely to acquire a 64.50% global market share.
The growing need for accurate and integrated data management solutions is driving the growth of the solutions type segment in the global data lake market. Companies understand the value of end to end solutions that include analytics, storage, processing, and data input all on one platform. Integrated solutions increase productivity, simplify processes, and lessen the difficulty of handling various components.
A comprehensive strategy offered by solutions types is desirable as firms struggle with increasing amounts of diverse information, providing a coherent plan to fully utilize data lakes. The market's shift toward more complex and comprehensive data management solutions is highlighted by this trend.
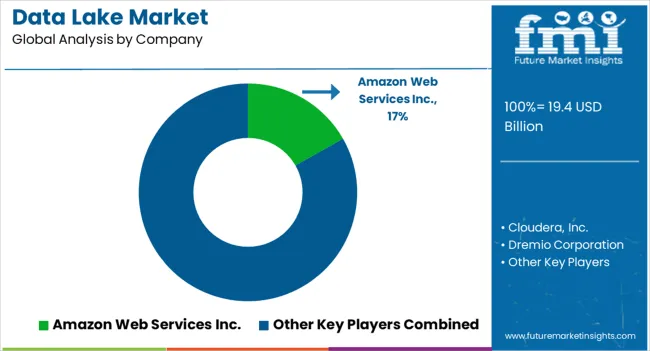
Companies within the global data lake market are using novel strategies to maintain their competitiveness. In order to optimize scalability and adaptability, many are using a hybrid solution that combines on premises along with cloud based data storage.
Organizations are increasingly using sophisticated analytics integration to extract insights from large datasets that may be put to use. By using these tactics, companies may effectively handle and evaluate a variety of data sources, making the most use of their resources and being ahead of the always changing data landscape.
Some of the prominent developments by the key companies in this domain are
| Company | Key Developments |
|---|---|
| Amazon Web Services Inc. |
|
| Cloudera, Inc. |
|
| Attribute | Details |
|---|---|
| Projected market value in 2025 | USD 19.4 billion |
| Projected market value in 2035 | USD 101.0 billion |
| Forecast CAGR from 2025 to 2035 | 18.0% |
| Forecast period | 2025 to 2035 |
| Historical period | 2020 to 2025 |
| Market analysis | Value in USD billion |
| Key regions covered | North America; Latin America; Western Europe; Eastern Europe; South Asia and Pacific; East Asia; The Middle East & Africa |
| Key countries profiled | The United States, Canada, Brazil, Mexico, Germany, The United Kingdom, France, Spain, Italy, Russia, Poland, Czech Republic, Romania, India, Bangladesh, Australia, New Zealand, China, Japan, South Korea, GCC countries, South Africa, Israel |
| Key market segments | Type, Deployment, Vertical, Region |
| Key companies profiled | Amazon Web Services Inc.; Cloudera, Inc.; Dremio Corporation; Informatica Corporation; Microsoft Corporation; Oracle Corporation; SAS Institute Inc.; Snowflake Inc.; Teradata Corporation; Zaloni Inc. |
The global data lake market is estimated to be valued at USD 19.4 billion in 2025.
The market size for the data lake market is projected to reach USD 101.9 billion by 2035.
The data lake market is expected to grow at a 18.1% CAGR between 2025 and 2035.
The key product types in data lake market are solutions and services.
In terms of deployment, cloud segment to command 62.1% share in the data lake market in 2025.


Full Research Suite comprises of:
Market outlook & trends analysis
Interviews & case studies
Strategic recommendations
Vendor profiles & capabilities analysis
5-year forecasts
8 regions and 60+ country-level data splits
Market segment data splits
12 months of continuous data updates
DELIVERED AS:
PDF EXCEL ONLINE
Data Lakehouse Market Size and Share Forecast Outlook 2025 to 2035
DataOps Platform Market Size and Share Forecast Outlook 2025 to 2035
Datacenter Infrastructure Services Market Size and Share Forecast Outlook 2025 to 2035
Data Acquisition Hardware Market Size and Share Forecast Outlook 2025 to 2035
Data Center Automatic Transfer Switches and Switchgears Market Size and Share Forecast Outlook 2025 to 2035
Data Discovery Market Size and Share Forecast Outlook 2025 to 2035
Data Masking Technology Market Size and Share Forecast Outlook 2025 to 2035
Data Centre Rack Server Market Size and Share Forecast Outlook 2025 to 2035
Data Center Power Management Industry Analysis in Western Europe Size and Share Forecast Outlook 2025 to 2035
Data Center Power Management Industry Analysis in Korea Size and Share Forecast Outlook 2025 to 2035
Data Center Liquid Cooling Market Size and Share Forecast Outlook 2025 to 2035
Data Business in Oil & Gas Market Size and Share Forecast Outlook 2025 to 2035
Data Centre Colocation Market Size and Share Forecast Outlook 2025 to 2035
Data Center RFID Market Size and Share Forecast Outlook 2025 to 2035
Data Center Accelerator Market Size and Share Forecast Outlook 2025 to 2035
Data Center Outsourcing Market Size and Share Forecast Outlook 2025 to 2035
Data Center Refrigerant Market Size and Share Forecast Outlook 2025 to 2035
Data Center Fire Detection And Suppression Market Size and Share Forecast Outlook 2025 to 2035
Data Center Security Market Size and Share Forecast Outlook 2025 to 2035
Data Center Construction Market Size and Share Forecast Outlook 2025 to 2035

Thank you!
You will receive an email from our Business Development Manager. Please be sure to check your SPAM/JUNK folder too.
Chat With
MaRIA