The Data Conversion Services Market is estimated to be valued at USD 85.7 billion in 2025 and is projected to reach USD 1190.9 billion by 2035, registering a compound annual growth rate (CAGR) of 30.1% over the forecast period.
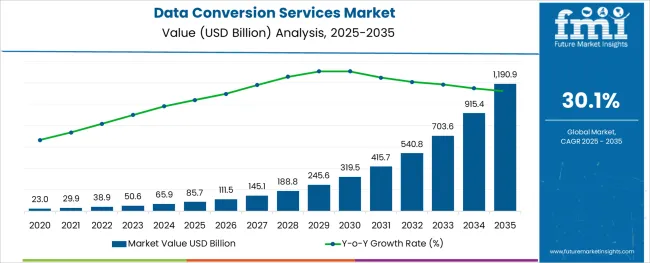
The data conversion services market is expanding steadily, driven by the increasing volume of digital data and the growing need for efficient data management across industries. Organizations are seeking to transform legacy data into modern, usable formats to support digital transformation and enhance operational efficiency.
The rise of large enterprises investing heavily in data modernization and integration projects has contributed significantly to market growth. Advances in automation and AI-powered conversion tools have improved accuracy and reduced turnaround times, making data conversion services more accessible and cost-effective.
Additionally, the IT and telecom sectors have emerged as key adopters, leveraging data conversion to support cloud migration, customer analytics, and regulatory compliance. The market outlook remains positive as enterprises prioritize seamless data interoperability and management strategies to stay competitive.
The market is segmented by Service Type, Enterprise Size, and Industry and region. By Service Type, the market is divided into HTML Conversion Services, XML Conversion Services, Document Conversion Services, Media Format Conversion Services, SGML Conversion Services, Catalog Conversion Services, and Others. In terms of Enterprise Size, the market is classified into Large Enterprises and Small and Medium Enterprise. Based on Industry, the market is segmented into IT & Telecom, Media & Publishing, Healthcare, Education, BFSI, Manufacturing, and Others. Regionally, the market is classified into North America, Latin America, Western Europe, Eastern Europe, Balkan & Baltic Countries, Russia & Belarus, Central Asia, East Asia, South Asia & Pacific, and the Middle East & Africa.
The market is segmented by Service Type, Enterprise Size, and Industry and region. By Service Type, the market is divided into HTML Conversion Services, XML Conversion Services, Document Conversion Services, Media Format Conversion Services, SGML Conversion Services, Catalog Conversion Services, and Others. In terms of Enterprise Size, the market is classified into Large Enterprises and Small and Medium Enterprise. Based on Industry, the market is segmented into IT & Telecom, Media & Publishing, Healthcare, Education, BFSI, Manufacturing, and Others. Regionally, the market is classified into North America, Latin America, Western Europe, Eastern Europe, Balkan & Baltic Countries, Russia & Belarus, Central Asia, East Asia, South Asia & Pacific, and the Middle East & Africa.
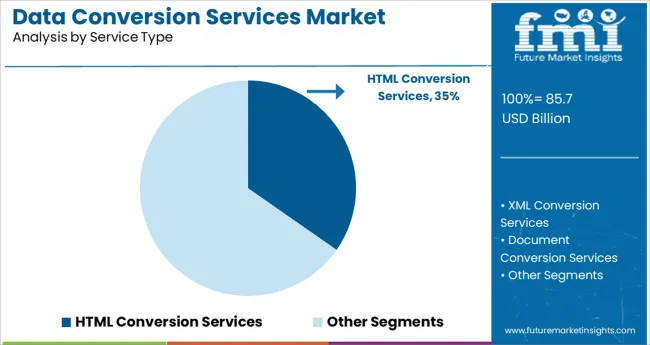
The HTML Conversion Services segment is expected to account for 34.7% of the data conversion services market revenue in 2025, leading the service category. This segment’s growth has been fueled by the increasing demand for web-compatible content conversion to support digital publishing, e-learning, and online documentation.
Organizations have favored HTML conversion due to its compatibility across devices and platforms, facilitating enhanced content accessibility. The segment has benefited from technological advancements that allow automated conversion while preserving document structure and formatting.
As online presence becomes critical for businesses, the need for efficient HTML content conversion is expected to continue driving the segment’s growth.
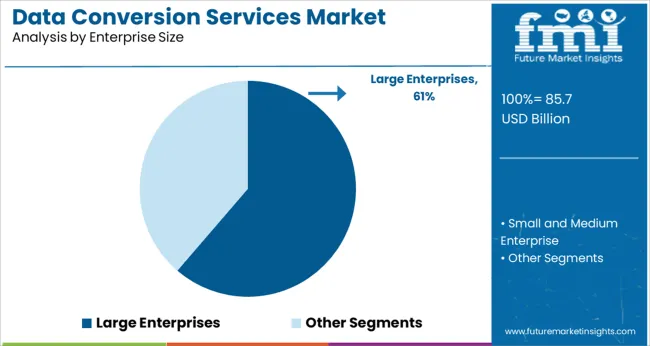
The Large Enterprises segment is projected to contribute 61.3% of the data conversion services market revenue in 2025, holding the dominant position. Large organizations have substantial data assets requiring conversion for modernization, migration, and compliance purposes. Their complex IT environments and extensive digital workflows create strong demand for reliable and scalable conversion solutions.
Investment capacity and focus on digital transformation initiatives have enabled large enterprises to adopt comprehensive data conversion services. This segment’s growth is also supported by regulatory requirements that mandate data standardization and accuracy.
As digital data volumes expand, large enterprises are expected to continue driving market demand.
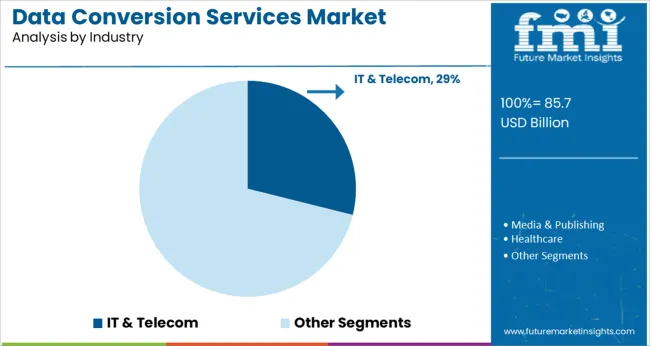
The IT & Telecom industry segment is projected to hold 28.9% of the data conversion services market revenue in 2025, positioning it as a leading industry user. Growth in this segment has been propelled by rapid technological evolution and the need to manage large volumes of data generated by telecom networks and IT services.
The industry relies on data conversion services to ensure seamless migration to new systems, support analytics, and maintain data quality. Increasing adoption of cloud computing and digital platforms in IT and telecom has intensified the requirement for effective data transformation and integration.
As these industries continue to innovate and expand globally, the demand for data conversion services is expected to grow steadily.
The increasing demand for data conversion services and high-quality data drives the growth of the global data conversion services market and sales of data conversion services.
Data conversion services have a significant contribution to growth toward cloud deployments and the need for disaster recovery for business continuity, thus driving the global data conversion services market as well as the data conversion services market in the forecast period.
The risk of data loss is challenging the growth of the global data conversion services market and demand for data conversion services along with sales of data conversion services. In addition to that, platform, network, and other complexities would also hinder the demand for data conversion services and sales of data conversion services during the forecast period.
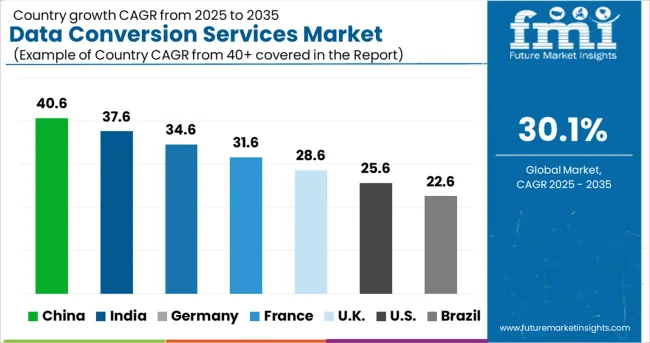
Among all the regional markets, the market in North America holds the largest data conversion services market share and is estimated to record a steady growth rate for the demand for data conversion services and sales of data conversion services during the forecast period due to the direct presence of a majority of data conversion services vendors.
The data conversion services market in Asia Pacific countries is expected to record the strong adoption rates due to increasing adoption of data conversion services software and services among SMEs, influenced by the adoption of IoT-based technologies and increasing digitalization and surged demand for data conversion services and skyrocketing sales of data conversion services.
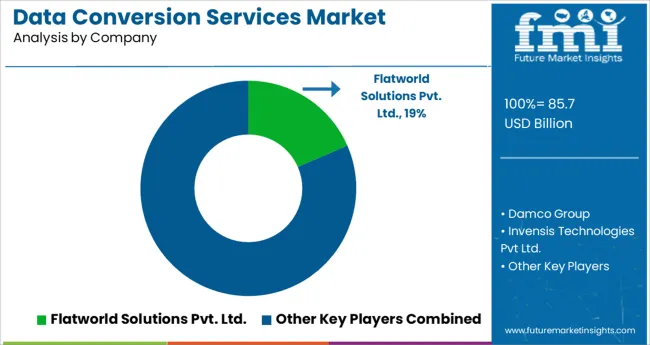
Key players in the data conversion services market include IBM Corporation; Oracle; Amazon Web Services; Microsoft; SAS Institute; SAP SE; Informatica; Talend; Attunity; TIBCO Software; Invensis Technologies Pvt Ltd; Syncsort, Damco Solutions and others.
Court Square Group and Data Conversion Laboratory (DCL) will form collaboration in July 2024 to serve worldwide life sciences enterprises. By delivering information management and content structuring solutions, the collaboration will aid clinical and drug development processes.
| Report Attribute | Details |
|---|---|
| Growth rate | CAGR of 30.1% from 2025 to 2035 |
| Base year for estimation | 2024 |
| Historical data | 2020 to 2024 |
| Forecast period | 2025 to 2035 |
| Quantitative units | Revenue in million and CAGR from 2025 to 2035 |
| Report coverage | Revenue forecast, volume forecast, company ranking, competitive landscape, growth factors, and trends, Pricing Analysis |
| Segments covered | Service type, Enterprise Type, Industry, region |
| Regional scope | North America; Western Europe; Eastern Europe; Middle East; Africa; ASEAN; South Asia; Rest of Asia; Australia and New Zealand |
| Country scope | USA, Canada, Mexico, Germany, UK, France, Italy, Spain, Russia, Belgium, Poland, Czech Republic, China, India, Japan, Australia, Brazil, Argentina, Colombia, Saudi Arabia, UAE, Iran, South Africa |
| Key companies profiled | IBM Corporation; Oracle; Amazon Web Services; Microsoft; SAS Institute; SAP SE; Informatica; Talend; Attunity; TIBCO Software; Invensis Technologies Pvt Ltd; Syncsort; Damco Solutions and others |
| Customization scope | Free report customization (equivalent to up to 8 analysts’ working days) with purchase. Addition or alteration to country, regional & segment scope. |
| Pricing and purchase options | Avail customized purchase options to meet your exact research needs. |
The global data conversion services market is estimated to be valued at USD 85.7 billion in 2025.
It is projected to reach USD 1,190.9 billion by 2035.
The market is expected to grow at a 30.1% CAGR between 2025 and 2035.
The key product types are html conversion services, xml conversion services, document conversion services, media format conversion services, sgml conversion services, catalog conversion services and others.
large enterprises segment is expected to dominate with a 61.3% industry share in 2025.


Our Research Products

The "Full Research Suite" delivers actionable market intel, deep dives on markets or technologies, so clients act faster, cut risk, and unlock growth.

The Leaderboard benchmarks and ranks top vendors, classifying them as Established Leaders, Leading Challengers, or Disruptors & Challengers.

Locates where complements amplify value and substitutes erode it, forecasting net impact by horizon

We deliver granular, decision-grade intel: market sizing, 5-year forecasts, pricing, adoption, usage, revenue, and operational KPIs—plus competitor tracking, regulation, and value chains—across 60 countries broadly.

Spot the shifts before they hit your P&L. We track inflection points, adoption curves, pricing moves, and ecosystem plays to show where demand is heading, why it is changing, and what to do next across high-growth markets and disruptive tech

Real-time reads of user behavior. We track shifting priorities, perceptions of today’s and next-gen services, and provider experience, then pace how fast tech moves from trial to adoption, blending buyer, consumer, and channel inputs with social signals (#WhySwitch, #UX).

Partner with our analyst team to build a custom report designed around your business priorities. From analysing market trends to assessing competitors or crafting bespoke datasets, we tailor insights to your needs.
Supplier Intelligence
Discovery & Profiling
Capacity & Footprint
Performance & Risk
Compliance & Governance
Commercial Readiness
Who Supplies Whom
Scorecards & Shortlists
Playbooks & Docs
Category Intelligence
Definition & Scope
Demand & Use Cases
Cost Drivers
Market Structure
Supply Chain Map
Trade & Policy
Operating Norms
Deliverables
Buyer Intelligence
Account Basics
Spend & Scope
Procurement Model
Vendor Requirements
Terms & Policies
Entry Strategy
Pain Points & Triggers
Outputs
Pricing Analysis
Benchmarks
Trends
Should-Cost
Indexation
Landed Cost
Commercial Terms
Deliverables
Brand Analysis
Positioning & Value Prop
Share & Presence
Customer Evidence
Go-to-Market
Digital & Reputation
Compliance & Trust
KPIs & Gaps
Outputs
Full Research Suite comprises of:
Market outlook & trends analysis
Interviews & case studies
Strategic recommendations
Vendor profiles & capabilities analysis
5-year forecasts
8 regions and 60+ country-level data splits
Market segment data splits
12 months of continuous data updates
DELIVERED AS:
PDF EXCEL ONLINE
Data Pipeline Observability Solutions Market Size and Share Forecast Outlook 2025 to 2035
Data Center Market Forecast and Outlook 2025 to 2035
DataOps Platform Market Size and Share Forecast Outlook 2025 to 2035
Data Acquisition Hardware Market Size and Share Forecast Outlook 2025 to 2035
Data Center Automatic Transfer Switches and Switchgears Market Size and Share Forecast Outlook 2025 to 2035
Data Discovery Market Size and Share Forecast Outlook 2025 to 2035
Data Masking Technology Market Size and Share Forecast Outlook 2025 to 2035
Data Centre Rack Server Market Size and Share Forecast Outlook 2025 to 2035
Data Center Power Management Industry Analysis in Western Europe Size and Share Forecast Outlook 2025 to 2035
Data Center Power Management Industry Analysis in Korea Size and Share Forecast Outlook 2025 to 2035
Data Center Liquid Cooling Market Size and Share Forecast Outlook 2025 to 2035
Data Business in Oil & Gas Market Size and Share Forecast Outlook 2025 to 2035
Data Centre Colocation Market Size and Share Forecast Outlook 2025 to 2035
Data Lake Market Size and Share Forecast Outlook 2025 to 2035
Data Center RFID Market Size and Share Forecast Outlook 2025 to 2035
Data Center Accelerator Market Size and Share Forecast Outlook 2025 to 2035
Data Lakehouse Market Size and Share Forecast Outlook 2025 to 2035
Data Center Outsourcing Market Size and Share Forecast Outlook 2025 to 2035
Data Center Refrigerant Market Size and Share Forecast Outlook 2025 to 2035
Data Center Fire Detection And Suppression Market Size and Share Forecast Outlook 2025 to 2035

Thank you!
You will receive an email from our Business Development Manager. Please be sure to check your SPAM/JUNK folder too.
Chat With
MaRIA