Methodology

Data Masking Technology Market Size and Share Forecast Outlook 2025 to 2035

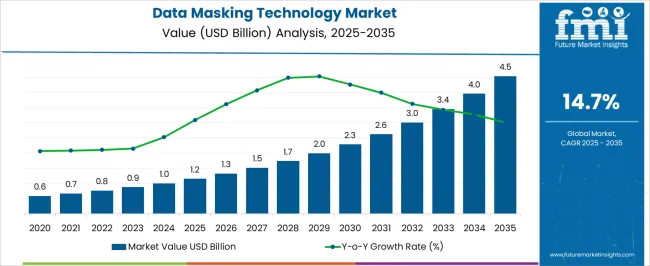
The Data Masking Technology Market is estimated to be valued at USD 1.2 billion in 2025 and is projected to reach USD 4.5 billion by 2035, registering a compound annual growth rate (CAGR) of 14.7% over the forecast period.
Quick Stats for Data Masking Technology Market

  • Data Masking Technology Market Value (2025): USD 1.2 billion
  • Data Masking Technology Market Forecast Value (2035): USD 4.5 billion
  • Data Masking Technology Market Forecast CAGR: 14.7%
  • Leading Segment in Data Masking Technology Market in 2025: BFSI (21.7%)
  • Key Growth Regions in Data Masking Technology Market: North America, Asia-Pacific, Europe
  • Top Key Players in Data Masking Technology Market: IBM Corporation, Oracle Corporation, Informatica Inc., Delphix Corp., Mentis Inc., Innovative Routines International Inc., Solix Technologies Inc., K2View Ltd., Redgate Software Ltd., Broadcom Inc. (CA Technologies), Protegrity USA, Inc., TokenEx, LLC

Data Masking Technology Market Market Value Analysis

Data Masking Technology Market Key Takeaways

Metric Value
Data Masking Technology Market Estimated Value in (2025 E) USD 1.2 billion
Data Masking Technology Market Forecast Value in (2035 F) USD 4.5 billion
Forecast CAGR (2025 to 2035) 14.7%

Why is the Data Masking Technology Market Growing?

The Data Masking Technology market is witnessing robust growth, driven by the increasing need to protect sensitive information and ensure compliance with data privacy regulations across industries. Organizations are adopting advanced masking solutions to secure personally identifiable information, financial records, and confidential enterprise data while enabling safe use for testing, development, and analytics purposes. Growing regulatory pressures, including GDPR, CCPA, and industry-specific standards, are accelerating deployment across both large enterprises and mid-sized organizations.

The integration of masking technologies with cloud, big data, and AI-driven analytics platforms is further enhancing operational efficiency and security. The market is also benefiting from rising digital transformation initiatives, which increase the volume and complexity of data requiring protection.

As enterprises prioritize governance, risk mitigation, and secure data sharing, investments in scalable and flexible data masking solutions are expected to expand Continuous innovation in masking techniques, dynamic data obfuscation, and automation capabilities is further driving adoption, positioning the market for sustained growth in the coming decade.

Segmental Analysis:

The data masking technology market is segmented by end-user vertical, deployment models, and geographic regions. By end-user vertical, data masking technology market is divided into BFSI, Retail, Telecomm, Health Care, Energy, Education, Automobile, Public Sector, and Others. In terms of deployment models, data masking technology market is classified into ETL, In-Place Masking, and Dynamic Masking. Regionally, the data masking technology industry is classified into North America, Latin America, Western Europe, Eastern Europe, Balkan & Baltic Countries, Russia & Belarus, Central Asia, East Asia, South Asia & Pacific, and the Middle East & Africa.
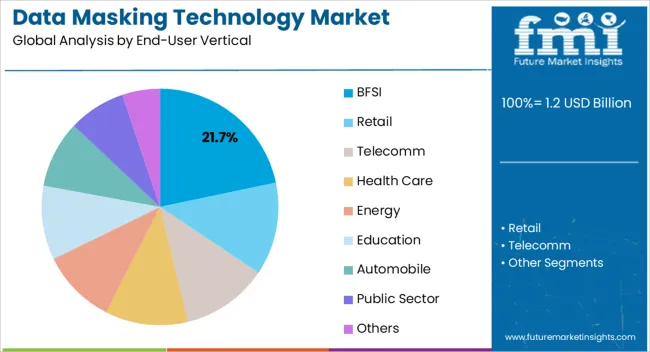
Insights into the BFSI End-User Vertical Segment

Data Masking Technology Market Analysis By End User Vertical

The BFSI end-user vertical segment is projected to hold 21.7% of the market revenue in 2025, establishing it as the leading vertical. Growth in this segment is being driven by the critical need to secure financial data, including customer account information, transaction histories, and sensitive corporate records. Data masking enables organizations in banking, insurance, and capital markets to comply with strict regulatory frameworks while supporting secure testing, analytics, and software development activities.

The adoption of advanced masking solutions allows financial institutions to maintain operational efficiency without exposing sensitive information to internal or external risks. Increasing investment in digital banking, mobile platforms, and financial technology initiatives has further accelerated demand.

With the rising importance of data privacy, risk mitigation, and compliance auditing, the BFSI vertical continues to prioritize data masking as an essential component of IT infrastructure The scalability and flexibility of modern masking solutions ensure that BFSI institutions can meet evolving security and regulatory requirements while maintaining business continuity and customer trust.
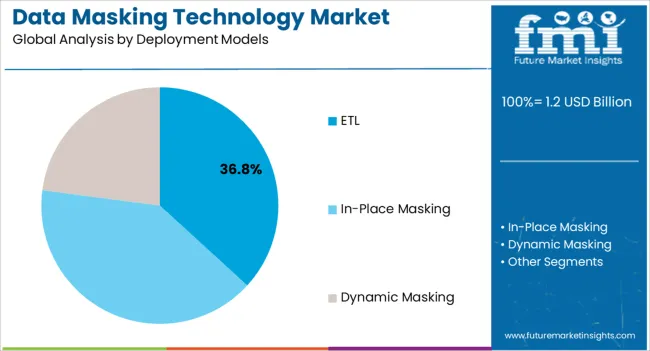
Insights into the ETL Deployment Model Segment

Data Masking Technology Market Analysis By Deployment Models

The ETL deployment model segment is anticipated to account for 36.8% of the market revenue in 2025, making it the leading deployment category. Growth is being driven by the increasing reliance on ETL processes to extract, transform, and load sensitive data across multiple systems for analytics, reporting, and enterprise applications. Data masking integrated into ETL workflows ensures that confidential information is protected during processing, enabling secure access for testing, development, and business intelligence operations.

Organizations benefit from automated masking within ETL pipelines, which reduces manual effort, accelerates processing times, and mitigates risk of exposure. The model also supports scalability and adaptability across cloud, on-premises, and hybrid environments.

As companies handle growing volumes of structured and unstructured data and face stricter data privacy regulations, ETL-based masking deployment has emerged as a preferred strategy Continuous innovation in masking algorithms, integration capabilities, and automation ensures that ETL deployments remain critical in securing sensitive information, supporting compliance, and enabling efficient data utilization across enterprises.

Market Overview

Data Masking Technology Market Overview

The data masking technology market is growing as industries ranging from BFSI to government are becoming extremely cautious to the internal hacking and data privacy concerns. Recent technologies like big data where massive databases are generated, exposing it to greater risk.

In order to address these concerns for preventing outside attacks, data masking technology is used which can be used to and analyze the data in proxy.

Data masking technology provide data security by cloning the original data into a non-sensitive proxy which look like similar data. This non-sensitive data can be used in business process for testing and analysis without the risk of breaking the business. Dynamic masking is the recent trend in database access which is growing.
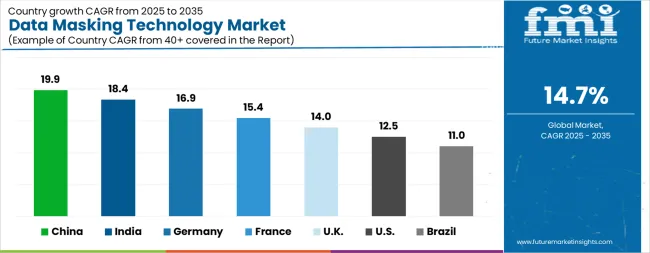
Analysis of Data Masking Technology Market By Key Countries

Data Masking Technology Market Cagr Analysis By Country

Country CAGR
China 19.9%
India 18.4%
Germany 16.9%
France 15.4%
UK 14.0%
USA 12.5%
Brazil 11.0%

Country-wise Analysis

The Data Masking Technology Market is expected to register a CAGR of 14.7% during the forecast period, exhibiting varied country level momentum. China leads with the highest CAGR of 19.9%, followed by India at 18.4%. Developed markets such as Germany, France, and the UK continue to expand steadily, while the USA is likely to grow at consistent rates. Brazil posts the lowest CAGR at 11.0%, yet still underscores a broadly positive trajectory for the global Data Masking Technology Market. In 2024, Germany held a dominant revenue in the Western Europe market and is expected to grow with a CAGR of 16.9%. The USA Data Masking Technology Market is estimated to be valued at USD 423.0 million in 2025 and is anticipated to reach a valuation of USD 1.4 billion by 2035. Sales are projected to rise at a CAGR of 12.5% over the forecast period between 2025 and 2035. While Japan and South Korea markets are estimated to be valued at USD 53.2 million and USD 40.1 million respectively in 2025.
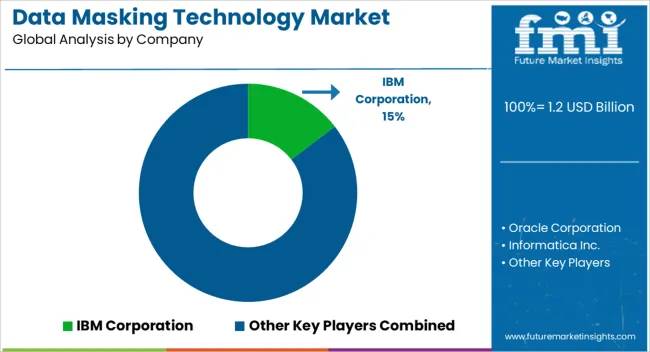
Key Players in the Data Masking Technology Market

Data Masking Technology Market Analysis By Company

  • IBM Corporation
  • Oracle Corporation
  • Informatica Inc.
  • Delphix Corp.
  • Mentis Inc.
  • Innovative Routines International Inc.
  • Solix Technologies Inc.
  • K2View Ltd.
  • Redgate Software Ltd.
  • Broadcom Inc. (CA Technologies)
  • Protegrity USA, Inc.
  • TokenEx, LLC

Scope of the Report

Item Value
Quantitative Units USD 1.2 Billion
End-User Vertical BFSI, Retail, Telecomm, Health Care, Energy, Education, Automobile, Public Sector, and Others
Deployment Models ETL, In-Place Masking, and Dynamic Masking
Regions Covered North America, Europe, Asia-Pacific, Latin America, Middle East & Africa
Country Covered United States, Canada, Germany, France, United Kingdom, China, Japan, India, Brazil, South Africa
Key Companies Profiled IBM Corporation, Oracle Corporation, Informatica Inc., Delphix Corp., Mentis Inc., Innovative Routines International Inc., Solix Technologies Inc., K2View Ltd., Redgate Software Ltd., Broadcom Inc. (CA Technologies), Protegrity USA, Inc., and TokenEx, LLC

Data Masking Technology Market by Segments

End-User Vertical:

  • BFSI
  • Retail
  • Telecomm
  • Health Care
  • Energy
  • Education
  • Automobile
  • Public Sector
  • Others

Deployment Models:

  • ETL
  • In-Place Masking
  • Dynamic Masking

Region:

  • North America
    • USA
    • Canada
    • Mexico
  • Latin America
    • Brazil
    • Chile
    • Rest of Latin America
  • Western Europe
    • Germany
    • UK
    • Italy
    • Spain
    • France
    • Nordic
    • BENELUX
    • Rest of Western Europe
  • Eastern Europe
    • Russia
    • Poland
    • Hungary
    • Balkan & Baltic
    • Rest of Eastern Europe
  • East Asia
    • China
    • Japan
    • South Korea
  • South Asia and Pacific
    • India
    • ASEAN
    • Australia & New Zealand
    • Rest of South Asia and Pacific
  • Middle East & Africa
    • Kingdom of Saudi Arabia
    • Other GCC Countries
    • Turkiye
    • South Africa
    • Other African Union
    • Rest of Middle East & Africa

Frequently Asked Questions

How big is the data masking technology market in 2025?

The global data masking technology market is estimated to be valued at USD 1.2 billion in 2025.

What will be the size of data masking technology market in 2035?

The market size for the data masking technology market is projected to reach USD 4.5 billion by 2035.

How much will be the data masking technology market growth between 2025 and 2035?

The data masking technology market is expected to grow at a 14.7% CAGR between 2025 and 2035.

What are the key product types in the data masking technology market?

The key product types in data masking technology market are bfsi, retail, telecomm, health care, energy, education, automobile, public sector and others.

Which deployment models segment to contribute significant share in the data masking technology market in 2025?

In terms of deployment models, etl segment to command 36.8% share in the data masking technology market in 2025.

Table of Content

  1. Executive Summary
    • Global Market Outlook
    • Demand-side Trends
    • Supply-side Trends
    • Technology Roadmap Analysis
    • Analysis and Recommendations
  2. Market Overview
    • Market Coverage / Taxonomy
    • Market Definition / Scope / Limitations
  3. Market Background
    • Market Dynamics
      • Drivers
      • Restraints
      • Opportunity
      • Trends
    • Scenario Forecast
      • Demand in Optimistic Scenario
      • Demand in Likely Scenario
      • Demand in Conservative Scenario
    • Opportunity Map Analysis
    • Product Life Cycle Analysis
    • Supply Chain Analysis
    • Investment Feasibility Matrix
    • Value Chain Analysis
    • PESTLE and Porter’s Analysis
    • Regulatory Landscape
    • Regional Parent Market Outlook
    • Production and Consumption Statistics
    • Import and Export Statistics
  4. Global Market Analysis 2020 to 2024 and Forecast, 2025 to 2035
    • Historical Market Size Value (USD Million) Analysis, 2020 to 2024
    • Current and Future Market Size Value (USD Million) Projections, 2025 to 2035
      • Y-o-Y Growth Trend Analysis
      • Absolute $ Opportunity Analysis
  5. Global Market Pricing Analysis 2020 to 2024 and Forecast 2025 to 2035
  6. Global Market Analysis 2020 to 2024 and Forecast 2025 to 2035, By End-User Vertical
    • Introduction / Key Findings
    • Historical Market Size Value (USD Million) Analysis By End-User Vertical , 2020 to 2024
    • Current and Future Market Size Value (USD Million) Analysis and Forecast By End-User Vertical , 2025 to 2035
      • BFSI
      • Retail
      • Telecomm
      • Health Care
      • Energy
      • Education
      • Automobile
      • Public Sector
      • Others
    • Y-o-Y Growth Trend Analysis By End-User Vertical , 2020 to 2024
    • Absolute $ Opportunity Analysis By End-User Vertical , 2025 to 2035
  7. Global Market Analysis 2020 to 2024 and Forecast 2025 to 2035, By Deployment Models
    • Introduction / Key Findings
    • Historical Market Size Value (USD Million) Analysis By Deployment Models, 2020 to 2024
    • Current and Future Market Size Value (USD Million) Analysis and Forecast By Deployment Models, 2025 to 2035
      • ETL
      • In-Place Masking
      • Dynamic Masking
    • Y-o-Y Growth Trend Analysis By Deployment Models, 2020 to 2024
    • Absolute $ Opportunity Analysis By Deployment Models, 2025 to 2035
  8. Global Market Analysis 2020 to 2024 and Forecast 2025 to 2035, By Region
    • Introduction
    • Historical Market Size Value (USD Million) Analysis By Region, 2020 to 2024
    • Current Market Size Value (USD Million) Analysis and Forecast By Region, 2025 to 2035
      • North America
      • Latin America
      • Western Europe
      • Eastern Europe
      • East Asia
      • South Asia and Pacific
      • Middle East & Africa
    • Market Attractiveness Analysis By Region
  9. North America Market Analysis 2020 to 2024 and Forecast 2025 to 2035, By Country
    • Historical Market Size Value (USD Million) Trend Analysis By Market Taxonomy, 2020 to 2024
    • Market Size Value (USD Million) Forecast By Market Taxonomy, 2025 to 2035
      • By Country
        • USA
        • Canada
        • Mexico
      • By End-User Vertical
      • By Deployment Models
    • Market Attractiveness Analysis
      • By Country
      • By End-User Vertical
      • By Deployment Models
    • Key Takeaways
  10. Latin America Market Analysis 2020 to 2024 and Forecast 2025 to 2035, By Country
    • Historical Market Size Value (USD Million) Trend Analysis By Market Taxonomy, 2020 to 2024
    • Market Size Value (USD Million) Forecast By Market Taxonomy, 2025 to 2035
      • By Country
        • Brazil
        • Chile
        • Rest of Latin America
      • By End-User Vertical
      • By Deployment Models
    • Market Attractiveness Analysis
      • By Country
      • By End-User Vertical
      • By Deployment Models
    • Key Takeaways
  11. Western Europe Market Analysis 2020 to 2024 and Forecast 2025 to 2035, By Country
    • Historical Market Size Value (USD Million) Trend Analysis By Market Taxonomy, 2020 to 2024
    • Market Size Value (USD Million) Forecast By Market Taxonomy, 2025 to 2035
      • By Country
        • Germany
        • UK
        • Italy
        • Spain
        • France
        • Nordic
        • BENELUX
        • Rest of Western Europe
      • By End-User Vertical
      • By Deployment Models
    • Market Attractiveness Analysis
      • By Country
      • By End-User Vertical
      • By Deployment Models
    • Key Takeaways
  12. Eastern Europe Market Analysis 2020 to 2024 and Forecast 2025 to 2035, By Country
    • Historical Market Size Value (USD Million) Trend Analysis By Market Taxonomy, 2020 to 2024
    • Market Size Value (USD Million) Forecast By Market Taxonomy, 2025 to 2035
      • By Country
        • Russia
        • Poland
        • Hungary
        • Balkan & Baltic
        • Rest of Eastern Europe
      • By End-User Vertical
      • By Deployment Models
    • Market Attractiveness Analysis
      • By Country
      • By End-User Vertical
      • By Deployment Models
    • Key Takeaways
  13. East Asia Market Analysis 2020 to 2024 and Forecast 2025 to 2035, By Country
    • Historical Market Size Value (USD Million) Trend Analysis By Market Taxonomy, 2020 to 2024
    • Market Size Value (USD Million) Forecast By Market Taxonomy, 2025 to 2035
      • By Country
        • China
        • Japan
        • South Korea
      • By End-User Vertical
      • By Deployment Models
    • Market Attractiveness Analysis
      • By Country
      • By End-User Vertical
      • By Deployment Models
    • Key Takeaways
  14. South Asia and Pacific Market Analysis 2020 to 2024 and Forecast 2025 to 2035, By Country
    • Historical Market Size Value (USD Million) Trend Analysis By Market Taxonomy, 2020 to 2024
    • Market Size Value (USD Million) Forecast By Market Taxonomy, 2025 to 2035
      • By Country
        • India
        • ASEAN
        • Australia & New Zealand
        • Rest of South Asia and Pacific
      • By End-User Vertical
      • By Deployment Models
    • Market Attractiveness Analysis
      • By Country
      • By End-User Vertical
      • By Deployment Models
    • Key Takeaways
  15. Middle East & Africa Market Analysis 2020 to 2024 and Forecast 2025 to 2035, By Country
    • Historical Market Size Value (USD Million) Trend Analysis By Market Taxonomy, 2020 to 2024
    • Market Size Value (USD Million) Forecast By Market Taxonomy, 2025 to 2035
      • By Country
        • Kingdom of Saudi Arabia
        • Other GCC Countries
        • Turkiye
        • South Africa
        • Other African Union
        • Rest of Middle East & Africa
      • By End-User Vertical
      • By Deployment Models
    • Market Attractiveness Analysis
      • By Country
      • By End-User Vertical
      • By Deployment Models
    • Key Takeaways
  16. Key Countries Market Analysis
    • USA
      • Pricing Analysis
      • Market Share Analysis, 2024
        • By End-User Vertical
        • By Deployment Models
    • Canada
      • Pricing Analysis
      • Market Share Analysis, 2024
        • By End-User Vertical
        • By Deployment Models
    • Mexico
      • Pricing Analysis
      • Market Share Analysis, 2024
        • By End-User Vertical
        • By Deployment Models
    • Brazil
      • Pricing Analysis
      • Market Share Analysis, 2024
        • By End-User Vertical
        • By Deployment Models
    • Chile
      • Pricing Analysis
      • Market Share Analysis, 2024
        • By End-User Vertical
        • By Deployment Models
    • Germany
      • Pricing Analysis
      • Market Share Analysis, 2024
        • By End-User Vertical
        • By Deployment Models
    • UK
      • Pricing Analysis
      • Market Share Analysis, 2024
        • By End-User Vertical
        • By Deployment Models
    • Italy
      • Pricing Analysis
      • Market Share Analysis, 2024
        • By End-User Vertical
        • By Deployment Models
    • Spain
      • Pricing Analysis
      • Market Share Analysis, 2024
        • By End-User Vertical
        • By Deployment Models
    • France
      • Pricing Analysis
      • Market Share Analysis, 2024
        • By End-User Vertical
        • By Deployment Models
    • India
      • Pricing Analysis
      • Market Share Analysis, 2024
        • By End-User Vertical
        • By Deployment Models
    • ASEAN
      • Pricing Analysis
      • Market Share Analysis, 2024
        • By End-User Vertical
        • By Deployment Models
    • Australia & New Zealand
      • Pricing Analysis
      • Market Share Analysis, 2024
        • By End-User Vertical
        • By Deployment Models
    • China
      • Pricing Analysis
      • Market Share Analysis, 2024
        • By End-User Vertical
        • By Deployment Models
    • Japan
      • Pricing Analysis
      • Market Share Analysis, 2024
        • By End-User Vertical
        • By Deployment Models
    • South Korea
      • Pricing Analysis
      • Market Share Analysis, 2024
        • By End-User Vertical
        • By Deployment Models
    • Russia
      • Pricing Analysis
      • Market Share Analysis, 2024
        • By End-User Vertical
        • By Deployment Models
    • Poland
      • Pricing Analysis
      • Market Share Analysis, 2024
        • By End-User Vertical
        • By Deployment Models
    • Hungary
      • Pricing Analysis
      • Market Share Analysis, 2024
        • By End-User Vertical
        • By Deployment Models
    • Kingdom of Saudi Arabia
      • Pricing Analysis
      • Market Share Analysis, 2024
        • By End-User Vertical
        • By Deployment Models
    • Turkiye
      • Pricing Analysis
      • Market Share Analysis, 2024
        • By End-User Vertical
        • By Deployment Models
    • South Africa
      • Pricing Analysis
      • Market Share Analysis, 2024
        • By End-User Vertical
        • By Deployment Models
  17. Market Structure Analysis
    • Competition Dashboard
    • Competition Benchmarking
    • Market Share Analysis of Top Players
      • By Regional
      • By End-User Vertical
      • By Deployment Models
  18. Competition Analysis
    • Competition Deep Dive
      • IBM Corporation
        • Overview
        • Product Portfolio
        • Profitability by Market Segments (Product/Age /Sales Channel/Region)
        • Sales Footprint
        • Strategy Overview
          • Marketing Strategy
          • Product Strategy
          • Channel Strategy
      • Oracle Corporation
      • Informatica Inc.
      • Delphix Corp.
      • Mentis Inc.
      • Innovative Routines International Inc.
      • Solix Technologies Inc.
      • K2View Ltd.
      • Redgate Software Ltd.
      • Broadcom Inc. (CA Technologies)
      • Protegrity USA, Inc.
      • TokenEx, LLC
  19. Assumptions & Acronyms Used
  20. Research Methodology

List of Tables

  • Table 1: Global Market Value (USD Million) Forecast by Region, 2020 to 2035
  • Table 2: Global Market Value (USD Million) Forecast by End-User Vertical , 2020 to 2035
  • Table 3: Global Market Value (USD Million) Forecast by Deployment Models, 2020 to 2035
  • Table 4: North America Market Value (USD Million) Forecast by Country, 2020 to 2035
  • Table 5: North America Market Value (USD Million) Forecast by End-User Vertical , 2020 to 2035
  • Table 6: North America Market Value (USD Million) Forecast by Deployment Models, 2020 to 2035
  • Table 7: Latin America Market Value (USD Million) Forecast by Country, 2020 to 2035
  • Table 8: Latin America Market Value (USD Million) Forecast by End-User Vertical , 2020 to 2035
  • Table 9: Latin America Market Value (USD Million) Forecast by Deployment Models, 2020 to 2035
  • Table 10: Western Europe Market Value (USD Million) Forecast by Country, 2020 to 2035
  • Table 11: Western Europe Market Value (USD Million) Forecast by End-User Vertical , 2020 to 2035
  • Table 12: Western Europe Market Value (USD Million) Forecast by Deployment Models, 2020 to 2035
  • Table 13: Eastern Europe Market Value (USD Million) Forecast by Country, 2020 to 2035
  • Table 14: Eastern Europe Market Value (USD Million) Forecast by End-User Vertical , 2020 to 2035
  • Table 15: Eastern Europe Market Value (USD Million) Forecast by Deployment Models, 2020 to 2035
  • Table 16: East Asia Market Value (USD Million) Forecast by Country, 2020 to 2035
  • Table 17: East Asia Market Value (USD Million) Forecast by End-User Vertical , 2020 to 2035
  • Table 18: East Asia Market Value (USD Million) Forecast by Deployment Models, 2020 to 2035
  • Table 19: South Asia and Pacific Market Value (USD Million) Forecast by Country, 2020 to 2035
  • Table 20: South Asia and Pacific Market Value (USD Million) Forecast by End-User Vertical , 2020 to 2035
  • Table 21: South Asia and Pacific Market Value (USD Million) Forecast by Deployment Models, 2020 to 2035
  • Table 22: Middle East & Africa Market Value (USD Million) Forecast by Country, 2020 to 2035
  • Table 23: Middle East & Africa Market Value (USD Million) Forecast by End-User Vertical , 2020 to 2035
  • Table 24: Middle East & Africa Market Value (USD Million) Forecast by Deployment Models, 2020 to 2035

List of Figures

  • Figure 1: Global Market Pricing Analysis
  • Figure 2: Global Market Value (USD Million) Forecast 2020 to 2035
  • Figure 3: Global Market Value Share and BPS Analysis by End-User Vertical , 2025 and 2035
  • Figure 4: Global Market Y-o-Y Growth Comparison by End-User Vertical , 2025 to 2035
  • Figure 5: Global Market Attractiveness Analysis by End-User Vertical
  • Figure 6: Global Market Value Share and BPS Analysis by Deployment Models, 2025 and 2035
  • Figure 7: Global Market Y-o-Y Growth Comparison by Deployment Models, 2025 to 2035
  • Figure 8: Global Market Attractiveness Analysis by Deployment Models
  • Figure 9: Global Market Value (USD Million) Share and BPS Analysis by Region, 2025 and 2035
  • Figure 10: Global Market Y-o-Y Growth Comparison by Region, 2025 to 2035
  • Figure 11: Global Market Attractiveness Analysis by Region
  • Figure 12: North America Market Incremental Dollar Opportunity, 2025 to 2035
  • Figure 13: Latin America Market Incremental Dollar Opportunity, 2025 to 2035
  • Figure 14: Western Europe Market Incremental Dollar Opportunity, 2025 to 2035
  • Figure 15: Eastern Europe Market Incremental Dollar Opportunity, 2025 to 2035
  • Figure 16: East Asia Market Incremental Dollar Opportunity, 2025 to 2035
  • Figure 17: South Asia and Pacific Market Incremental Dollar Opportunity, 2025 to 2035
  • Figure 18: Middle East & Africa Market Incremental Dollar Opportunity, 2025 to 2035
  • Figure 19: North America Market Value Share and BPS Analysis by Country, 2025 and 2035
  • Figure 20: North America Market Value Share and BPS Analysis by End-User Vertical , 2025 and 2035
  • Figure 21: North America Market Y-o-Y Growth Comparison by End-User Vertical , 2025 to 2035
  • Figure 22: North America Market Attractiveness Analysis by End-User Vertical
  • Figure 23: North America Market Value Share and BPS Analysis by Deployment Models, 2025 and 2035
  • Figure 24: North America Market Y-o-Y Growth Comparison by Deployment Models, 2025 to 2035
  • Figure 25: North America Market Attractiveness Analysis by Deployment Models
  • Figure 26: Latin America Market Value Share and BPS Analysis by Country, 2025 and 2035
  • Figure 27: Latin America Market Value Share and BPS Analysis by End-User Vertical , 2025 and 2035
  • Figure 28: Latin America Market Y-o-Y Growth Comparison by End-User Vertical , 2025 to 2035
  • Figure 29: Latin America Market Attractiveness Analysis by End-User Vertical
  • Figure 30: Latin America Market Value Share and BPS Analysis by Deployment Models, 2025 and 2035
  • Figure 31: Latin America Market Y-o-Y Growth Comparison by Deployment Models, 2025 to 2035
  • Figure 32: Latin America Market Attractiveness Analysis by Deployment Models
  • Figure 33: Western Europe Market Value Share and BPS Analysis by Country, 2025 and 2035
  • Figure 34: Western Europe Market Value Share and BPS Analysis by End-User Vertical , 2025 and 2035
  • Figure 35: Western Europe Market Y-o-Y Growth Comparison by End-User Vertical , 2025 to 2035
  • Figure 36: Western Europe Market Attractiveness Analysis by End-User Vertical
  • Figure 37: Western Europe Market Value Share and BPS Analysis by Deployment Models, 2025 and 2035
  • Figure 38: Western Europe Market Y-o-Y Growth Comparison by Deployment Models, 2025 to 2035
  • Figure 39: Western Europe Market Attractiveness Analysis by Deployment Models
  • Figure 40: Eastern Europe Market Value Share and BPS Analysis by Country, 2025 and 2035
  • Figure 41: Eastern Europe Market Value Share and BPS Analysis by End-User Vertical , 2025 and 2035
  • Figure 42: Eastern Europe Market Y-o-Y Growth Comparison by End-User Vertical , 2025 to 2035
  • Figure 43: Eastern Europe Market Attractiveness Analysis by End-User Vertical
  • Figure 44: Eastern Europe Market Value Share and BPS Analysis by Deployment Models, 2025 and 2035
  • Figure 45: Eastern Europe Market Y-o-Y Growth Comparison by Deployment Models, 2025 to 2035
  • Figure 46: Eastern Europe Market Attractiveness Analysis by Deployment Models
  • Figure 47: East Asia Market Value Share and BPS Analysis by Country, 2025 and 2035
  • Figure 48: East Asia Market Value Share and BPS Analysis by End-User Vertical , 2025 and 2035
  • Figure 49: East Asia Market Y-o-Y Growth Comparison by End-User Vertical , 2025 to 2035
  • Figure 50: East Asia Market Attractiveness Analysis by End-User Vertical
  • Figure 51: East Asia Market Value Share and BPS Analysis by Deployment Models, 2025 and 2035
  • Figure 52: East Asia Market Y-o-Y Growth Comparison by Deployment Models, 2025 to 2035
  • Figure 53: East Asia Market Attractiveness Analysis by Deployment Models
  • Figure 54: South Asia and Pacific Market Value Share and BPS Analysis by Country, 2025 and 2035
  • Figure 55: South Asia and Pacific Market Value Share and BPS Analysis by End-User Vertical , 2025 and 2035
  • Figure 56: South Asia and Pacific Market Y-o-Y Growth Comparison by End-User Vertical , 2025 to 2035
  • Figure 57: South Asia and Pacific Market Attractiveness Analysis by End-User Vertical
  • Figure 58: South Asia and Pacific Market Value Share and BPS Analysis by Deployment Models, 2025 and 2035
  • Figure 59: South Asia and Pacific Market Y-o-Y Growth Comparison by Deployment Models, 2025 to 2035
  • Figure 60: South Asia and Pacific Market Attractiveness Analysis by Deployment Models
  • Figure 61: Middle East & Africa Market Value Share and BPS Analysis by Country, 2025 and 2035
  • Figure 62: Middle East & Africa Market Value Share and BPS Analysis by End-User Vertical , 2025 and 2035
  • Figure 63: Middle East & Africa Market Y-o-Y Growth Comparison by End-User Vertical , 2025 to 2035
  • Figure 64: Middle East & Africa Market Attractiveness Analysis by End-User Vertical
  • Figure 65: Middle East & Africa Market Value Share and BPS Analysis by Deployment Models, 2025 and 2035
  • Figure 66: Middle East & Africa Market Y-o-Y Growth Comparison by Deployment Models, 2025 to 2035
  • Figure 67: Middle East & Africa Market Attractiveness Analysis by Deployment Models
  • Figure 68: Global Market – Tier Structure Analysis
  • Figure 69: Global Market – Company Share Analysis
Dashboard
Dashboard
Dashboard
Dashboard
Dashboard
Dashboard

Our Research Products

Full Research Suite

The "Full Research Suite" delivers actionable market intel, deep dives on markets or technologies, so clients act faster, cut risk, and unlock growth.

Competitor Leaderboard Report

The Leaderboard benchmarks and ranks top vendors, classifying them as Established Leaders, Leading Challengers, or Disruptors & Challengers.

Future Leaders Index

Locates where complements amplify value and substitutes erode it, forecasting net impact by horizon

Market Data & Forecasts

We deliver granular, decision-grade intel: market sizing, 5-year forecasts, pricing, adoption, usage, revenue, and operational KPIs—plus competitor tracking, regulation, and value chains—across 60 countries broadly.

Market Focus Report

Spot the shifts before they hit your P&L. We track inflection points, adoption curves, pricing moves, and ecosystem plays to show where demand is heading, why it is changing, and what to do next across high-growth markets and disruptive tech

Survey Report

Real-time reads of user behavior. We track shifting priorities, perceptions of today’s and next-gen services, and provider experience, then pace how fast tech moves from trial to adoption, blending buyer, consumer, and channel inputs with social signals (#WhySwitch, #UX).

Bespoke Reports

Partner with our analyst team to build a custom report designed around your business priorities. From analysing market trends to assessing competitors or crafting bespoke datasets, we tailor insights to your needs.

Supplier Intelligence

Discovery & Profiling

Capacity & Footprint

Performance & Risk

Compliance & Governance

Commercial Readiness

Who Supplies Whom

Scorecards & Shortlists

Playbooks & Docs

Category Intelligence

Definition & Scope

Demand & Use Cases

Cost Drivers

Market Structure

Supply Chain Map

Trade & Policy

Operating Norms

Deliverables

Buyer Intelligence

Account Basics

Spend & Scope

Procurement Model

Vendor Requirements

Terms & Policies

Entry Strategy

Pain Points & Triggers

Outputs

Pricing Analysis

Benchmarks

Trends

Should-Cost

Indexation

Landed Cost

Commercial Terms

Deliverables

Brand Analysis

Positioning & Value Prop

Share & Presence

Customer Evidence

Go-to-Market

Digital & Reputation

Compliance & Trust

KPIs & Gaps

Outputs

Full Research Suite comprises of:

Market outlook & trends analysis

Market outlook & trends analysis

Interviews & case studies

Interviews & case studies

Strategic recommendations

Strategic recommendations

Vendor profiles & capabilities analysis

Vendor profiles & capabilities analysis

5-year forecasts

5-year forecasts

8 regions and 60+ country-level data splits

8 regions and 60+ country-level data splits

Market segment data splits

Market segment data splits

12 months of continuous data updates

12 months of continuous data updates

DELIVERED AS:

PDF EXCEL ONLINE

Full Research Suite


$5000

$7500

$10000

Buy Report Now
Similar Industry Reports

Similar Industry Reports

Data Security Posture Management (DSPM) Solutions Market

Data Security Posture Management (DSPM) Solutions Market Size and Share Forecast Outlook 2025 to 2035

Data Loss Prevention (DLP) Services Market

Data Loss Prevention (DLP) Services Market Size and Share Forecast Outlook 2025 to 2035

Data Pipeline Observability Solutions Market

Data Pipeline Observability Solutions Market Size and Share Forecast Outlook 2025 to 2035

Data Center Market
Data Center Market

Data Center Market Forecast and Outlook 2025 to 2035

DataOps Platform Market

DataOps Platform Market Size and Share Forecast Outlook 2025 to 2035

Masking Tape Market
Masking Tape Market

Masking Tape Market Size and Share Forecast Outlook 2025 to 2035

Datacenter Infrastructure Services Market

Datacenter Infrastructure Services Market Size and Share Forecast Outlook 2025 to 2035

Data Acquisition Hardware Market

Data Acquisition Hardware Market Size and Share Forecast Outlook 2025 to 2035

Data Center Automatic Transfer Switches and Switchgears Market

Data Center Automatic Transfer Switches and Switchgears Market Size and Share Forecast Outlook 2025 to 2035

Data Discovery Market

Data Discovery Market Size and Share Forecast Outlook 2025 to 2035

Data Centre Rack Server Market

Data Centre Rack Server Market Size and Share Forecast Outlook 2025 to 2035

Data Center Power Management Industry Analysis in Western Europe

Data Center Power Management Industry Analysis in Western Europe Size and Share Forecast Outlook 2025 to 2035

Data Center Power Management Industry Analysis in Korea

Data Center Power Management Industry Analysis in Korea Size and Share Forecast Outlook 2025 to 2035

Data Center Liquid Cooling Market

Data Center Liquid Cooling Market Size and Share Forecast Outlook 2025 to 2035

Data Business in Oil & Gas Market

Data Business in Oil & Gas Market Size and Share Forecast Outlook 2025 to 2035

Data Centre Colocation Market

Data Centre Colocation Market Size and Share Forecast Outlook 2025 to 2035

Data Lake Market
Data Lake Market

Data Lake Market Size and Share Forecast Outlook 2025 to 2035

Data Center RFID Market

Data Center RFID Market Size and Share Forecast Outlook 2025 to 2035

Data Center Accelerator Market

Data Center Accelerator Market Size and Share Forecast Outlook 2025 to 2035

Data Lakehouse Market

Data Lakehouse Market Size and Share Forecast Outlook 2025 to 2035

Future Market Insights

Data Masking Technology Market

Chat With MaRIA

Chat With

MaRIA

Hi There, I am MaRIA, Your Market Research Intelligence Assistant. How may I help you?