Reports

- Global Locations -

Headquarters

Future Market Insights, Inc.

Christiana Corporate, 200
Continental Drive, Suite 401,
Newark, Delaware - 19713,
United States

T: +1-845-579-5705

Americas

Future Market Insights, Inc.

616 Corporate Way, Suite 2-9018,
Valley Cottage, NY 10989, United States

T: +1-347-918-3531

MEA

Future Market Insights

1602-6 Jumeirah Bay X2 Tower, Plot No: JLT-PH2-X2A,
Jumeirah Lakes Towers, Dubai,
United Arab Emirates

Europe

Future Market Insights

3rd Floor, 207 Regent Street,
W1B 3HH London
United Kingdom

T: + 44 (0) 20 8123 9659
D: +44 (0) 20 3287 4268

Asia Pacific

Future Market Insights

Office No. 401-A, 4th Floor,
VANTAGE 9, S.No. 36/1/1,
Baner, Pune 411045, India

Masking Tapes Market Outlook (2022 to 2032)

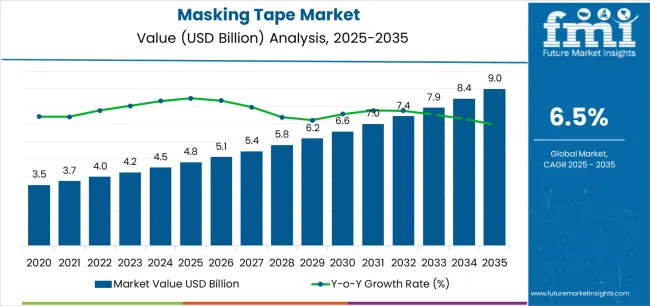
The global masking tapes market has been estimated to be worth US$ 4758.83 million in 2022, with a CAGR of 5.20% during the forecast period. The global masking tapes market is anticipated to exceed US$7900.55 million by the end of 2032.

The exponentially growing building and construction industry are generating huge masking tape market growth. Even though they predominantly seemed to mask areas while painting, these tapes are gaining increased use in label resources.

According to Future Market Insights (FMI), masking tape versatility compels masking tapes market growth. The increasing use of environmentally friendly masking tapes is anticipated to propel the global masking tapes market. A significant number of masking tape manufacturers are introducing environmentally friendly masking tape solutions. These tapes are known as eco-tapes, and their popularity is based on their environmental responsibility.

Aside from the construction industry, masking tape sales are anticipated to boost because of an increased demand from the automotive industry. This trend is predicted to persist throughout the forecast period. The COVID-19 pandemic has had an effect on the global masking tapes market.

Several governments around the world had already levied comprehensive national lockdowns to confine the transmission of the virus, resulting in the closure of businesses and a stymie across several financial growths.

Amidst a drastic drop in 2020, the masking tapes market to start to bounce back in 2021 since economies resume operations following a prolonged period of lockdown.

Attributes Details
Masking Tapes Market CAGR (2022 to 2032) 5.2%
Masking Tapes Market Size (2022) US$ 4758.83 million
Masking Tapes Market Size (2032) US$7900.55 million

Don't pay for what you don't need

Customize your report by selecting specific countries or regions and save 30%!

How Do Businesses Hope To Benefit From Sustainability?

To keep up with the constantly evolving world, an overwhelming amount of masking tape manufacturers are offering environmentally friendly practices. The popularity of this variant, often referred to as eco-tapes, is based on its environmental protection. Paper self-adhesive and gummed tapes are thus considered excellent alternative approaches to vinyl and polypropylene tapes.

These tapes are frequently regarded as sustainable solutions since they do not sacrifice quality or strength while seamlessly peeling off surfaces to which they adhere. Masking tapes are recyclable since they are made from more renewable materials.

Masking tape market companies have indeed jumped on the reinforced bandwagon. Monta, based in Germany, is the group's newest member and introduced a new line of self-adhesive paper tape in February 2020.

Elements Curtailing Masking Tapes Market Growth

Stringent rules enacted by different governing bodies are the main determinants impeding the global masking tapes market's economic expansion. For example, chemical legislation in Europe and around the world is complex and expanding, led by the Registration, Evaluation, Authorization, and Restriction of Chemicals (REACH).

The European Union's bans and restrictions on various adhesives, such as acrylic-based and rubber-based adhesives, pose significant obstacles to masking tape-related businesses.

Ismail Sutaria
Ismail Sutaria

Principal Consultant

Talk to Analyst

Find your sweet spots for generating winning opportunities in this market.

How Does Capital Investment In A&D And Automotive Promote Performance?

Capital investment in the automotive and aerospace and defence (A&D) industries has created attractive growth opportunities for masking tape manufacturers. Even as the automotive industry struggled to cope with the COVID-19 impact, electric cars remained a bright spot, allowing the industry to sail through challenges. As a result, despite declining demand for masking tapes, masking tapes market growth in 2020 is expected to be moderate.

The increased emphasis on lightweight and electric vehicles has fueled the demand for advanced adhesives solutions. Masking tapes are becoming increasingly popular in the aerospace industry due to their high flame resistance, adhesion, and dialectic strength.

In 2018, the aerospace and defence industry grew by 6.7% year on year, with combined sales revenue totalling US$ 909 billion. As the A&D industry grows, so do the opportunities for masking tape applications.

Comparative View Of Adjacent Masking Tapes Market

Masking Tapes Market:

Attributes Masking Tapes Market
CAGR (2022 to 2032) 5.2%
Market Value (2027) US$ 6131.67 Million
Growth Factor The emergence of the building and construction sector is a major contributor to the global masking tapes market.
Opportunity The building and construction sector's double-digit growth following the economic downturn has benefitted immensely the masking tapes market significantly.
Key Trends Masking tape demand is growing as the automotive industry broadens.

Painting Masking Tapes Market:

Attributes Painting Masking Tapes Market
CAGR (2022 to 2032) 5.7%
Market Value (2027) US$ 4.35 Billion
Growth Factor The market is expected to grow rapidly due to the rise of attractive end-use sectors.
Opportunity The expansion of automotive manufacturing and metal production may increase demand for painting masking tapes at the same time.
Key Trends The expansion of automotive manufacturing and metal production may increase demand for painting masking tapes at the same time.

Adhesives Tapes Market:

Attributes Adhesives Tapes Market
CAGR (2022 to 2032) 6.7%
Market Value (2027) US$ 111.6 Billion
Growth Factor In light of the increased awareness among competitors about the benefits of adhesive tapes, the market is expected to grow at a steady pace.
Opportunity There is a new demand for lightweight vehicles, which is sparking the growth of the adhesive market.
Key Trends The miniaturization of electronic devices, particularly cell phones, portable personal computers, and tablets, is a major factor driving the global adhesive tapes market.

Get the data you need at a Fraction of the cost

Personalize your report by choosing insights you need
and save 40%!

Perspective For Segmentation

Why is Paper a Better Backing Material?

Masking tapes are more commonly made from paper. According to FMI, paper is predicted to account for more than 67% of the global market through 2030, maintaining its monopoly status. The environment's concerns have fueled the demand for long-term solutions.

As governments around the world implement policies and penalties to encourage recycling, a growing percentage of masking tape companies are likely to introduce new products, which include paper masking tapes.

With a rising number of businesses embracing the trend of providing sustainable solutions in order to keep up with changing consumer demands, demand in the paper segment is expected to skyrocket in the coming years for the masking tapes market.

Why is Single-Sided Tape Preferential?

Single-sided tapes are in higher demand than double-sided masking tapes due to their versatile applications. According to FMI, the former continues to dominate. The single-sided tape segment, which accounts for the lion's share of the masking tapes market, is expected to grow at a slightly less than 5% CAGR over the course of the report's assessment period.

Rising demand for masking tapes from the automotive, construction, electrical, and other industries is anticipated to allow the segment to grow steadily. Against this facade, a dramatic decline in sales is to be observed in 2020 as end users struggle to navigate the challenges posed by COVID-19's prolonged lockdown. Recovery is expected, particularly as the automotive, construction, and manufacturing industries resume operations following the lockdown.

Why is Rubber in High Demand as an Adhesive?

Rubber-based adhesives are in high demand, and FMI expects them to account for the lion's share of the masking tapes market over the coming years. Due to their low cost, masking tape manufacturers all over the world are increasingly turning to natural or synthetic rubber. The most effective organic rubber employed in the manufacturing of masking tapes is pale latex crepe.

Painting Is The Predominant Application Of Masking Tape

Masking tapes are also known as painter's tapes due to their ability to provide perfectly sharp edges. These tapes are simple to apply and remove without leaving any residue, even on the most delicate surfaces. Painting, according to FMI, has the largest masking tapes market share in terms of application.

Growth in the construction sector to help the segment expand. According to FMI, painting is anticipated to account for more than 59% of the global masking tapes market during the forecast period. In addition, the expanding automotive and construction sectors drive demand for masking tapes used in printing applications.

Construction Industry Promotes Economic growth

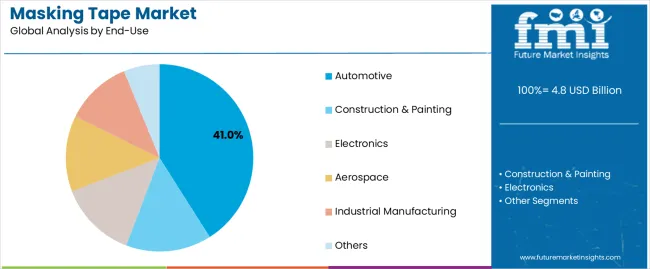
Rising demand from the construction and automotive industries may continue to drive the masking tapes market. Aside from that, demand from the aerospace and general industries is expected to rise. According to FMI, building, and construction are anticipated to continue to be the leading end-user throughout the forecast period.

Despite marginal masking tapes market growth around the world, a revival is likely as the construction scenario improves in countries such as China, the United Kingdom, and Germany.

Regional Outlook

Great Potential in the USA

Masking tape manufacturers in the United States of America are capitalizing on lucrative opportunities in the construction and automotive sectors. Construction spending in the United States of America was $1,459.4 billion in November 2020. With both private and public construction spending in the United States of America improving steadily, the outlook for masking tape sales is striving to improve.

Masking tapes are in high demand in the construction industry because of their exceptional bond strength and heat resistance. They are used for a variety of purposes, the most common of which is to protect surfaces while construction is taking place.

The adoption of masking tapes in the automotive industry must go further than heat resistance. Masking tapes are frequently used because they retain better than other materials and exhibit resistance to critical temperatures.

With sales of masking tapes expected to exceed historical volume despite a temporary lull following the COVID-19 crisis, the United States remains an appealing market for masking tapes. FMI has identified the United States of America as a highly profitable masking tapes market, steering North American masking tapes market growth.

eCommerce Boom is Stirring up Gains in the United Kingdom

The expansion of the shipping and logistics sector in the United Kingdom has increased opportunities for masking tape sales. The e-commerce boom is driving up demand for logistics services. The United Kingdom is widely regarded as having one of Europe's most advanced e-commerce markets. E-commerce in the country totaled US$ 82.4 billion in 2019, representing a 7.7% increase over revenue generated in 2018.

Rising e-commerce activity is driving up demand for logistics and shipping, creating appealing masking tapes market opportunities as well as surged sales of masking tape. Masking tapes are becoming more popular in packaging. These tapes are more commonly used to secure boxes and bundles during shipping.

A streamlined outlook for construction industry growth in the United Kingdom is also a sign of good fortune for masking tape manufacturers in the midst of a pandemic crisis. The slowly reigniting construction industry is anticipated to offset the sharp slowdown in the manufacturing and services sectors in the United Kingdom.

As home builders push ahead with new projects, demand for masking tapes is expected to go up, making the construction sector one of the country's shining lights.

How is Germany's Construction Bubble Building up Demand?

FMI has outlined Germany as one of Western Europe's leading masking tapes market. The country's prominence is predicted to remain throughout the forecast period of the report. The positive performance of the country's construction sector is anticipated to continue to encourage the masking tapes market growth.

The German government is supportive of the construction industry. The Federal Ministry of Transport and Digital Infrastructure (BMVI) has established a "Road Map for Digital Design and Construction" to be used to carry out various construction projects in the future. Demand for masking tape in Germany is likely to increase progressively as a result of increased construction activity.

Japan Masking Tapes Market Reaping Benefits from Automotive Recovery

One of the primary drivers of the masking tapes market expansion is Japan's automotive sector's impressive growth. In October 2020, the Japanese new vehicle market expanded dramatically. Despite reporting a sharp decline in sales of masking tapes due to COVID-19, vehicle sales in Japan are rapidly improving, catapulting masking tape production and sales.

FMI forecasts consistent growth in the Japanese masking tapes market through 2030. The paper continues to be preferred among various materials used as industries throughout Japan continue to focus on sustainable solutions. Furthermore, demand from the building and construction sector is expected to rise at a rate greater than 4% through 2030, allowing Japan's masking tapes market to expand steadily.

How Competition Influences The Masking Tapes Market?

The masking tape market is projected to become more competitive in the coming few years. Masking tapes market companies are anticipated to concentrate on broadening their footprint through mergers and acquisitions while also addressing their resources toward product launches.

Recent Development:

  • Tesa SE has established a new manufacturing plant in China. In addition, the company invested 55 million euros in the construction of a new plant in Vietnam.
  • In order to strengthen its position in the healthcare sector, 3M has expanded its adhesive solution portfolio for wearable medical devices.
  • Tesa SE acquired Functional Coatings, Inc. in May 2018, a renowned manufacturer of adhesive coating and sealing.

Key Players

  • 3M
  • Intertape Polymer Group Inc
  • Shurtape Technologies LLC.
  • tesa SE Group
  • Nitto Denko Corp
  • Ahlstrom Corporation.
  • PPI Adhesive Products (C.E.) s.r.o.
  • Saint-Gobain Performance Plastics Corporation
  • Berry Global Group Inc.
  • Cintas Adhesivas Ubis SA
  • Scapa Group plc.
  • Advance Tapes International Ltd
  • Bolex (Shenzhen) Adhesive Products Co. Ltd.
  • Vibac Group S.p.a
  • Expera Specialty Solutions, LLC
  • Ultratape Industries Inc
  • Shanghai Yongguan Adhesive Productions Corp., Ltd.
  • Pro Tapes & Specialties, Inc.
  • Green Belting Industries Limited.
  • DeWAL Industries, Inc

Key Segments

By Backing Material Type:

  • Foam
  • Glass Fiber
  • Foil
    • Aluminium Foil
    • Lead Foil
  • Paper
    • Crepe Paper
    • Washi Paper
    • kraft Paper
    • Flatback Paper
  • Plastic
    • Polymide(PI)
    • PVC/Vinyl
    • Polyethylene Terephthalate/Polyester
    • Fluoropolymer

By Product Type:

  • Single Sided
  • Double Sided

By Adhesive Type:

  • Silicon-based Adhesive
  • Acrylic-based Adhesive
  • Rubber-based Adhesive

By Application Type:

  • Painting
  • Planting
  • Abrasive Blasting
  • High-Temperature Application
  • Thermal Spraying
  • General Use

By End-use:

  • Automotive
  • Building & Construction
    • Painting
    • Planting
    • Abrasive blasting
    • High-Temperature Application
    • Thermal Spraying
    • General Use
  • Aerospace
  • General Industry
    • Electronics & Electrical
    • Medical
    • Metal Working
    • Shipping & Logistics
    • Printing
  • Others

By Region:

  • North America
  • Latin America
  • Western Europe
  • Eastern Europe
  • Asia Pacific Excluding Japan
  • Japan
  • Middle East & Africa

Frequently Asked Questions

The masking tapes market is predicted to grow at a CAGR of 5.2% through 2032.

The North America masking tapes market holds the highest revenue potential.

The masking tapes market size is anticipated to be over US$ 4758.83 million in 2022.

The masking tapes market is expected to surpass US$ 7900.55 million by 2032.

Table of Content

1. Executive Summary | Masking Tapes Market

    1.1. Global Market Outlook

    1.2. Demand-side Trends

    1.3. Supply-side Trends

    1.4. Technology Roadmap Analysis

    1.5. Analysis and Recommendations

2. Market Overview

    2.1. Market Coverage / Taxonomy

    2.2. Market Definition / Scope / Limitations

3. Market Background

    3.1. Market Dynamics

        3.1.1. Drivers

        3.1.2. Restraints

        3.1.3. Opportunity

        3.1.4. Trends

    3.2. Scenario Forecast

        3.2.1. Demand in Optimistic Scenario

        3.2.2. Demand in Likely Scenario

        3.2.3. Demand in Conservative Scenario

    3.3. Opportunity Map Analysis

    3.4. Product Life Cycle Analysis

    3.5. Supply Chain Analysis

        3.5.1. Supply Side Participants and their Roles

            3.5.1.1. Producers

            3.5.1.2. Mid-Level Participants (Traders/ Agents/ Brokers)

            3.5.1.3. Wholesalers and Distributors

        3.5.2. Value Added and Value Created at Node in the Supply Chain

        3.5.3. List of Raw Material Suppliers

        3.5.4. List of Existing and Potential Buyers

    3.6. Investment Feasibility Matrix

    3.7. Value Chain Analysis

        3.7.1. Profit Margin Analysis

        3.7.2. Wholesalers and Distributors

        3.7.3. Retailers

    3.8. PESTLE and Porter’s Analysis

    3.9. Regulatory Landscape

        3.9.1. By Key Regions

        3.9.2. By Key Countries

    3.10. Regional Parent Market Outlook

    3.11. Production and Consumption Statistics

    3.12. Import and Export Statistics

4. Global Market Analysis 2017 to 2021 and Forecast, 2022 to 2032

    4.1. Historical Market Size Value (US$ Million) & Volume (Million Square Meters) Analysis, 2017 to 2021

    4.2. Current and Future Market Size Value (US$ Million) & Volume (Million Square Meters) Projections, 2022 to 2032

        4.2.1. Y-o-Y Growth Trend Analysis

        4.2.2. Absolute $ Opportunity Analysis

5. Global Market Analysis 2017 to 2021 and Forecast 2022 to 2032, By Backing Material Type

    5.1. Introduction / Key Findings

    5.2. Historical Market Size Value (US$ Million) & Volume (Million Square Meters) Analysis By Backing Material Type, 2017 to 2021

    5.3. Current and Future Market Size Value (US$ Million) & Volume (Million Square Meters) Analysis and Forecast By Backing Material Type, 2022 to 2032

        5.3.1. Foam

        5.3.2. Glass Fiber

        5.3.3. Foil

            5.3.3.1. Aluminium Foil

            5.3.3.2. Lead Foil

        5.3.4. Paper

            5.3.4.1. Crepe Paper

            5.3.4.2. Washi Paper

            5.3.4.3. kraft Paper

            5.3.4.4. Flatback Paper

        5.3.5. Plastic

            5.3.5.1. Polymide

            5.3.5.2. PVC/Vinyl

            5.3.5.3. Polyethylene Terephthalate/Polyester

            5.3.5.4. Fluoropolymer

    5.4. Y-o-Y Growth Trend Analysis By Backing Material Type, 2017 to 2021

    5.5. Absolute $ Opportunity Analysis By Backing Material Type, 2022 to 2032

6. Global Market Analysis 2017 to 2021 and Forecast 2022 to 2032, By Product Type

    6.1. Introduction / Key Findings

    6.2. Historical Market Size Value (US$ Million) & Volume (Million Square Meters) Analysis By Product Type, 2017 to 2021

    6.3. Current and Future Market Size Value (US$ Million) & Volume (Million Square Meters) Analysis and Forecast By Product Type, 2022 to 2032

        6.3.1. Single Sided

        6.3.2. Double Sided

    6.4. Y-o-Y Growth Trend Analysis By Product Type, 2017 to 2021

    6.5. Absolute $ Opportunity Analysis By Product Type, 2022 to 2032

7. Global Market Analysis 2017 to 2021 and Forecast 2022 to 2032, By Adhesive Type

    7.1. Introduction / Key Findings

    7.2. Historical Market Size Value (US$ Million) & Volume (Million Square Meters) Analysis By Adhesive Type, 2017 to 2021

    7.3. Current and Future Market Size Value (US$ Million) & Volume (Million Square Meters) Analysis and Forecast By Adhesive Type, 2022 to 2032

        7.3.1. Painting

        7.3.2. Planting

        7.3.3. Abrasive Blasting

        7.3.4. High-Temperature Application

        7.3.5. Thermal Spraying

        7.3.6. General Use

    7.4. Y-o-Y Growth Trend Analysis By Adhesive Type, 2017 to 2021

    7.5. Absolute $ Opportunity Analysis By Adhesive Type, 2022 to 2032

8. Global Market Analysis 2017 to 2021 and Forecast 2022 to 2032, By End-use

    8.1. Introduction / Key Findings

    8.2. Historical Market Size Value (US$ Million) & Volume (Million Square Meters) Analysis By End-use, 2017 to 2021

    8.3. Current and Future Market Size Value (US$ Million) & Volume (Million Square Meters) Analysis and Forecast By End-use, 2022 to 2032

        8.3.1. Automotive

        8.3.2. Building & Construction

            8.3.2.1. Painting

            8.3.2.2. Planting

            8.3.2.3. Abrasive blasting

            8.3.2.4. High-Temperature Application

            8.3.2.5. Thermal Spraying

            8.3.2.6. General Use

        8.3.3. Aerospace

        8.3.4. General Industry

            8.3.4.1. Electronics & Electrical

            8.3.4.2. Medical

            8.3.4.3. Metal Working

            8.3.4.4. Shipping & Logistics

            8.3.4.5. Printing

        8.3.5. Others

    8.4. Y-o-Y Growth Trend Analysis By End-use, 2017 to 2021

    8.5. Absolute $ Opportunity Analysis By End-use, 2022 to 2032

9. Global Market Analysis 2017 to 2021 and Forecast 2022 to 2032, By Region

    9.1. Introduction

    9.2. Historical Market Size Value (US$ Million) & Volume (Million Square Meters) Analysis By Region, 2017 to 2021

    9.3. Current Market Size Value (US$ Million) & Volume (Million Square Meters) Analysis and Forecast By Region, 2022 to 2032

        9.3.1. North America

        9.3.2. Latin America

        9.3.3. Europe

        9.3.4. Asia Pacific

        9.3.5. Middle East and Africa(MEA)

    9.4. Market Attractiveness Analysis By Region

10. North America Market Analysis 2017 to 2021 and Forecast 2022 to 2032, By Country

    10.1. Historical Market Size Value (US$ Million) & Volume (Million Square Meters) Trend Analysis By Market Taxonomy, 2017 to 2021

    10.2. Market Size Value (US$ Million) & Volume (Million Square Meters) Forecast By Market Taxonomy, 2022 to 2032

        10.2.1. By Country

            10.2.1.1. USA

            10.2.1.2. Canada

        10.2.2. By Backing Material Type

        10.2.3. By Product Type

        10.2.4. By Adhesive Type

        10.2.5. By End-use

    10.3. Market Attractiveness Analysis

        10.3.1. By Country

        10.3.2. By Backing Material Type

        10.3.3. By Product Type

        10.3.4. By Adhesive Type

        10.3.5. By End-use

    10.4. Key Takeaways

11. Latin America Market Analysis 2017 to 2021 and Forecast 2022 to 2032, By Country

    11.1. Historical Market Size Value (US$ Million) & Volume (Million Square Meters) Trend Analysis By Market Taxonomy, 2017 to 2021

    11.2. Market Size Value (US$ Million) & Volume (Million Square Meters) Forecast By Market Taxonomy, 2022 to 2032

        11.2.1. By Country

            11.2.1.1. Brazil

            11.2.1.2. Mexico

            11.2.1.3. Rest of Latin America

        11.2.2. By Backing Material Type

        11.2.3. By Product Type

        11.2.4. By Adhesive Type

        11.2.5. By End-use

    11.3. Market Attractiveness Analysis

        11.3.1. By Country

        11.3.2. By Backing Material Type

        11.3.3. By Product Type

        11.3.4. By Adhesive Type

        11.3.5. By End-use

    11.4. Key Takeaways

12. Europe Market Analysis 2017 to 2021 and Forecast 2022 to 2032, By Country

    12.1. Historical Market Size Value (US$ Million) & Volume (Million Square Meters) Trend Analysis By Market Taxonomy, 2017 to 2021

    12.2. Market Size Value (US$ Million) & Volume (Million Square Meters) Forecast By Market Taxonomy, 2022 to 2032

        12.2.1. By Country

            12.2.1.1. Germany

            12.2.1.2. United Kingdom

            12.2.1.3. France

            12.2.1.4. Spain

            12.2.1.5. Italy

            12.2.1.6. Rest of Europe

        12.2.2. By Backing Material Type

        12.2.3. By Product Type

        12.2.4. By Adhesive Type

        12.2.5. By End-use

    12.3. Market Attractiveness Analysis

        12.3.1. By Country

        12.3.2. By Backing Material Type

        12.3.3. By Product Type

        12.3.4. By Adhesive Type

        12.3.5. By End-use

    12.4. Key Takeaways

13. Asia Pacific Market Analysis 2017 to 2021 and Forecast 2022 to 2032, By Country

    13.1. Historical Market Size Value (US$ Million) & Volume (Million Square Meters) Trend Analysis By Market Taxonomy, 2017 to 2021

    13.2. Market Size Value (US$ Million) & Volume (Million Square Meters) Forecast By Market Taxonomy, 2022 to 2032

        13.2.1. By Country

            13.2.1.1. China

            13.2.1.2. Japan

            13.2.1.3. South Korea

            13.2.1.4. Singapore

            13.2.1.5. Thailand

            13.2.1.6. Indonesia

            13.2.1.7. Australia

            13.2.1.8. New Zealand

            13.2.1.9. Rest of Asia Pacific

        13.2.2. By Backing Material Type

        13.2.3. By Product Type

        13.2.4. By Adhesive Type

        13.2.5. By End-use

    13.3. Market Attractiveness Analysis

        13.3.1. By Country

        13.3.2. By Backing Material Type

        13.3.3. By Product Type

        13.3.4. By Adhesive Type

        13.3.5. By End-use

    13.4. Key Takeaways

14. MEA Market Analysis 2017 to 2021 and Forecast 2022 to 2032, By Country

    14.1. Historical Market Size Value (US$ Million) & Volume (Million Square Meters) Trend Analysis By Market Taxonomy, 2017 to 2021

    14.2. Market Size Value (US$ Million) & Volume (Million Square Meters) Forecast By Market Taxonomy, 2022 to 2032

        14.2.1. By Country

            14.2.1.1. GCC Countries

            14.2.1.2. South Africa

            14.2.1.3. Israel

            14.2.1.4. Rest of Middle East and Africa(MEA)

        14.2.2. By Backing Material Type

        14.2.3. By Product Type

        14.2.4. By Adhesive Type

        14.2.5. By End-use

    14.3. Market Attractiveness Analysis

        14.3.1. By Country

        14.3.2. By Backing Material Type

        14.3.3. By Product Type

        14.3.4. By Adhesive Type

        14.3.5. By End-use

    14.4. Key Takeaways

15. Key Countries Market Analysis

    15.1. USA

        15.1.1. Pricing Analysis

        15.1.2. Market Share Analysis, 2021

            15.1.2.1. By Backing Material Type

            15.1.2.2. By Product Type

            15.1.2.3. By Adhesive Type

            15.1.2.4. By End-use

    15.2. Canada

        15.2.1. Pricing Analysis

        15.2.2. Market Share Analysis, 2021

            15.2.2.1. By Backing Material Type

            15.2.2.2. By Product Type

            15.2.2.3. By Adhesive Type

            15.2.2.4. By End-use

    15.3. Brazil

        15.3.1. Pricing Analysis

        15.3.2. Market Share Analysis, 2021

            15.3.2.1. By Backing Material Type

            15.3.2.2. By Product Type

            15.3.2.3. By Adhesive Type

            15.3.2.4. By End-use

    15.4. Mexico

        15.4.1. Pricing Analysis

        15.4.2. Market Share Analysis, 2021

            15.4.2.1. By Backing Material Type

            15.4.2.2. By Product Type

            15.4.2.3. By Adhesive Type

            15.4.2.4. By End-use

    15.5. Germany

        15.5.1. Pricing Analysis

        15.5.2. Market Share Analysis, 2021

            15.5.2.1. By Backing Material Type

            15.5.2.2. By Product Type

            15.5.2.3. By Adhesive Type

            15.5.2.4. By End-use

    15.6. United Kingdom

        15.6.1. Pricing Analysis

        15.6.2. Market Share Analysis, 2021

            15.6.2.1. By Backing Material Type

            15.6.2.2. By Product Type

            15.6.2.3. By Adhesive Type

            15.6.2.4. By End-use

    15.7. France

        15.7.1. Pricing Analysis

        15.7.2. Market Share Analysis, 2021

            15.7.2.1. By Backing Material Type

            15.7.2.2. By Product Type

            15.7.2.3. By Adhesive Type

            15.7.2.4. By End-use

    15.8. Spain

        15.8.1. Pricing Analysis

        15.8.2. Market Share Analysis, 2021

            15.8.2.1. By Backing Material Type

            15.8.2.2. By Product Type

            15.8.2.3. By Adhesive Type

            15.8.2.4. By End-use

    15.9. Italy

        15.9.1. Pricing Analysis

        15.9.2. Market Share Analysis, 2021

            15.9.2.1. By Backing Material Type

            15.9.2.2. By Product Type

            15.9.2.3. By Adhesive Type

            15.9.2.4. By End-use

    15.10. China

        15.10.1. Pricing Analysis

        15.10.2. Market Share Analysis, 2021

            15.10.2.1. By Backing Material Type

            15.10.2.2. By Product Type

            15.10.2.3. By Adhesive Type

            15.10.2.4. By End-use

    15.11. Japan

        15.11.1. Pricing Analysis

        15.11.2. Market Share Analysis, 2021

            15.11.2.1. By Backing Material Type

            15.11.2.2. By Product Type

            15.11.2.3. By Adhesive Type

            15.11.2.4. By End-use

    15.12. South Korea

        15.12.1. Pricing Analysis

        15.12.2. Market Share Analysis, 2021

            15.12.2.1. By Backing Material Type

            15.12.2.2. By Product Type

            15.12.2.3. By Adhesive Type

            15.12.2.4. By End-use

    15.13. Singapore

        15.13.1. Pricing Analysis

        15.13.2. Market Share Analysis, 2021

            15.13.2.1. By Backing Material Type

            15.13.2.2. By Product Type

            15.13.2.3. By Adhesive Type

            15.13.2.4. By End-use

    15.14. Thailand

        15.14.1. Pricing Analysis

        15.14.2. Market Share Analysis, 2021

            15.14.2.1. By Backing Material Type

            15.14.2.2. By Product Type

            15.14.2.3. By Adhesive Type

            15.14.2.4. By End-use

    15.15. Indonesia

        15.15.1. Pricing Analysis

        15.15.2. Market Share Analysis, 2021

            15.15.2.1. By Backing Material Type

            15.15.2.2. By Product Type

            15.15.2.3. By Adhesive Type

            15.15.2.4. By End-use

    15.16. Australia

        15.16.1. Pricing Analysis

        15.16.2. Market Share Analysis, 2021

            15.16.2.1. By Backing Material Type

            15.16.2.2. By Product Type

            15.16.2.3. By Adhesive Type

            15.16.2.4. By End-use

    15.17. New Zealand

        15.17.1. Pricing Analysis

        15.17.2. Market Share Analysis, 2021

            15.17.2.1. By Backing Material Type

            15.17.2.2. By Product Type

            15.17.2.3. By Adhesive Type

            15.17.2.4. By End-use

    15.18. GCC Countries

        15.18.1. Pricing Analysis

        15.18.2. Market Share Analysis, 2021

            15.18.2.1. By Backing Material Type

            15.18.2.2. By Product Type

            15.18.2.3. By Adhesive Type

            15.18.2.4. By End-use

    15.19. South Africa

        15.19.1. Pricing Analysis

        15.19.2. Market Share Analysis, 2021

            15.19.2.1. By Backing Material Type

            15.19.2.2. By Product Type

            15.19.2.3. By Adhesive Type

            15.19.2.4. By End-use

    15.20. Israel

        15.20.1. Pricing Analysis

        15.20.2. Market Share Analysis, 2021

            15.20.2.1. By Backing Material Type

            15.20.2.2. By Product Type

            15.20.2.3. By Adhesive Type

            15.20.2.4. By End-use

16. Market Structure Analysis

    16.1. Competition Dashboard

    16.2. Competition Benchmarking

    16.3. Market Share Analysis of Top Players

        16.3.1. By Regional

        16.3.2. By Backing Material Type

        16.3.3. By Product Type

        16.3.4. By Adhesive Type

        16.3.5. By End-use

17. Competition Analysis

    17.1. Competition Deep Dive

        17.1.1. 3M Company

            17.1.1.1. Overview

            17.1.1.2. Product Portfolio

            17.1.1.3. Profitability by Market Segments

            17.1.1.4. Sales Footprint

            17.1.1.5. Strategy Overview

                17.1.1.5.1. Marketing Strategy

                17.1.1.5.2. Product Strategy

                17.1.1.5.3. Channel Strategy

        17.1.2. Intertapes Polymer Group Inc.

            17.1.2.1. Overview

            17.1.2.2. Product Portfolio

            17.1.2.3. Profitability by Market Segments

            17.1.2.4. Sales Footprint

            17.1.2.5. Strategy Overview

                17.1.2.5.1. Marketing Strategy

                17.1.2.5.2. Product Strategy

                17.1.2.5.3. Channel Strategy

        17.1.3. Shurtapes Technologies LLC.

            17.1.3.1. Overview

            17.1.3.2. Product Portfolio

            17.1.3.3. Profitability by Market Segments

            17.1.3.4. Sales Footprint

            17.1.3.5. Strategy Overview

                17.1.3.5.1. Marketing Strategy

                17.1.3.5.2. Product Strategy

                17.1.3.5.3. Channel Strategy

        17.1.4. Tesa SE Group

            17.1.4.1. Overview

            17.1.4.2. Product Portfolio

            17.1.4.3. Profitability by Market Segments

            17.1.4.4. Sales Footprint

            17.1.4.5. Strategy Overview

                17.1.4.5.1. Marketing Strategy

                17.1.4.5.2. Product Strategy

                17.1.4.5.3. Channel Strategy

        17.1.5. Nitto Denko Corp

            17.1.5.1. Overview

            17.1.5.2. Product Portfolio

            17.1.5.3. Profitability by Market Segments

            17.1.5.4. Sales Footprint

            17.1.5.5. Strategy Overview

                17.1.5.5.1. Marketing Strategy

                17.1.5.5.2. Product Strategy

                17.1.5.5.3. Channel Strategy

        17.1.6. Ahlstrom Corporation

            17.1.6.1. Overview

            17.1.6.2. Product Portfolio

            17.1.6.3. Profitability by Market Segments

            17.1.6.4. Sales Footprint

            17.1.6.5. Strategy Overview

                17.1.6.5.1. Marketing Strategy

                17.1.6.5.2. Product Strategy

                17.1.6.5.3. Channel Strategy

        17.1.7. PPI Adhesive Products (C.E.) s.r.o.

            17.1.7.1. Overview

            17.1.7.2. Product Portfolio

            17.1.7.3. Profitability by Market Segments

            17.1.7.4. Sales Footprint

            17.1.7.5. Strategy Overview

                17.1.7.5.1. Marketing Strategy

                17.1.7.5.2. Product Strategy

                17.1.7.5.3. Channel Strategy

        17.1.8. Saint-Gobain Performance Plastics Corporation

            17.1.8.1. Overview

            17.1.8.2. Product Portfolio

            17.1.8.3. Profitability by Market Segments

            17.1.8.4. Sales Footprint

            17.1.8.5. Strategy Overview

                17.1.8.5.1. Marketing Strategy

                17.1.8.5.2. Product Strategy

                17.1.8.5.3. Channel Strategy

        17.1.9. PPM INDUSTRIES S.P.A.

            17.1.9.1. Overview

            17.1.9.2. Product Portfolio

            17.1.9.3. Profitability by Market Segments

            17.1.9.4. Sales Footprint

            17.1.9.5. Strategy Overview

                17.1.9.5.1. Marketing Strategy

                17.1.9.5.2. Product Strategy

                17.1.9.5.3. Channel Strategy

        17.1.10. Canadian Technical Tapes Ltd.

            17.1.10.1. Overview

            17.1.10.2. Product Portfolio

            17.1.10.3. Profitability by Market Segments

            17.1.10.4. Sales Footprint

            17.1.10.5. Strategy Overview

                17.1.10.5.1. Marketing Strategy

                17.1.10.5.2. Product Strategy

                17.1.10.5.3. Channel Strategy

        17.1.11. Berry Global Group Inc.

            17.1.11.1. Overview

            17.1.11.2. Product Portfolio

            17.1.11.3. Profitability by Market Segments

            17.1.11.4. Sales Footprint

            17.1.11.5. Strategy Overview

                17.1.11.5.1. Marketing Strategy

                17.1.11.5.2. Product Strategy

                17.1.11.5.3. Channel Strategy

        17.1.12. Cintas Adhesivas Ubis, S.A.

            17.1.12.1. Overview

            17.1.12.2. Product Portfolio

            17.1.12.3. Profitability by Market Segments

            17.1.12.4. Sales Footprint

            17.1.12.5. Strategy Overview

                17.1.12.5.1. Marketing Strategy

                17.1.12.5.2. Product Strategy

                17.1.12.5.3. Channel Strategy

        17.1.13. Scapa Group plc.

            17.1.13.1. Overview

            17.1.13.2. Product Portfolio

            17.1.13.3. Profitability by Market Segments

            17.1.13.4. Sales Footprint

            17.1.13.5. Strategy Overview

                17.1.13.5.1. Marketing Strategy

                17.1.13.5.2. Product Strategy

                17.1.13.5.3. Channel Strategy

        17.1.14. Advance Tapes International Ltd.

            17.1.14.1. Overview

            17.1.14.2. Product Portfolio

            17.1.14.3. Profitability by Market Segments

            17.1.14.4. Sales Footprint

            17.1.14.5. Strategy Overview

                17.1.14.5.1. Marketing Strategy

                17.1.14.5.2. Product Strategy

                17.1.14.5.3. Channel Strategy

        17.1.15. Bolex (Shenzhen) Adhesive Products Co. Ltd.

            17.1.15.1. Overview

            17.1.15.2. Product Portfolio

            17.1.15.3. Profitability by Market Segments

            17.1.15.4. Sales Footprint

            17.1.15.5. Strategy Overview

                17.1.15.5.1. Marketing Strategy

                17.1.15.5.2. Product Strategy

                17.1.15.5.3. Channel Strategy

        17.1.16. Vibac Group S.p.a.

            17.1.16.1. Overview

            17.1.16.2. Product Portfolio

            17.1.16.3. Profitability by Market Segments

            17.1.16.4. Sales Footprint

            17.1.16.5. Strategy Overview

                17.1.16.5.1. Marketing Strategy

                17.1.16.5.2. Product Strategy

                17.1.16.5.3. Channel Strategy

18. Assumptions & Acronyms Used

19. Research Methodology

Don't pay for what you don't need

Customize your report by selecting specific countries or regions and save 30%!

List of Tables

Table 01: Global Market Value (US$ Million) Forecast by Region, 2017 to 2032

Table 02: Global Market Volume (Million Square Meters) Forecast by Region, 2017 to 2032

Table 03: Global Market Value (US$ Million) Forecast by Backing Material Type, 2017 to 2032

Table 04: Global Market Volume (Million Square Meters) Forecast by Backing Material Type, 2017 to 2032

Table 05: Global Market Value (US$ Million) Forecast by Product Type, 2017 to 2032

Table 06: Global Market Volume (Million Square Meters) Forecast by Product Type, 2017 to 2032

Table 07: Global Market Value (US$ Million) Forecast by Adhesive Type, 2017 to 2032

Table 08: Global Market Volume (Million Square Meters) Forecast by Adhesive Type, 2017 to 2032

Table 09: Global Market Value (US$ Million) Forecast by End-use, 2017 to 2032

Table 10: Global Market Volume (Million Square Meters) Forecast by End-use, 2017 to 2032

Table 11: North America Market Value (US$ Million) Forecast by Country, 2017 to 2032

Table 12: North America Market Volume (Million Square Meters) Forecast by Country, 2017 to 2032

Table 13: North America Market Value (US$ Million) Forecast by Backing Material Type, 2017 to 2032

Table 14: North America Market Volume (Million Square Meters) Forecast by Backing Material Type, 2017 to 2032

Table 15: North America Market Value (US$ Million) Forecast by Product Type, 2017 to 2032

Table 16: North America Market Volume (Million Square Meters) Forecast by Product Type, 2017 to 2032

Table 17: North America Market Value (US$ Million) Forecast by Adhesive Type, 2017 to 2032

Table 18: North America Market Volume (Million Square Meters) Forecast by Adhesive Type, 2017 to 2032

Table 19: North America Market Value (US$ Million) Forecast by End-use, 2017 to 2032

Table 20: North America Market Volume (Million Square Meters) Forecast by End-use, 2017 to 2032

Table 21: Latin America Market Value (US$ Million) Forecast by Country, 2017 to 2032

Table 22: Latin America Market Volume (Million Square Meters) Forecast by Country, 2017 to 2032

Table 23: Latin America Market Value (US$ Million) Forecast by Backing Material Type, 2017 to 2032

Table 24: Latin America Market Volume (Million Square Meters) Forecast by Backing Material Type, 2017 to 2032

Table 25: Latin America Market Value (US$ Million) Forecast by Product Type, 2017 to 2032

Table 26: Latin America Market Volume (Million Square Meters) Forecast by Product Type, 2017 to 2032

Table 27: Latin America Market Value (US$ Million) Forecast by Adhesive Type, 2017 to 2032

Table 28: Latin America Market Volume (Million Square Meters) Forecast by Adhesive Type, 2017 to 2032

Table 29: Latin America Market Value (US$ Million) Forecast by End-use, 2017 to 2032

Table 30: Latin America Market Volume (Million Square Meters) Forecast by End-use, 2017 to 2032

Table 31: Europe Market Value (US$ Million) Forecast by Country, 2017 to 2032

Table 32: Europe Market Volume (Million Square Meters) Forecast by Country, 2017 to 2032

Table 33: Europe Market Value (US$ Million) Forecast by Backing Material Type, 2017 to 2032

Table 34: Europe Market Volume (Million Square Meters) Forecast by Backing Material Type, 2017 to 2032

Table 35: Europe Market Value (US$ Million) Forecast by Product Type, 2017 to 2032

Table 36: Europe Market Volume (Million Square Meters) Forecast by Product Type, 2017 to 2032

Table 37: Europe Market Value (US$ Million) Forecast by Adhesive Type, 2017 to 2032

Table 38: Europe Market Volume (Million Square Meters) Forecast by Adhesive Type, 2017 to 2032

Table 39: Europe Market Value (US$ Million) Forecast by End-use, 2017 to 2032

Table 40: Europe Market Volume (Million Square Meters) Forecast by End-use, 2017 to 2032

Table 41: Asia Pacific Market Value (US$ Million) Forecast by Country, 2017 to 2032

Table 42: Asia Pacific Market Volume (Million Square Meters) Forecast by Country, 2017 to 2032

Table 43: Asia Pacific Market Value (US$ Million) Forecast by Backing Material Type, 2017 to 2032

Table 44: Asia Pacific Market Volume (Million Square Meters) Forecast by Backing Material Type, 2017 to 2032

Table 45: Asia Pacific Market Value (US$ Million) Forecast by Product Type, 2017 to 2032

Table 46: Asia Pacific Market Volume (Million Square Meters) Forecast by Product Type, 2017 to 2032

Table 47: Asia Pacific Market Value (US$ Million) Forecast by Adhesive Type, 2017 to 2032

Table 48: Asia Pacific Market Volume (Million Square Meters) Forecast by Adhesive Type, 2017 to 2032

Table 49: Asia Pacific Market Value (US$ Million) Forecast by End-use, 2017 to 2032

Table 50: Asia Pacific Market Volume (Million Square Meters) Forecast by End-use, 2017 to 2032

Table 51: MEA Market Value (US$ Million) Forecast by Country, 2017 to 2032

Table 52: MEA Market Volume (Million Square Meters) Forecast by Country, 2017 to 2032

Table 53: MEA Market Value (US$ Million) Forecast by Backing Material Type, 2017 to 2032

Table 54: MEA Market Volume (Million Square Meters) Forecast by Backing Material Type, 2017 to 2032

Table 55: MEA Market Value (US$ Million) Forecast by Product Type, 2017 to 2032

Table 56: MEA Market Volume (Million Square Meters) Forecast by Product Type, 2017 to 2032

Table 57: MEA Market Value (US$ Million) Forecast by Adhesive Type, 2017 to 2032

Table 58: MEA Market Volume (Million Square Meters) Forecast by Adhesive Type, 2017 to 2032

Table 59: MEA Market Value (US$ Million) Forecast by End-use, 2017 to 2032

Table 60: MEA Market Volume (Million Square Meters) Forecast by End-use, 2017 to 2032
Ismail Sutaria
Ismail Sutaria

Principal Consultant

Talk to Analyst

Find your sweet spots for generating winning opportunities in this market.

List of Charts

Figure 01: Global Market Value (US$ Million) by Backing Material Type, 2022 to 2032

Figure 02: Global Market Value (US$ Million) by Product Type, 2022 to 2032

Figure 03: Global Market Value (US$ Million) by Adhesive Type, 2022 to 2032

Figure 04: Global Market Value (US$ Million) by End-use, 2022 to 2032

Figure 05: Global Market Value (US$ Million) by Region, 2022 to 2032

Figure 06: Global Market Value (US$ Million) Analysis by Region, 2017 to 2032

Figure 07: Global Market Volume (Million Square Meters) Analysis by Region, 2017 to 2032

Figure 08: Global Market Value Share (%) and BPS Analysis by Region, 2022 to 2032

Figure 09: Global Market Y-o-Y Growth (%) Projections by Region, 2022 to 2032

Figure 10: Global Market Value (US$ Million) Analysis by Backing Material Type, 2017 to 2032

Figure 11: Global Market Volume (Million Square Meters) Analysis by Backing Material Type, 2017 to 2032

Figure 12: Global Market Value Share (%) and BPS Analysis by Backing Material Type, 2022 to 2032

Figure 13: Global Market Y-o-Y Growth (%) Projections by Backing Material Type, 2022 to 2032

Figure 14: Global Market Value (US$ Million) Analysis by Product Type, 2017 to 2032

Figure 15: Global Market Volume (Million Square Meters) Analysis by Product Type, 2017 to 2032

Figure 16: Global Market Value Share (%) and BPS Analysis by Product Type, 2022 to 2032

Figure 17: Global Market Y-o-Y Growth (%) Projections by Product Type, 2022 to 2032

Figure 18: Global Market Value (US$ Million) Analysis by Adhesive Type, 2017 to 2032

Figure 19: Global Market Volume (Million Square Meters) Analysis by Adhesive Type, 2017 to 2032

Figure 20: Global Market Value Share (%) and BPS Analysis by Adhesive Type, 2022 to 2032

Figure 21: Global Market Y-o-Y Growth (%) Projections by Adhesive Type, 2022 to 2032

Figure 22: Global Market Value (US$ Million) Analysis by End-use, 2017 to 2032

Figure 23: Global Market Volume (Million Square Meters) Analysis by End-use, 2017 to 2032

Figure 24: Global Market Value Share (%) and BPS Analysis by End-use, 2022 to 2032

Figure 25: Global Market Y-o-Y Growth (%) Projections by End-use, 2022 to 2032

Figure 26: Global Market Attractiveness by Backing Material Type, 2022 to 2032

Figure 27: Global Market Attractiveness by Product Type, 2022 to 2032

Figure 28: Global Market Attractiveness by Adhesive Type, 2022 to 2032

Figure 29: Global Market Attractiveness by End-use, 2022 to 2032

Figure 30: Global Market Attractiveness by Region, 2022 to 2032

Figure 31: North America Market Value (US$ Million) by Backing Material Type, 2022 to 2032

Figure 32: North America Market Value (US$ Million) by Product Type, 2022 to 2032

Figure 33: North America Market Value (US$ Million) by Adhesive Type, 2022 to 2032

Figure 34: North America Market Value (US$ Million) by End-use, 2022 to 2032

Figure 35: North America Market Value (US$ Million) by Country, 2022 to 2032

Figure 36: North America Market Value (US$ Million) Analysis by Country, 2017 to 2032

Figure 37: North America Market Volume (Million Square Meters) Analysis by Country, 2017 to 2032

Figure 38: North America Market Value Share (%) and BPS Analysis by Country, 2022 to 2032

Figure 39: North America Market Y-o-Y Growth (%) Projections by Country, 2022 to 2032

Figure 40: North America Market Value (US$ Million) Analysis by Backing Material Type, 2017 to 2032

Figure 41: North America Market Volume (Million Square Meters) Analysis by Backing Material Type, 2017 to 2032

Figure 42: North America Market Value Share (%) and BPS Analysis by Backing Material Type, 2022 to 2032

Figure 43: North America Market Y-o-Y Growth (%) Projections by Backing Material Type, 2022 to 2032

Figure 44: North America Market Value (US$ Million) Analysis by Product Type, 2017 to 2032

Figure 45: North America Market Volume (Million Square Meters) Analysis by Product Type, 2017 to 2032

Figure 46: North America Market Value Share (%) and BPS Analysis by Product Type, 2022 to 2032

Figure 47: North America Market Y-o-Y Growth (%) Projections by Product Type, 2022 to 2032

Figure 48: North America Market Value (US$ Million) Analysis by Adhesive Type, 2017 to 2032

Figure 49: North America Market Volume (Million Square Meters) Analysis by Adhesive Type, 2017 to 2032

Figure 50: North America Market Value Share (%) and BPS Analysis by Adhesive Type, 2022 to 2032

Figure 51: North America Market Y-o-Y Growth (%) Projections by Adhesive Type, 2022 to 2032

Figure 52: North America Market Value (US$ Million) Analysis by End-use, 2017 to 2032

Figure 53: North America Market Volume (Million Square Meters) Analysis by End-use, 2017 to 2032

Figure 54: North America Market Value Share (%) and BPS Analysis by End-use, 2022 to 2032

Figure 55: North America Market Y-o-Y Growth (%) Projections by End-use, 2022 to 2032

Figure 56: North America Market Attractiveness by Backing Material Type, 2022 to 2032

Figure 57: North America Market Attractiveness by Product Type, 2022 to 2032

Figure 58: North America Market Attractiveness by Adhesive Type, 2022 to 2032

Figure 59: North America Market Attractiveness by End-use, 2022 to 2032

Figure 60: North America Market Attractiveness by Country, 2022 to 2032

Figure 61: Latin America Market Value (US$ Million) by Backing Material Type, 2022 to 2032

Figure 62: Latin America Market Value (US$ Million) by Product Type, 2022 to 2032

Figure 63: Latin America Market Value (US$ Million) by Adhesive Type, 2022 to 2032

Figure 64: Latin America Market Value (US$ Million) by End-use, 2022 to 2032

Figure 65: Latin America Market Value (US$ Million) by Country, 2022 to 2032

Figure 66: Latin America Market Value (US$ Million) Analysis by Country, 2017 to 2032

Figure 67: Latin America Market Volume (Million Square Meters) Analysis by Country, 2017 to 2032

Figure 68: Latin America Market Value Share (%) and BPS Analysis by Country, 2022 to 2032

Figure 69: Latin America Market Y-o-Y Growth (%) Projections by Country, 2022 to 2032

Figure 70: Latin America Market Value (US$ Million) Analysis by Backing Material Type, 2017 to 2032

Figure 71: Latin America Market Volume (Million Square Meters) Analysis by Backing Material Type, 2017 to 2032

Figure 72: Latin America Market Value Share (%) and BPS Analysis by Backing Material Type, 2022 to 2032

Figure 73: Latin America Market Y-o-Y Growth (%) Projections by Backing Material Type, 2022 to 2032

Figure 74: Latin America Market Value (US$ Million) Analysis by Product Type, 2017 to 2032

Figure 75: Latin America Market Volume (Million Square Meters) Analysis by Product Type, 2017 to 2032

Figure 76: Latin America Market Value Share (%) and BPS Analysis by Product Type, 2022 to 2032

Figure 77: Latin America Market Y-o-Y Growth (%) Projections by Product Type, 2022 to 2032

Figure 78: Latin America Market Value (US$ Million) Analysis by Adhesive Type, 2017 to 2032

Figure 79: Latin America Market Volume (Million Square Meters) Analysis by Adhesive Type, 2017 to 2032

Figure 80: Latin America Market Value Share (%) and BPS Analysis by Adhesive Type, 2022 to 2032

Figure 81: Latin America Market Y-o-Y Growth (%) Projections by Adhesive Type, 2022 to 2032

Figure 82: Latin America Market Value (US$ Million) Analysis by End-use, 2017 to 2032

Figure 83: Latin America Market Volume (Million Square Meters) Analysis by End-use, 2017 to 2032

Figure 84: Latin America Market Value Share (%) and BPS Analysis by End-use, 2022 to 2032

Figure 85: Latin America Market Y-o-Y Growth (%) Projections by End-use, 2022 to 2032

Figure 86: Latin America Market Attractiveness by Backing Material Type, 2022 to 2032

Figure 87: Latin America Market Attractiveness by Product Type, 2022 to 2032

Figure 88: Latin America Market Attractiveness by Adhesive Type, 2022 to 2032

Figure 89: Latin America Market Attractiveness by End-use, 2022 to 2032

Figure 90: Latin America Market Attractiveness by Country, 2022 to 2032

Figure 91: Europe Market Value (US$ Million) by Backing Material Type, 2022 to 2032

Figure 92: Europe Market Value (US$ Million) by Product Type, 2022 to 2032

Figure 93: Europe Market Value (US$ Million) by Adhesive Type, 2022 to 2032

Figure 94: Europe Market Value (US$ Million) by End-use, 2022 to 2032

Figure 95: Europe Market Value (US$ Million) by Country, 2022 to 2032

Figure 96: Europe Market Value (US$ Million) Analysis by Country, 2017 to 2032

Figure 97: Europe Market Volume (Million Square Meters) Analysis by Country, 2017 to 2032

Figure 98: Europe Market Value Share (%) and BPS Analysis by Country, 2022 to 2032

Figure 99: Europe Market Y-o-Y Growth (%) Projections by Country, 2022 to 2032

Figure 100: Europe Market Value (US$ Million) Analysis by Backing Material Type, 2017 to 2032

Figure 101: Europe Market Volume (Million Square Meters) Analysis by Backing Material Type, 2017 to 2032

Figure 102: Europe Market Value Share (%) and BPS Analysis by Backing Material Type, 2022 to 2032

Figure 103: Europe Market Y-o-Y Growth (%) Projections by Backing Material Type, 2022 to 2032

Figure 104: Europe Market Value (US$ Million) Analysis by Product Type, 2017 to 2032

Figure 105: Europe Market Volume (Million Square Meters) Analysis by Product Type, 2017 to 2032

Figure 106: Europe Market Value Share (%) and BPS Analysis by Product Type, 2022 to 2032

Figure 107: Europe Market Y-o-Y Growth (%) Projections by Product Type, 2022 to 2032

Figure 108: Europe Market Value (US$ Million) Analysis by Adhesive Type, 2017 to 2032

Figure 109: Europe Market Volume (Million Square Meters) Analysis by Adhesive Type, 2017 to 2032

Figure 110: Europe Market Value Share (%) and BPS Analysis by Adhesive Type, 2022 to 2032

Figure 111: Europe Market Y-o-Y Growth (%) Projections by Adhesive Type, 2022 to 2032

Figure 112: Europe Market Value (US$ Million) Analysis by End-use, 2017 to 2032

Figure 113: Europe Market Volume (Million Square Meters) Analysis by End-use, 2017 to 2032

Figure 114: Europe Market Value Share (%) and BPS Analysis by End-use, 2022 to 2032

Figure 115: Europe Market Y-o-Y Growth (%) Projections by End-use, 2022 to 2032

Figure 116: Europe Market Attractiveness by Backing Material Type, 2022 to 2032

Figure 117: Europe Market Attractiveness by Product Type, 2022 to 2032

Figure 118: Europe Market Attractiveness by Adhesive Type, 2022 to 2032

Figure 119: Europe Market Attractiveness by End-use, 2022 to 2032

Figure 120: Europe Market Attractiveness by Country, 2022 to 2032

Figure 121: Asia Pacific Market Value (US$ Million) by Backing Material Type, 2022 to 2032

Figure 122: Asia Pacific Market Value (US$ Million) by Product Type, 2022 to 2032

Figure 123: Asia Pacific Market Value (US$ Million) by Adhesive Type, 2022 to 2032

Figure 124: Asia Pacific Market Value (US$ Million) by End-use, 2022 to 2032

Figure 125: Asia Pacific Market Value (US$ Million) by Country, 2022 to 2032

Figure 126: Asia Pacific Market Value (US$ Million) Analysis by Country, 2017 to 2032

Figure 127: Asia Pacific Market Volume (Million Square Meters) Analysis by Country, 2017 to 2032

Figure 128: Asia Pacific Market Value Share (%) and BPS Analysis by Country, 2022 to 2032

Figure 129: Asia Pacific Market Y-o-Y Growth (%) Projections by Country, 2022 to 2032

Figure 130: Asia Pacific Market Value (US$ Million) Analysis by Backing Material Type, 2017 to 2032

Figure 131: Asia Pacific Market Volume (Million Square Meters) Analysis by Backing Material Type, 2017 to 2032

Figure 132: Asia Pacific Market Value Share (%) and BPS Analysis by Backing Material Type, 2022 to 2032

Figure 133: Asia Pacific Market Y-o-Y Growth (%) Projections by Backing Material Type, 2022 to 2032

Figure 134: Asia Pacific Market Value (US$ Million) Analysis by Product Type, 2017 to 2032

Figure 135: Asia Pacific Market Volume (Million Square Meters) Analysis by Product Type, 2017 to 2032

Figure 136: Asia Pacific Market Value Share (%) and BPS Analysis by Product Type, 2022 to 2032

Figure 137: Asia Pacific Market Y-o-Y Growth (%) Projections by Product Type, 2022 to 2032

Figure 138: Asia Pacific Market Value (US$ Million) Analysis by Adhesive Type, 2017 to 2032

Figure 139: Asia Pacific Market Volume (Million Square Meters) Analysis by Adhesive Type, 2017 to 2032

Figure 140: Asia Pacific Market Value Share (%) and BPS Analysis by Adhesive Type, 2022 to 2032

Figure 141: Asia Pacific Market Y-o-Y Growth (%) Projections by Adhesive Type, 2022 to 2032

Figure 142: Asia Pacific Market Value (US$ Million) Analysis by End-use, 2017 to 2032

Figure 143: Asia Pacific Market Volume (Million Square Meters) Analysis by End-use, 2017 to 2032

Figure 144: Asia Pacific Market Value Share (%) and BPS Analysis by End-use, 2022 to 2032

Figure 145: Asia Pacific Market Y-o-Y Growth (%) Projections by End-use, 2022 to 2032

Figure 146: Asia Pacific Market Attractiveness by Backing Material Type, 2022 to 2032

Figure 147: Asia Pacific Market Attractiveness by Product Type, 2022 to 2032

Figure 148: Asia Pacific Market Attractiveness by Adhesive Type, 2022 to 2032

Figure 149: Asia Pacific Market Attractiveness by End-use, 2022 to 2032

Figure 150: Asia Pacific Market Attractiveness by Country, 2022 to 2032

Figure 151: MEA Market Value (US$ Million) by Backing Material Type, 2022 to 2032

Figure 152: MEA Market Value (US$ Million) by Product Type, 2022 to 2032

Figure 153: MEA Market Value (US$ Million) by Adhesive Type, 2022 to 2032

Figure 154: MEA Market Value (US$ Million) by End-use, 2022 to 2032

Figure 155: MEA Market Value (US$ Million) by Country, 2022 to 2032

Figure 156: MEA Market Value (US$ Million) Analysis by Country, 2017 to 2032

Figure 157: MEA Market Volume (Million Square Meters) Analysis by Country, 2017 to 2032

Figure 158: MEA Market Value Share (%) and BPS Analysis by Country, 2022 to 2032

Figure 159: MEA Market Y-o-Y Growth (%) Projections by Country, 2022 to 2032

Figure 160: MEA Market Value (US$ Million) Analysis by Backing Material Type, 2017 to 2032

Figure 161: MEA Market Volume (Million Square Meters) Analysis by Backing Material Type, 2017 to 2032

Figure 162: MEA Market Value Share (%) and BPS Analysis by Backing Material Type, 2022 to 2032

Figure 163: MEA Market Y-o-Y Growth (%) Projections by Backing Material Type, 2022 to 2032

Figure 164: MEA Market Value (US$ Million) Analysis by Product Type, 2017 to 2032

Figure 165: MEA Market Volume (Million Square Meters) Analysis by Product Type, 2017 to 2032

Figure 166: MEA Market Value Share (%) and BPS Analysis by Product Type, 2022 to 2032

Figure 167: MEA Market Y-o-Y Growth (%) Projections by Product Type, 2022 to 2032

Figure 168: MEA Market Value (US$ Million) Analysis by Adhesive Type, 2017 to 2032

Figure 169: MEA Market Volume (Million Square Meters) Analysis by Adhesive Type, 2017 to 2032

Figure 170: MEA Market Value Share (%) and BPS Analysis by Adhesive Type, 2022 to 2032

Figure 171: MEA Market Y-o-Y Growth (%) Projections by Adhesive Type, 2022 to 2032

Figure 172: MEA Market Value (US$ Million) Analysis by End-use, 2017 to 2032

Figure 173: MEA Market Volume (Million Square Meters) Analysis by End-use, 2017 to 2032

Figure 174: MEA Market Value Share (%) and BPS Analysis by End-use, 2022 to 2032

Figure 175: MEA Market Y-o-Y Growth (%) Projections by End-use, 2022 to 2032

Figure 176: MEA Market Attractiveness by Backing Material Type, 2022 to 2032

Figure 177: MEA Market Attractiveness by Product Type, 2022 to 2032

Figure 178: MEA Market Attractiveness by Adhesive Type, 2022 to 2032

Figure 179: MEA Market Attractiveness by End-use, 2022 to 2032

Figure 180: MEA Market Attractiveness by Country, 2022 to 2032

Recommendations

Chemicals & Materials

UV Tapes Market

Published : July 2023

Packaging

Tapes Market

Published : June 2023

Packaging

Hydrocolloid Tapes Market

Published : September 2022

Explore Packaging Insights

View Reports