Tape Dispenser Market Size and Share Forecast Outlook in Western Europe From 2024 to 2034

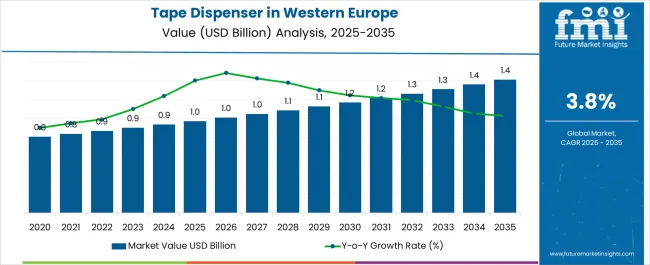
In Western Europe, the tape dispensers landscape is likely to exhibit a CAGR of 4% through 2034. The tape dispenser in Western Europe is poised to witness significant opportunities with USD 934.4 million in 2024.

Tape dispensers that cater specifically to e-commerce needs, such as efficient sealing for various package sizes, are gaining traction in Western Europe. Industry players are coming up with ergonomic designs for better user experience, improved cutting mechanisms for efficiency, and intelligent features that enhance functionality or usage monitoring. By 2034, tape dispensers demand in Western Europe will likely secure USD 1,385.50 million.

Key Insights and Highlights to Understand Emerging and Fast-growing Opportunities

  • The significant growth in e-commerce, leading to increased demand for efficient packaging solutions like tape dispensers in Western Europe
  • The region's robust industrial and manufacturing sector provides an opportunity for tape dispensing industry as they are essential for sealing and packaging goods.
Attributes Details
Expected Value in 2024 USD 934.4 million
Projected Value in 2034 USD 1,385.50 million
CAGR Estimation from 2024 to 2034 4%

Top Trends Driving Demand for Tape Dispensers in Western Europe

  • Tape dispensers made from eco-friendly materials, such as recyclable plastics or biodegradable options, are gaining popularity due to increasing environmental awareness and stringent regulations in Western Europe
  • Customized tape dispensers with branding options are in demand for promotional purposes. Companies seek personalized solutions to reinforce their brand identity, especially in the retail sector
  • Increasing adoption of automated packaging solutions in various industries. Tape dispensers integrated into automated packaging lines or those offering higher speed and precision align with this trend

Analysis of Top Countries Manufacturing and Using Tape Dispensers in Western Europe

Growing Manufacturing to Boost the Tape Dispenser in the United Kingdom

The growth of tape dispense in Germany is attributed to the country's high-quality manufacturing sector and strict quality standards. The increasing adoption of automated tape dispensers in the automotive and aerospace industries also contributes to the industry growth in Germany. The tape dispenser in Germany is expected to grow with a CAGR of 4.70% from 2024 to 2034.

Germany has a robust industrial sector, including manufacturing and logistics. Tape dispensers are essential for packaging, sealing, and bundling goods in these industries, contributing to consistent demand. The growth of e-commerce in Germany has surged demand for efficient packaging solutions. Tape dispensers play a crucial role in securing shipping parcels, aligning with online retail's rise.

Growing Emphasis on Sustainability Drives Tape Dispenser Demand in United Kingdom

The automotive interior leather industry in United Kingdom is expected to grow with a CAGR of 3.80% during the forecast period. The demand for tape dispensers in the United Kingdom is driven by the country's strong economy and high demand for office and commercial supplies. Tape dispensers are widely used in the office and commercial sector for various applications, such as sealing envelopes, attaching documents, and packaging.

Significant increase in online retail in United Kingdom has driven the demand for efficient packaging solutions, including tape dispensers, to secure packages for shipping. Growing emphasis on sustainability in the United Kingdom. Tape dispensers made from eco-friendly materials or recyclable and biodegradable options are gaining traction in the country.

Tape Dispenser Industry Analysis by Top Investment Segments in Western Europe

Table Top Dispenser Segment Is Gaining Popularity

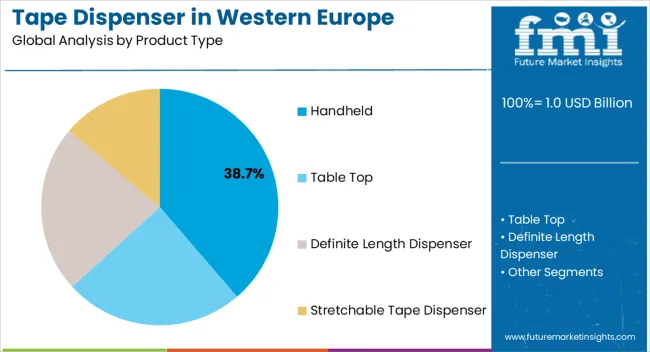
The table-top segment is expected to account for 56.50% of the industry share in 2024. Table-top tape dispensers are commonly used in office and commercial settings, as they are designed for high-volume use and can accommodate large rolls of tape.

They are also commonly used in the manufacturing industry, where they are used for sealing boxes and packaging materials. Table-top tape dispensers are preferred over hand-held tape dispensers in settings where tape dispensing is a constant activity.

Attribute Details
Product Type Table Top
Value Share 56.50%

Office and Commercial Segment to Account for High Industry Share

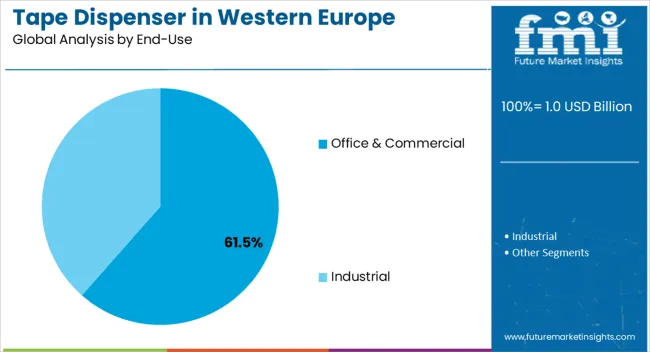
The office and commercial segment is estimated to dominate the tape dispenser industry by end users, with an industry share of 55.50% in 2024. This is due to the high demand for tape dispensers in office and commercial settings, which are used for various purposes, such as sealing envelopes, attaching documents, and packaging.

Tape dispensers are essential office supplies, and their demand is expected to increase with the growth of eCommerce and online shopping. Industrial tape dispensers are commonly used in manufacturing for packaging, assembly, and labeling applications.

Attribute Details
End-Use Office and Commercial
Value Share 55.50%

Leading Suppliers in the Western Europe Tape Dispenser Market

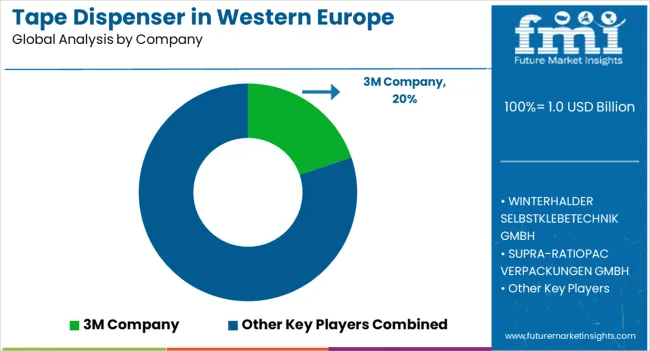
The tape dispenser industry is highly competitive, with numerous manufacturers competing for market share. The industry is fragmented, with many small manufacturers and a few key players dominating the industry. Market players also focus on introducing sustainable materials to keep pace with changing industry preferences. Expansion strategies are expected to remain highly popular among leading players.

Key Companies Profiled in the Western Europe Tape Dispenser Industry

  • WINTERHALDER SELBSTKLEBETECHNIK GMBH
  • SUPRA-RATIOPAC VERPACKUNGEN GMBH
  • Tesa SE
  • 3M Company
  • Intertape Polymer Group Inc.
  • Fellow Brands
  • Shurtape Technologies LLC
  • Koziol USA
  • START International
  • Prisma Pressure Sensitive Products Ltd.

Product Portfolio

  • 3M offers a range of tape dispensers for various industries, including commercial, industrial, and consumer sectors. They focus on innovation and sustainability in their product lines.
  • Scotch a brand under 3M, specializes in tape products, including tape dispensers. They cater to industrial and consumer segments with a diverse range of dispensers designed for efficiency and ease of use.
  • Tesa SE a prominent player in adhesive applications, provides tape dispensers designed for different industries and applications. They emphasize innovation and sustainability, offering eco-friendly options in their product line.
  • Staples a major retailer of office supplies in Western Europe, offers its line of tape dispensers catering to office and consumer needs. They focus on providing cost-effective and user-friendly solutions.

Key Shifting Preferences Covered in the Western Europe Tape Dispenser Market Report

Attribute Details
Estimated Industry Size in 2024 USD 934.4 million
Projected Industry Size in 2034 USD 1,385.50 million
Anticipated CAGR between 2024 to 2034 4% CAGR
Historical Analysis of Demand for Deployment of Tape Dispensers in Western Europe 2019 to 2023
Demand Forecast for Deployment of Tape Dispenser in Western Europe 2024 to 2034
Report Coverage Industry Size, Industry Trends, Analysis of key factors influencing Deployment of Tape Dispenser in Western Europe, Insights on Global Players and their Industry Strategy in Western Europe, Ecosystem Analysis of Local Providers in Western Europe.
Key Countries Analyzed While Studying Opportunities in the Deployment of Tape Dispenser in Western Europe The United Kingdom, Germany, Italy, France, Spain, Rest of Western Europe
Key Companies Profiled WINTERHALDER SELBSTKLEBETECHNIK GMBH; SUPRA-RATIOPAC VERPACKUNGEN GMBH; Tesa SE; 3M Company; Intertape Polymer Group Inc.; Fellow Brands; Shurtape Technologies LLC; Koziol USA; START International; Prisma Pressure Sensitive Products Ltd.

Top Segments Studied in the Western Europe Tape Dispenser Market Report

By Product type:

  • Handheld
  • Table top
  • Definite Length Dispenser
  • Stretchable Tape Dispenser

By Technology:

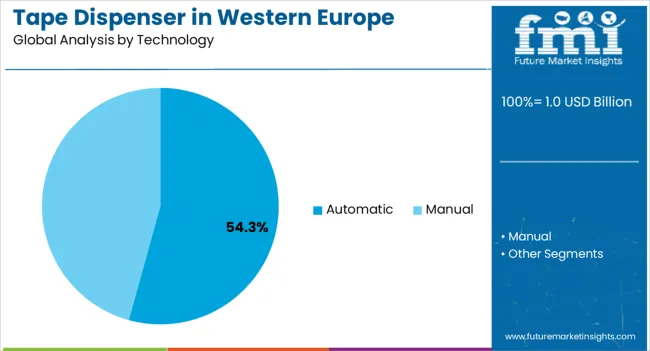
  • Automatic
  • Manual

By End-Use:

  • Office & Commercial
  • Industrial

By Countries:

  • The United Kingdom
  • Germany
  • Italy
  • France
  • Spain
  • Rest of Western Europe

Table of Content

  • 1. Executive Summary
  • 2. Market Overview
  • 3. Market Background
  • 4. Industry Analysis and Outlook 2019 to 2023 and Forecast, 2024 to 2034
  • 5. Industry Analysis and Outlook 2019 to 2023 and Forecast 2024 to 2034, By Product Type
    • 5.1. Handheld
    • 5.2. Table top
    • 5.3. Definite Length Dispenser
    • 5.4. Stretchable
  • 6. Industry Analysis and Outlook 2019 to 2023 and Forecast 2024 to 2034, By Technology
    • 6.1. Automatic
    • 6.2. Manual
  • 7. Industry Analysis and Outlook 2019 to 2023 and Forecast 2024 to 2034, By End-use
    • 7.1. Office & Commercial
    • 7.2. Industrial
  • 8. Industry Analysis and Outlook 2019 to 2023 and Forecast 2024 to 2034, By Country
    • 8.1. UK
    • 8.2. Germany
    • 8.3. Italy
    • 8.4. France
    • 8.5. Spain
    • 8.6. Rest of
  • 9. UK Industry Analysis and Outlook 2019 to 2023 and Forecast 2024 to 2034, By Region
  • 10. Germany Industry Analysis and Outlook 2019 to 2023 and Forecast 2024 to 2034, By Region
  • 11. Italy Industry Analysis and Outlook 2019 to 2023 and Forecast 2024 to 2034, By Region
  • 12. France Industry Analysis and Outlook 2019 to 2023 and Forecast 2024 to 2034, By Region
  • 13. Spain Industry Analysis and Outlook 2019 to 2023 and Forecast 2024 to 2034, By Region
  • 14. Rest of Industry Analysis and Outlook 2019 to 2023 and Forecast 2024 to 2034
  • 16. Competition Analysis
    • 16.1. WINTERHALDER SELBSTKLEBETECHNIK GMBH
    • 16.2. SUPRA-RATIOPAC VERPACKUNGEN GMBH
    • 16.3. Tesa SE
    • 16.4. 3M Company
    • 16.5. Intertape Polymer Group Inc.
    • 16.6. Fellow Brands
    • 16.7. Shurtape Technologies LLC
    • 16.8. Koziol USA
    • 16.9. START International
    • 16.10. Prisma Pressure Sensitive Products Ltd.
  • 17. Assumptions & Acronyms Used
  • 18. Research Methodology

List of Tables

Table 1: Industry Analysis and Outlook Value (US$ Million) Forecast by Country, 2019 to 2034

Table 2: Industry Analysis and Outlook Volume (Units) Forecast by Country, 2019 to 2034

Table 3: Industry Analysis and Outlook Value (US$ Million) Forecast by Product Type, 2019 to 2034

Table 4: Industry Analysis and Outlook Volume (Units) Forecast by Product Type, 2019 to 2034

Table 5: Industry Analysis and Outlook Value (US$ Million) Forecast by Technology, 2019 to 2034

Table 6: Industry Analysis and Outlook Volume (Units) Forecast by Technology, 2019 to 2034

Table 7: Industry Analysis and Outlook Value (US$ Million) Forecast by End-use, 2019 to 2034

Table 8: Industry Analysis and Outlook Volume (Units) Forecast by End-use, 2019 to 2034

Table 9: UK Industry Analysis and Outlook Value (US$ Million) Forecast By Region, 2019 to 2034

Table 10: UK Industry Analysis and Outlook Volume (Units) Forecast By Region, 2019 to 2034

Table 11: UK Industry Analysis and Outlook Value (US$ Million) Forecast by Product Type, 2019 to 2034

Table 12: UK Industry Analysis and Outlook Volume (Units) Forecast by Product Type, 2019 to 2034

Table 13: UK Industry Analysis and Outlook Value (US$ Million) Forecast by Technology, 2019 to 2034

Table 14: UK Industry Analysis and Outlook Volume (Units) Forecast by Technology, 2019 to 2034

Table 15: UK Industry Analysis and Outlook Value (US$ Million) Forecast by End-use, 2019 to 2034

Table 16: UK Industry Analysis and Outlook Volume (Units) Forecast by End-use, 2019 to 2034

Table 17: Germany Industry Analysis and Outlook Value (US$ Million) Forecast By Region, 2019 to 2034

Table 18: Germany Industry Analysis and Outlook Volume (Units) Forecast By Region, 2019 to 2034

Table 19: Germany Industry Analysis and Outlook Value (US$ Million) Forecast by Product Type, 2019 to 2034

Table 20: Germany Industry Analysis and Outlook Volume (Units) Forecast by Product Type, 2019 to 2034

Table 21: Germany Industry Analysis and Outlook Value (US$ Million) Forecast by Technology, 2019 to 2034

Table 22: Germany Industry Analysis and Outlook Volume (Units) Forecast by Technology, 2019 to 2034

Table 23: Germany Industry Analysis and Outlook Value (US$ Million) Forecast by End-use, 2019 to 2034

Table 24: Germany Industry Analysis and Outlook Volume (Units) Forecast by End-use, 2019 to 2034

Table 25: Italy Industry Analysis and Outlook Value (US$ Million) Forecast By Region, 2019 to 2034

Table 26: Italy Industry Analysis and Outlook Volume (Units) Forecast By Region, 2019 to 2034

Table 27: Italy Industry Analysis and Outlook Value (US$ Million) Forecast by Product Type, 2019 to 2034

Table 28: Italy Industry Analysis and Outlook Volume (Units) Forecast by Product Type, 2019 to 2034

Table 29: Italy Industry Analysis and Outlook Value (US$ Million) Forecast by Technology, 2019 to 2034

Table 30: Italy Industry Analysis and Outlook Volume (Units) Forecast by Technology, 2019 to 2034

Table 31: Italy Industry Analysis and Outlook Value (US$ Million) Forecast by End-use, 2019 to 2034

Table 32: Italy Industry Analysis and Outlook Volume (Units) Forecast by End-use, 2019 to 2034

Table 33: France Industry Analysis and Outlook Value (US$ Million) Forecast By Region, 2019 to 2034

Table 34: France Industry Analysis and Outlook Volume (Units) Forecast By Region, 2019 to 2034

Table 35: France Industry Analysis and Outlook Value (US$ Million) Forecast by Product Type, 2019 to 2034

Table 36: France Industry Analysis and Outlook Volume (Units) Forecast by Product Type, 2019 to 2034

Table 37: France Industry Analysis and Outlook Value (US$ Million) Forecast by Technology, 2019 to 2034

Table 38: France Industry Analysis and Outlook Volume (Units) Forecast by Technology, 2019 to 2034

Table 39: France Industry Analysis and Outlook Value (US$ Million) Forecast by End-use, 2019 to 2034

Table 40: France Industry Analysis and Outlook Volume (Units) Forecast by End-use, 2019 to 2034

Table 41: Rest of Industry Analysis and Outlook Value (US$ Million) Forecast by Product Type, 2019 to 2034

Table 42: Rest of Industry Analysis and Outlook Volume (Units) Forecast by Product Type, 2019 to 2034

Table 43: Rest of Industry Analysis and Outlook Value (US$ Million) Forecast by Technology, 2019 to 2034

Table 44: Rest of Industry Analysis and Outlook Volume (Units) Forecast by Technology, 2019 to 2034

Table 45: Rest of Industry Analysis and Outlook Value (US$ Million) Forecast by End-use, 2019 to 2034

Table 46: Rest of Industry Analysis and Outlook Volume (Units) Forecast by End-use, 2019 to 2034

List of Figures

Figure 1: Industry Analysis and Outlook Value (US$ Million) by Product Type, 2024 to 2034

Figure 2: Industry Analysis and Outlook Value (US$ Million) by Technology, 2024 to 2034

Figure 3: Industry Analysis and Outlook Value (US$ Million) by End-use, 2024 to 2034

Figure 4: Industry Analysis and Outlook Value (US$ Million) by Country, 2024 to 2034

Figure 5: Industry Analysis and Outlook Value (US$ Million) Analysis by Country, 2019 to 2034

Figure 6: Industry Analysis and Outlook Volume (Units) Analysis by Country, 2019 to 2034

Figure 7: Industry Analysis and Outlook Value Share (%) and BPS Analysis by Country, 2024 to 2034

Figure 8: Industry Analysis and Outlook Y-o-Y Growth (%) Projections by Country, 2024 to 2034

Figure 9: Industry Analysis and Outlook Value (US$ Million) Analysis by Product Type, 2019 to 2034

Figure 10: Industry Analysis and Outlook Volume (Units) Analysis by Product Type, 2019 to 2034

Figure 11: Industry Analysis and Outlook Value Share (%) and BPS Analysis by Product Type, 2024 to 2034

Figure 12: Industry Analysis and Outlook Y-o-Y Growth (%) Projections by Product Type, 2024 to 2034

Figure 13: Industry Analysis and Outlook Value (US$ Million) Analysis by Technology, 2019 to 2034

Figure 14: Industry Analysis and Outlook Volume (Units) Analysis by Technology, 2019 to 2034

Figure 15: Industry Analysis and Outlook Value Share (%) and BPS Analysis by Technology, 2024 to 2034

Figure 16: Industry Analysis and Outlook Y-o-Y Growth (%) Projections by Technology, 2024 to 2034

Figure 17: Industry Analysis and Outlook Value (US$ Million) Analysis by End-use, 2019 to 2034

Figure 18: Industry Analysis and Outlook Volume (Units) Analysis by End-use, 2019 to 2034

Figure 19: Industry Analysis and Outlook Value Share (%) and BPS Analysis by End-use, 2024 to 2034

Figure 20: Industry Analysis and Outlook Y-o-Y Growth (%) Projections by End-use, 2024 to 2034

Figure 21: Industry Analysis and Outlook Attractiveness by Product Type, 2024 to 2034

Figure 22: Industry Analysis and Outlook Attractiveness by Technology, 2024 to 2034

Figure 23: Industry Analysis and Outlook Attractiveness by End-use, 2024 to 2034

Figure 24: Industry Analysis and Outlook Attractiveness by Region, 2024 to 2034

Figure 25: UK Industry Analysis and Outlook Value (US$ Million) by Product Type, 2024 to 2034

Figure 26: UK Industry Analysis and Outlook Value (US$ Million) by Technology, 2024 to 2034

Figure 27: UK Industry Analysis and Outlook Value (US$ Million) by End-use, 2024 to 2034

Figure 28: UK Industry Analysis and Outlook Value (US$ Million) By Region, 2024 to 2034

Figure 29: UK Industry Analysis and Outlook Value (US$ Million) Analysis By Region, 2019 to 2034

Figure 30: UK Industry Analysis and Outlook Volume (Units) Analysis By Region, 2019 to 2034

Figure 31: UK Industry Analysis and Outlook Value Share (%) and BPS Analysis By Region, 2024 to 2034

Figure 32: UK Industry Analysis and Outlook Y-o-Y Growth (%) Projections By Region, 2024 to 2034

Figure 33: UK Industry Analysis and Outlook Value (US$ Million) Analysis by Product Type, 2019 to 2034

Figure 34: UK Industry Analysis and Outlook Volume (Units) Analysis by Product Type, 2019 to 2034

Figure 35: UK Industry Analysis and Outlook Value Share (%) and BPS Analysis by Product Type, 2024 to 2034

Figure 36: UK Industry Analysis and Outlook Y-o-Y Growth (%) Projections by Product Type, 2024 to 2034

Figure 37: UK Industry Analysis and Outlook Value (US$ Million) Analysis by Technology, 2019 to 2034

Figure 38: UK Industry Analysis and Outlook Volume (Units) Analysis by Technology, 2019 to 2034

Figure 39: UK Industry Analysis and Outlook Value Share (%) and BPS Analysis by Technology, 2024 to 2034

Figure 40: UK Industry Analysis and Outlook Y-o-Y Growth (%) Projections by Technology, 2024 to 2034

Figure 41: UK Industry Analysis and Outlook Value (US$ Million) Analysis by End-use, 2019 to 2034

Figure 42: UK Industry Analysis and Outlook Volume (Units) Analysis by End-use, 2019 to 2034

Figure 43: UK Industry Analysis and Outlook Value Share (%) and BPS Analysis by End-use, 2024 to 2034

Figure 44: UK Industry Analysis and Outlook Y-o-Y Growth (%) Projections by End-use, 2024 to 2034

Figure 45: UK Industry Analysis and Outlook Attractiveness by Product Type, 2024 to 2034

Figure 46: UK Industry Analysis and Outlook Attractiveness by Technology, 2024 to 2034

Figure 47: UK Industry Analysis and Outlook Attractiveness by End-use, 2024 to 2034

Figure 48: UK Industry Analysis and Outlook Attractiveness By Region, 2024 to 2034

Figure 49: Germany Industry Analysis and Outlook Value (US$ Million) by Product Type, 2024 to 2034

Figure 50: Germany Industry Analysis and Outlook Value (US$ Million) by Technology, 2024 to 2034

Figure 51: Germany Industry Analysis and Outlook Value (US$ Million) by End-use, 2024 to 2034

Figure 52: Germany Industry Analysis and Outlook Value (US$ Million) By Region, 2024 to 2034

Figure 53: Germany Industry Analysis and Outlook Value (US$ Million) Analysis By Region, 2019 to 2034

Figure 54: Germany Industry Analysis and Outlook Volume (Units) Analysis By Region, 2019 to 2034

Figure 55: Germany Industry Analysis and Outlook Value Share (%) and BPS Analysis By Region, 2024 to 2034

Figure 56: Germany Industry Analysis and Outlook Y-o-Y Growth (%) Projections By Region, 2024 to 2034

Figure 57: Germany Industry Analysis and Outlook Value (US$ Million) Analysis by Product Type, 2019 to 2034

Figure 58: Germany Industry Analysis and Outlook Volume (Units) Analysis by Product Type, 2019 to 2034

Figure 59: Germany Industry Analysis and Outlook Value Share (%) and BPS Analysis by Product Type, 2024 to 2034

Figure 60: Germany Industry Analysis and Outlook Y-o-Y Growth (%) Projections by Product Type, 2024 to 2034

Figure 61: Germany Industry Analysis and Outlook Value (US$ Million) Analysis by Technology, 2019 to 2034

Figure 62: Germany Industry Analysis and Outlook Volume (Units) Analysis by Technology, 2019 to 2034

Figure 63: Germany Industry Analysis and Outlook Value Share (%) and BPS Analysis by Technology, 2024 to 2034

Figure 64: Germany Industry Analysis and Outlook Y-o-Y Growth (%) Projections by Technology, 2024 to 2034

Figure 65: Germany Industry Analysis and Outlook Value (US$ Million) Analysis by End-use, 2019 to 2034

Figure 66: Germany Industry Analysis and Outlook Volume (Units) Analysis by End-use, 2019 to 2034

Figure 67: Germany Industry Analysis and Outlook Value Share (%) and BPS Analysis by End-use, 2024 to 2034

Figure 68: Germany Industry Analysis and Outlook Y-o-Y Growth (%) Projections by End-use, 2024 to 2034

Figure 69: Germany Industry Analysis and Outlook Attractiveness by Product Type, 2024 to 2034

Figure 70: Germany Industry Analysis and Outlook Attractiveness by Technology, 2024 to 2034

Figure 71: Germany Industry Analysis and Outlook Attractiveness by End-use, 2024 to 2034

Figure 72: Germany Industry Analysis and Outlook Attractiveness By Region, 2024 to 2034

Figure 73: Italy Industry Analysis and Outlook Value (US$ Million) by Product Type, 2024 to 2034

Figure 74: Italy Industry Analysis and Outlook Value (US$ Million) by Technology, 2024 to 2034

Figure 75: Italy Industry Analysis and Outlook Value (US$ Million) by End-use, 2024 to 2034

Figure 76: Italy Industry Analysis and Outlook Value (US$ Million) By Region, 2024 to 2034

Figure 77: Italy Industry Analysis and Outlook Value (US$ Million) Analysis By Region, 2019 to 2034

Figure 78: Italy Industry Analysis and Outlook Volume (Units) Analysis By Region, 2019 to 2034

Figure 79: Italy Industry Analysis and Outlook Value Share (%) and BPS Analysis By Region, 2024 to 2034

Figure 80: Italy Industry Analysis and Outlook Y-o-Y Growth (%) Projections By Region, 2024 to 2034

Figure 81: Italy Industry Analysis and Outlook Value (US$ Million) Analysis by Product Type, 2019 to 2034

Figure 82: Italy Industry Analysis and Outlook Volume (Units) Analysis by Product Type, 2019 to 2034

Figure 83: Italy Industry Analysis and Outlook Value Share (%) and BPS Analysis by Product Type, 2024 to 2034

Figure 84: Italy Industry Analysis and Outlook Y-o-Y Growth (%) Projections by Product Type, 2024 to 2034

Figure 85: Italy Industry Analysis and Outlook Value (US$ Million) Analysis by Technology, 2019 to 2034

Figure 86: Italy Industry Analysis and Outlook Volume (Units) Analysis by Technology, 2019 to 2034

Figure 87: Italy Industry Analysis and Outlook Value Share (%) and BPS Analysis by Technology, 2024 to 2034

Figure 88: Italy Industry Analysis and Outlook Y-o-Y Growth (%) Projections by Technology, 2024 to 2034

Figure 89: Italy Industry Analysis and Outlook Value (US$ Million) Analysis by End-use, 2019 to 2034

Figure 90: Italy Industry Analysis and Outlook Volume (Units) Analysis by End-use, 2019 to 2034

Figure 91: Italy Industry Analysis and Outlook Value Share (%) and BPS Analysis by End-use, 2024 to 2034

Figure 92: Italy Industry Analysis and Outlook Y-o-Y Growth (%) Projections by End-use, 2024 to 2034

Figure 93: Italy Industry Analysis and Outlook Attractiveness by Product Type, 2024 to 2034

Figure 94: Italy Industry Analysis and Outlook Attractiveness by Technology, 2024 to 2034

Figure 95: Italy Industry Analysis and Outlook Attractiveness by End-use, 2024 to 2034

Figure 96: Italy Industry Analysis and Outlook Attractiveness By Region, 2024 to 2034

Figure 97: France Industry Analysis and Outlook Value (US$ Million) by Product Type, 2024 to 2034

Figure 98: France Industry Analysis and Outlook Value (US$ Million) by Technology, 2024 to 2034

Figure 99: France Industry Analysis and Outlook Value (US$ Million) by End-use, 2024 to 2034

Figure 100: France Industry Analysis and Outlook Value (US$ Million) By Region, 2024 to 2034

Figure 101: France Industry Analysis and Outlook Value (US$ Million) Analysis By Region, 2019 to 2034

Figure 102: France Industry Analysis and Outlook Volume (Units) Analysis By Region, 2019 to 2034

Figure 103: France Industry Analysis and Outlook Value Share (%) and BPS Analysis By Region, 2024 to 2034

Figure 104: France Industry Analysis and Outlook Y-o-Y Growth (%) Projections By Region, 2024 to 2034

Figure 105: France Industry Analysis and Outlook Value (US$ Million) Analysis by Product Type, 2019 to 2034

Figure 106: France Industry Analysis and Outlook Volume (Units) Analysis by Product Type, 2019 to 2034

Figure 107: France Industry Analysis and Outlook Value Share (%) and BPS Analysis by Product Type, 2024 to 2034

Figure 108: France Industry Analysis and Outlook Y-o-Y Growth (%) Projections by Product Type, 2024 to 2034

Figure 109: France Industry Analysis and Outlook Value (US$ Million) Analysis by Technology, 2019 to 2034

Figure 110: France Industry Analysis and Outlook Volume (Units) Analysis by Technology, 2019 to 2034

Figure 111: France Industry Analysis and Outlook Value Share (%) and BPS Analysis by Technology, 2024 to 2034

Figure 112: France Industry Analysis and Outlook Y-o-Y Growth (%) Projections by Technology, 2024 to 2034

Figure 113: France Industry Analysis and Outlook Value (US$ Million) Analysis by End-use, 2019 to 2034

Figure 114: France Industry Analysis and Outlook Volume (Units) Analysis by End-use, 2019 to 2034

Figure 115: France Industry Analysis and Outlook Value Share (%) and BPS Analysis by End-use, 2024 to 2034

Figure 116: France Industry Analysis and Outlook Y-o-Y Growth (%) Projections by End-use, 2024 to 2034

Figure 117: France Industry Analysis and Outlook Attractiveness by Product Type, 2024 to 2034

Figure 118: France Industry Analysis and Outlook Attractiveness by Technology, 2024 to 2034

Figure 119: France Industry Analysis and Outlook Attractiveness by End-use, 2024 to 2034

Figure 120: France Industry Analysis and Outlook Attractiveness By Region, 2024 to 2034

Figure 121: Spain Industry Analysis and Outlook Value (US$ Million) by Product Type, 2024 to 2034

Figure 122: Spain Industry Analysis and Outlook Value (US$ Million) by Technology, 2024 to 2034

Figure 123: Spain Industry Analysis and Outlook Value (US$ Million) by End-use, 2024 to 2034

Figure 124: Spain Industry Analysis and Outlook Value (US$ Million) By Region, 2024 to 2034

Figure 125: Spain Industry Analysis and Outlook Value (US$ Million) Analysis By Region, 2019 to 2034

Figure 126: Spain Industry Analysis and Outlook Volume (Units) Analysis By Region, 2019 to 2034

Figure 127: Spain Industry Analysis and Outlook Value Share (%) and BPS Analysis By Region, 2024 to 2034

Figure 128: Spain Industry Analysis and Outlook Y-o-Y Growth (%) Projections By Region, 2024 to 2034

Figure 129: Spain Industry Analysis and Outlook Value (US$ Million) Analysis by Product Type, 2019 to 2034

Figure 130: Spain Industry Analysis and Outlook Volume (Units) Analysis by Product Type, 2019 to 2034

Figure 131: Spain Industry Analysis and Outlook Value Share (%) and BPS Analysis by Product Type, 2024 to 2034

Figure 132: Spain Industry Analysis and Outlook Y-o-Y Growth (%) Projections by Product Type, 2024 to 2034

Figure 133: Spain Industry Analysis and Outlook Value (US$ Million) Analysis by Technology, 2019 to 2034

Figure 134: Spain Industry Analysis and Outlook Volume (Units) Analysis by Technology, 2019 to 2034

Figure 135: Spain Industry Analysis and Outlook Value Share (%) and BPS Analysis by Technology, 2024 to 2034

Figure 136: Spain Industry Analysis and Outlook Y-o-Y Growth (%) Projections by Technology, 2024 to 2034

Figure 137: Spain Industry Analysis and Outlook Value (US$ Million) Analysis by End-use, 2019 to 2034

Figure 138: Spain Industry Analysis and Outlook Volume (Units) Analysis by End-use, 2019 to 2034

Figure 139: Spain Industry Analysis and Outlook Value Share (%) and BPS Analysis by End-use, 2024 to 2034

Figure 140: Spain Industry Analysis and Outlook Y-o-Y Growth (%) Projections by End-use, 2024 to 2034

Figure 141: Spain Industry Analysis and Outlook Attractiveness by Product Type, 2024 to 2034

Figure 142: Spain Industry Analysis and Outlook Attractiveness by Technology, 2024 to 2034

Figure 143: Spain Industry Analysis and Outlook Attractiveness by End-use, 2024 to 2034

Figure 144: Spain Industry Analysis and Outlook Attractiveness By Region, 2024 to 2034

Figure 145: Rest of Industry Analysis and Outlook Value (US$ Million) by Product Type, 2024 to 2034

Figure 146: Rest of Industry Analysis and Outlook Value (US$ Million) by Technology, 2024 to 2034

Figure 147: Rest of Industry Analysis and Outlook Value (US$ Million) by End-use, 2024 to 2034

Figure 148: Rest of Industry Analysis and Outlook Value (US$ Million) Analysis by Product Type, 2019 to 2034

Figure 149: Rest of Industry Analysis and Outlook Volume (Units) Analysis by Product Type, 2019 to 2034

Figure 150: Rest of Industry Analysis and Outlook Value Share (%) and BPS Analysis by Product Type, 2024 to 2034

Figure 151: Rest of Industry Analysis and Outlook Y-o-Y Growth (%) Projections by Product Type, 2024 to 2034

Figure 152: Rest of Industry Analysis and Outlook Value (US$ Million) Analysis by Technology, 2019 to 2034

Figure 153: Rest of Industry Analysis and Outlook Volume (Units) Analysis by Technology, 2019 to 2034

Figure 154: Rest of Industry Analysis and Outlook Value Share (%) and BPS Analysis by Technology, 2024 to 2034

Figure 155: Rest of Industry Analysis and Outlook Y-o-Y Growth (%) Projections by Technology, 2024 to 2034

Figure 156: Rest of Industry Analysis and Outlook Value (US$ Million) Analysis by End-use, 2019 to 2034

Figure 157: Rest of Industry Analysis and Outlook Volume (Units) Analysis by End-use, 2019 to 2034

Figure 158: Rest of Industry Analysis and Outlook Value Share (%) and BPS Analysis by End-use, 2024 to 2034

Figure 159: Rest of Industry Analysis and Outlook Y-o-Y Growth (%) Projections by End-use, 2024 to 2034

Figure 160: Rest of Industry Analysis and Outlook Attractiveness by Product Type, 2024 to 2034

Figure 161: Rest of Industry Analysis and Outlook Attractiveness by Technology, 2024 to 2034

Figure 162: Rest of Industry Analysis and Outlook Attractiveness by End-use, 2024 to 2034

Frequently Asked Questions

What is the forecasted value for the Western Europe Tape Dispenser Landscape in 2024?

The tape dispenser industry in Western Europe is poised to be valued at USD 934.4 million in 2024.

At what Rate is the tape dispenser industry growing in Western Europe?

The anticipated CAGR for tape dispensers through 2034 is 4.0%.

How big will be the tape dispenser industry in Western Europe?

Demand for tape dispensers in Western Europe will be USD 1,385.50 million by 2034.

Which product segment drives the tape dispenser in Western Europe?

Tabletop tape dispensers remain the top segment in Western Europe.

Explore Packaging Consumables and Supplies Insights

Future Market Insights

Tape Dispenser Industry Analysis in Western Europe