This site uses cookies, including third-party cookies, that help us to provide and improve our services.

Privacy Policy
- Global Locations -
Headquarters
Future Market Insights, Inc.
Christiana Corporate, 200 Continental Drive, Suite 401, Newark, Delaware - 19713, United States
T: +1-845-579-5705
MEA
Market Access DMCC

1602-6 Jumeirah Bay X2 Tower, Plot No: JLT-PH2-X2A,

Jumeirah Lakes Towers, Dubai,

United Arab Emirates

Americas
Future Market Insights
616 Corporate Way, Suite 2-9018,
Valley Cottage, NY 10989,
United States
T: +1-347-918-3531
Europe
Future Market Insights
3rd Floor, 207 Regent Street,
London W1B 3HH
United Kingdom
T: + 44 (0) 20 8123 9659
D: +44 (0) 20 3287 4268
APAC
Future Market Insights
Office No. 401-A, 4th Floor,
VANTAGE 9, S.No. 36/1/1,
Baner, Pune 411045 India

Data Business in Oil & Gas Market

Market Insights on Data Business in Oil & Gas covering sales outlook, demand forecast & up-to-date key trends

Data Business in Oil & Gas Market By Component, Oil Companies, Application, E&P Lifecycle & Region | Forecast 2022 to 2032

Data Business in Oil & Gas Market Outlook (2022 to 2032)

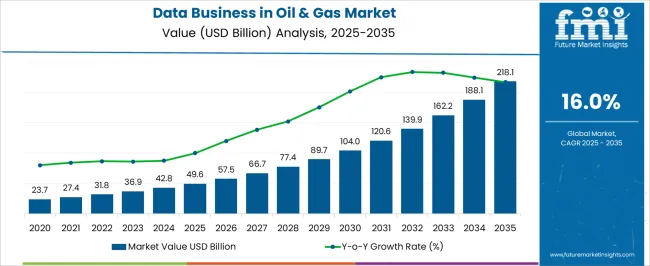
The data business in oil & gas market is projected to register a CAGR of 16.5% during the forecast period (2022 to 2032). The data business in oil & gas market is likely to be valued at US$ 31.6 Billion in 2022 and is projected to reach US$ 145.9 Billion by 2032.

Oil and gas companies have been able to operate efficiently in a low-cost environment by implementing and utilizing real-time analytics and predictive analytics systems. This has allowed them to focus on operating costs and capital expenditure.

The rise in popularity of real-time analysis and predictive analytics solutions, and the spike in the number of cyber-attacks and data breaches are among the key factors driving the data business in oil & gas market growth.

Attributes

Details

Data Business in Oil & Gas Market CAGR (2022 to 2032)

16.5%

Data Business in Oil & Gas Market Value/Volume (2022)

US$ 31.6 Billion

Data Business in Oil & Gas Market Value/Volume (2032)

US$ 145.9 Billion

Don't pay for what you don't need

Customize your report by selecting specific countries or regions and save 30%!

What is COVID-19 Impact on the Data Business in Oil & Gas Market?

COVID-19 had a positive impact on the data business in oil & gas market. Due to production cuts, oil prices fell, and demand for chemicals and refined goods also declined as a result of industrial slowdowns and travel restrictions in the aftermath of the global epidemic. Furthermore, cloud computing and virtualization have proven to be major factors increasing the adoption of data business in oil & gas industry.

Due to COVID-19, there is increased demand for data business in oil & gas market. The deployment of data collection equipment such as sensors at various remote sites and operational fields has resulted in a tremendous increase in the adoption of data generation in oil and gas.

The demand for data business in oil & gas market has grown as a result of greater digitization, the adoption of workplace mobility solutions, and real-time workforce assistance.

As a result of the adoption of data business in oil & gas industry, industry spending on efficient server, networking, and storage systems is expected to rise in order to expedite business operations and improve overall efficiency.

What are the Key Dynamics Governing the Growth of the Data Business in Oil & Gas Market?

In the data business in oil & gas market, big data refers to a vast volume of data generated at a high rate in a variety of formats, including structured and unstructured data generated by various operations and financial activities.

The demand for data business in oil & gas market is anticipated to rise as by using diverse analytical tools and approaches, big data is used to generate useful information for better decision making.

A major factor propelling the adoption of data business in oil & gas industry includes the ability of big data to make more efficient and better judgments, which can lead to enhanced operational efficiency, reduced risk, and cost savings. Oil and gas companies can move away from traditional real-time monitoring and toward faster real-time predictions with the best technology solutions.

The adoption of data business in oil & gas industry is rapidly expanding. This growth can be attributed to factors such as a greater reliance on information technology to increase oilfield recovery and reduce non-productive activities.

The demand for data business in oil & gas market is rising due to technological advancements and innovations, increased research and development, and the introduction of new products in this field to improve data management efficiency.

Several new oil and gas companies are entering the global market to provide niche solutions at competitive prices, which is expected to accelerate data business in oil & gas market growth.

However, certain factors are limiting the growth of the global data business in oil & gas market.

They include a lack of understanding of the benefits of adoption of data business in oil & gas industry, a high initial investment required to implement a data management solution, an increasing level of challenges arising from the growing volume and velocity of data, and the high time, costs, and risks associated with managing and moving data.

To close the gap between supply and demand, oil exploration companies are looking for oilfields in remote and harsh environments.

Most oil and gas companies are following the trend of exploitation of offshore deep-water reserves and developing unconventional reserves. To optimize performance and maintain safety standards, this is anticipated to boost the demand for data business in oil & gas market, IT infrastructure, data analysis, and consultation services.

A significant drop in the oil price index has an impact on companies' return on investment (ROI), resulting in a continuous reduction in headcount and capital expenditure. As a result, the demand for effective and efficient use of large amounts of data to make technical decisions has grown.

Due to this, the demand for data business in oil & gas market. Furthermore, as pervasive computing devices, advanced storage capabilities, and new analytic tools become more widely adopted, market players are likely to have new opportunities.

Oil and gas producers can now obtain real-time data from previously inaccessible areas at lower costs in order to improve the performance of their oil fields and plants. For example, major players combine nearby good production with real-time down-hole drilling data to help them adapt their drilling strategy, particularly in unconventional fields.

As a result of these factors, the adoption of the data business in oil & gas industry is anticipated to grow rapidly during the forecast period.

Sudip Saha
Sudip Saha
Principal Consultant
LinkedIn
Talk to Analyst

Find your sweet spots for generating winning opportunities in this market.

Talk to Analyst

Comparative View of Adjacent Data Business in Oil & Gas Market

Data Business in Oil & Gas Market:

Attributes

Data Business in Oil & Gas Market

CAGR (2022 to 2032)

16.5%

Market Value (2026)

US$ 49.5 Billion

Growth Factor

The rise in the adoption of enterprise mobility solutions and an increase in digitization are two major growth factors

Opportunity

Market players are likely to have new opportunities as pervasive computing devices, advanced storage capabilities, and new analytic tools become more widely adopted.

Key Trends

To improve the performance of their oil fields and plants, oil and gas producers can now obtain real-time data from previously inaccessible areas at lower costs.

Big Data in Oil and Gas Market:

Attributes

Big Data in Oil and Gas Market

CAGR (2022 to 2032)

19%

Market Value (2026)

US$ 45.81 Billion

Growth Factor

Rising production and drilling performance for the oil and gas industry.

Opportunity

Oil and gas companies can move away from traditional real-time monitoring and toward more rapid real-time predictions with the right technology solutions.

Key Trends

It is widely utilized to improve decision-making and operational and business performance

Oil and Gas Data Management:

Attributes

Oil and Gas Data Management

CAGR (2022 to 2032)

25%

Market Value (2026)

US$ 79.32 Billion

Growth Factor

Technological advancements and innovations, increased research and development, and the launch of new products to improve data management efficiency

Opportunity

In the global market, several new companies are providing niche solutions at competitive prices, which is expected to accelerate market growth.

Key Trends

The increasing trend of companies adopting modern technologies and solutions throughout the value chain is helping them meet the highest operational efficiency targets set by oil and gas companies.

Data management software for oil and gas companies is a type of advanced software that helps them manage and protect their data. Such companies' projects are complex in terms of operations, resource management, capital management, inventory management, and so on. The adoption of data business in oil & gas industry aids businesses in maximizing resources, tracking project progress, and increasing efficiency.

The demand for data business in oil & gas is rising as it enables businesses to effectively manage and access their data in real-time.

Regulatory compliance management tools, data analytics, data warehousing, and other features, such as process design control, are all being integrated into data management software by a number of software development providers and vendors. Furthermore, increased adoption of data business in oil & gas industry with IoT and AI is expected to boost large-scale data management software implementation by small and large enterprises in the oil and gas industry.

Data management as a service is gaining traction in the oil and gas industry, thanks to the rising adoption of data business in oil & gas industry, next-generation data center evolution, and cost-effective and flexible data management solutions.

What is the Segmentation Outlook for the Data Business in Oil & Gas Market?

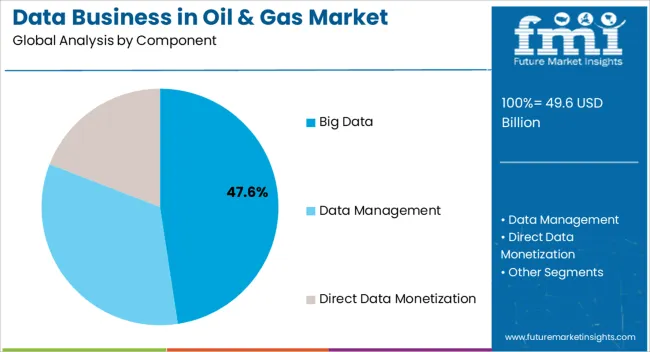
On the basis of components, the data management segment is anticipated to dominate the data business in oil & gas market with a CAGR of 16.8% during the forecast period. The data management segment is expected to be driven by the rising trend of cloud adoption in the coming years.

Data breaches are becoming more common around the world, necessitating the modernization of existing enterprise infrastructure. As a result, global enterprise data management infrastructure modernization is expected to boost the demand for data business in oil & gas market in the near future.

The lack of complete data security assurance and misuse of collected data are stifling the adoption of data business in oil & gas industry in both international and domestic markets.

Get the data you need at a Fraction of the cost

Personalize your report by choosing insights you need
and save 40%!

Which Segment is likely to Lead the Data Business in Oil & Gas Market by Application?

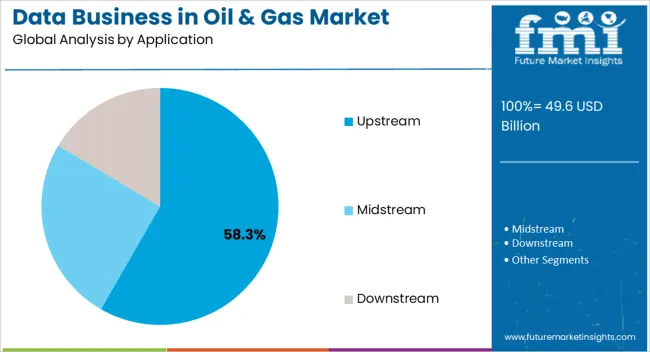
Based on the application, the upstream segment is anticipated to dominate the data business in oil & gas market with a CAGR of 16.9%. The demand for data business in oil & gas market is rising due to various services and maintenance activities requiring data analysis in various natural gas and oil-producing companies.

What is the Regional Analysis for the Data Business in Oil & Gas Market

Regions

CAGR (2022 to 2032)

USA Market

16.2%

United Kingdom Market

17.1%

China Market

18.0%

Japan Market

18.7%

India Market

18.4%

Due to an increase in production and drilling activities in the oil and gas sector, the North American region is expected to dominate the data business in oil & gas market, accounting for US$ 40.9 Billion with a CAGR of 16.2% during the forecast period.

Europe, followed by the Asia Pacific, is expected to see increased demand over the forecast period as a result of increased focus on operational efficiency and increased usage and is likely to dominate the market in the near future.

Over the forecast period, Asia Pacific is expected to see healthy growth in countries such as India and China, which are expected to switch to big data for making any kind of strategic decisions, as well as growth opportunities in other Asia Pacific countries.

India’s data business in oil & gas market is anticipated to grow at a CAGR of 18.4%, while China’s data business in oil & gas market is projected to grow at a CAGR of 18%. The above-mentioned factors are anticipated to drive the demand for data business in oil & gas market growth.

The data business in oil & gas market in Latin America, the Middle East, and Africa are ripe for expansion. This is due to an increase in oil production, which has been accompanied by increased drilling activity in countries such as Saudi Arabia, Iran, and Israel, which are expected to dominate the data business in oil & gas market.

How is the Competition in the Data Business in Oil & Gas Market?

The key strategy used by industry players to achieve growth in the data business in oil & gas market is new product launches. This growth strategy accounted for 42.86 percent of all market players' growth strategies.

Market players are concentrating their efforts on expanding into new markets by launching technologically advanced and innovative oil and gas data management solutions and services in both established and emerging markets. The major companies that have adopted this strategy are those that have developed innovative solutions for business needs.

Recent Developments in the Data Business in Oil & Gas Market

  • Quantzig, a global data analytics and advisory firm, will launch actionable analytics solutions to solve complex business problems in March 2020. The company has announced that its advanced big data analytics services for the oil and gas industry can assist businesses in developing effective strategies to target potential markets and reduce the risks associated with oil exploration and drilling.
  • In September 2019, researchers in the North Sea oil and gas industry used artificial intelligence (AI) to help unlock a treasure trove of big data in a new project. The University of Aberdeen researchers wanted to close the gap between the vast amounts of big data available to the oil and gas industry. The Oil & Gas Innovation Centre (OGIC), software research and development company HyperDAP, and Scotland's data and AI innovation center, The Data Lab, co-founded the project.

Key Players

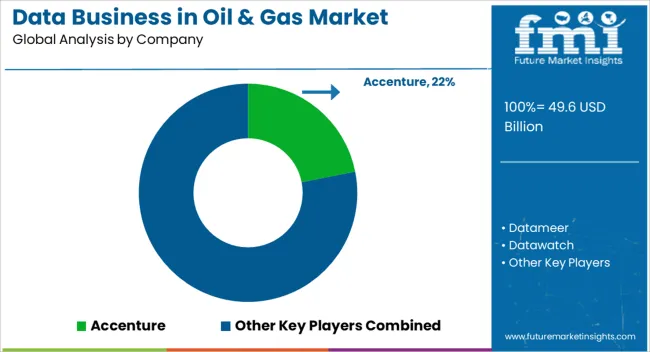
  • Accenture
  • Datameer
  • Datawatch
  • General Electric
  • Hitachi Vantara Corporation

Key Segments

By Component:

  • Big Data
  • Data Management
  • Direct Data Monetization

By Oil Companies:

  • National Oil Companies
  • Independent Oil Companies
  • National Data Repository

By Application:

  • Upstream
  • Midstream
  • Downstream

By E&P Lifecycle:

  • Exploration
  • Development
  • Production

By Region:

  • North America
  • Europe
  • Asia-Pacific
  • Middle East & Africa
  • Latin America

Frequently Asked Questions

The data business in oil & gas market is anticipated to record a CAGR of 16.5% during the forecast period (2022 to 2032).

North America region is expected to dominate the data business in oil & gas market.

On the basis of components, the data management segment is anticipated to dominate the data business in oil & gas market.

The data business in oil & gas market is likely to be valued at US$ 145.9 Billion by 2032.

Asia Pacific is expected to witness healthy growth potential.

Table of Content

1. Preface | Data Business in Oil & Gas Market

    1.1. Market Scope

    1.2. Market Segmentation

    1.3. Key Research Objectives

2. Assumptions and Research Methodology

    2.1. Research Methodology

        2.1.1. List of Primary and Secondary Sources

    2.2. Key Assumptions for Data Modeling

3. Executive Summary: Global Market

4. Market Overview

    4.1. Introduction

    4.2. Global Market – Macro Economic Factors Overview

        4.2.1. World GDP Indicator – For Top 20 Economies

        4.2.2. Global ICT Spending (US$ Million), 2016 to 2032

    4.3. Regulations and Policies by Region

    4.4. Technology/Product Roadmap

    4.5. Porter’s Five Forces Analysis

    4.6. PESTEL Analysis

    4.7. Ecosystem Analysis

    4.8. Key Market Indicators

    4.9. Market Dynamics (Growth Influencers)

        4.9.1. Drivers

        4.9.2. Restraints

        4.9.3. Opportunities

        4.9.4. Impact Analysis of Drivers & Restraints

        4.9.5. Key Trends

    4.10. Spending Analysis (2021)

        4.10.1. IT spending analysis for Oil & Gas Industry

        4.10.2. IT Spending, by Type (US$ Million)

            4.10.2.1. Hardware

            4.10.2.2. Software/Platform

            4.10.2.3. Services

    4.11. Global Market Analysis and Forecast, 2022 to 2032

        4.11.1. Market Revenue Analysis (US$ Million)

            4.11.1.1. Historic growth trends, 2016 to 2032

            4.11.1.2. Forecast trends, 2021 to 2032

    4.12. Market Outlook

    4.13. Competitive Scenario and Trends

        4.13.1. List of New Entrants 

        4.13.2. Mergers & Acquisitions, Expansions

5. Global Market Analysis and Forecast, by Component

    5.1. Overview & Definitions 

    5.2. Market Size (US$ Million) Forecast, by Component, 2022 to 2032

        5.2.1. Big Data

            5.2.1.1. Software

                5.2.1.1.1. Data Analytics

                5.2.1.1.2. Data Collection

                5.2.1.1.3. Data Discovery and Visualization

                5.2.1.1.4. Data Management

            5.2.1.2. Services

                5.2.1.2.1. Consulting 

                5.2.1.2.2. System Integration

                5.2.1.2.3. Operation and Maintenance

        5.2.2. Data Management

            5.2.2.1. Software

                5.2.2.1.1. Corporate/Enterprise Data Management

                5.2.2.1.2. Project Data Management

                5.2.2.1.3. National Data Repository

            5.2.2.2. Services

                5.2.2.2.1. Consulting  & Planning

                5.2.2.2.2. Integration& Implementation

                5.2.2.2.3. Operation & Maintenance

        5.2.3. Direct Data Monetization

    5.3. Component Market Value Share

    5.4. Market Attractiveness Analysis by Component

6. Global Market Analysis and Forecast, by Oil Companies

    6.1. Overview & Definitions

    6.2. Market Size (US$ Million) Forecast, by Oil Companies, 2022 to 2032

        6.2.1. National Oil Companies

        6.2.2. Independent Oil Companies

        6.2.3. National Data Repository

    6.3. Oil Companies Market Value Share

    6.4. Market Attractiveness Analysis by Oil Companies

7. Global Market Analysis and Forecast, by Application

    7.1. Overview & Definitions 

    7.2. Market Size (US$ Million) Forecast, by Application, 2022 to 2032

        7.2.1. Upstream

            7.2.1.1. Conventional

            7.2.1.2. Unconventional

        7.2.2. Midstream

        7.2.3. Downstream

    7.3. Application Market Value Share

    7.4. Market Attractiveness Analysis by Application

8. Global Upstream Market Analysis and Forecast, by E&P Lifecycle

    8.1. Overview & Definitions 

    8.2. Upstream Market Size (US$ Million) Forecast, by E&P Lifecycle, 2022 to 2032

        8.2.1. Exploration 

        8.2.2. Development 

        8.2.3. Production

    8.3. E&P Lifecycle Market Value Share

    8.4. Market Attractiveness Analysis by E&P Lifecycle

9. Global Market Analysis and Forecast, by Region

    9.1. Key Findings

    9.2. Market Size (US$ Million) Forecast, by Region, 2022 to 2032

        9.2.1. North America

        9.2.2. Europe

        9.2.3. Asia Pacific

        9.2.4. Middle East & Africa

        9.2.5. South America

    9.3. Region Market Value Share

10. North America Market  Analysis and Forecast

    10.1. Key Findings

    10.2. Market Size (US$ Million) Forecast, by Component, 2022 to 2032

        10.2.1. Big Data

            10.2.1.1. Software

                10.2.1.1.1. Data Analytics

                10.2.1.1.2. Data Collection

                10.2.1.1.3. Data Discovery and Visualization

                10.2.1.1.4. Data Management

            10.2.1.2. Services

                10.2.1.2.1. Consulting 

                10.2.1.2.2. System Integration

                10.2.1.2.3. Operation and Maintenance

        10.2.2. Data Management

            10.2.2.1. Software

                10.2.2.1.1. Corporate/Enterprise Data Management

                10.2.2.1.2. Project Data Management

                10.2.2.1.3. National Data Repository

            10.2.2.2. Services

                10.2.2.2.1. Consulting  & Planning

                10.2.2.2.2. Integration & Implementation

                10.2.2.2.3. Operation & Maintenance

        10.2.3. Direct Data Monetization

    10.3. Market Size (US$ Million) Forecast, by Oil Companies, 2022 to 2032

        10.3.1. National Oil Companies

        10.3.2. Independent Oil Companies

        10.3.3. National Data Repository

    10.4. Market Size (US$ Million) Forecast, by Application, 2022 to 2032

        10.4.1. Upstream

            10.4.1.1. Conventional

            10.4.1.2. Unconventional

        10.4.2. Midstream

        10.4.3. Downstream

    10.5. Upstream Market Size (US$ Million) Forecast, by E&P Lifecycle, 2022 to 2032

        10.5.1. Exploration 

        10.5.2. Development 

        10.5.3. Production

    10.6. Market Size (US$ Million) Forecast, by Country, 2022 to 2032

        10.6.1. The USA

        10.6.2. Canada

        10.6.3. Rest of North America

    10.7. Market Attractiveness Analysis 

        10.7.1. by Component

        10.7.2. by Oil Companies

        10.7.3. by Application

        10.7.4. by E&P Lifecycle

        10.7.5. by Country

11. Europe Market Analysis and Forecast

    11.1. Key Findings

    11.2. Market Size (US$ Million) Forecast, by Component, 2022 to 2032

        11.2.1. Big Data

            11.2.1.1. Software

                11.2.1.1.1. Data Analytics

                11.2.1.1.2. Data Collection

                11.2.1.1.3. Data Discovery and Visualization

                11.2.1.1.4. Data Management

            11.2.1.2. Services

                11.2.1.2.1. Consulting 

                11.2.1.2.2. System Integration

                11.2.1.2.3. Operation and Maintenance

        11.2.2. Data Management

            11.2.2.1. Software

                11.2.2.1.1. Corporate/Enterprise Data Management

                11.2.2.1.2. Project Data Management

                11.2.2.1.3. National Data Repository

            11.2.2.2. Services

                11.2.2.2.1. Consulting  & Planning

                11.2.2.2.2. Integration & Implementation

                11.2.2.2.3. Operation & Maintenance

        11.2.3. Direct Data Monetization

    11.3. Market Size (US$ Million) Forecast, by Oil Companies, 2022 to 2032

        11.3.1. National Oil Companies

        11.3.2. Independent Oil Companies

        11.3.3. National Data Repository

    11.4. Market Size (US$ Million) Forecast, by Application, 2022 to 2032

        11.4.1. Upstream

            11.4.1.1. Conventional

            11.4.1.2. Unconventional

        11.4.2. Midstream

        11.4.3. Downstream

    11.5. Upstream Market Size (US$ Million) Forecast, by E&P Lifecycle, 2022 to 2032

        11.5.1. Exploration 

        11.5.2. Development 

        11.5.3. Production

    11.6. Market Size (US$ Million) Forecast, by Country, 2022 to 2032

        11.6.1. Germany

        11.6.2. France

        11.6.3. United Kingdom

        11.6.4. Rest of Europe

    11.7. Market Attractiveness Analysis 

        11.7.1. by Component

        11.7.2. by Oil Companies

        11.7.3. by Application

        11.7.4. by E&P Lifecycle

        11.7.5. by Country

12. Asia Pacific Market Analysis and Forecast

    12.1. Key Findings

    12.2. Market Size (US$ Million) Forecast, by Component, 2022 to 2032

        12.2.1. Big Data

            12.2.1.1. Software

                12.2.1.1.1. Data Analytics

                12.2.1.1.2. Data Collection

                12.2.1.1.3. Data Discovery and Visualization

                12.2.1.1.4. Data Management

            12.2.1.2. Services

                12.2.1.2.1. Consulting 

                12.2.1.2.2. System Integration

                12.2.1.2.3. Operation and Maintenance

        12.2.2. Data Management

            12.2.2.1. Software

                12.2.2.1.1. Corporate/Enterprise Data Management

                12.2.2.1.2. Project Data Management

                12.2.2.1.3. National Data Repository

            12.2.2.2. Services

                12.2.2.2.1. Consulting  & Planning

                12.2.2.2.2. Integration & Implementation

                12.2.2.2.3. Operation & Maintenance

        12.2.3. Direct Data Monetization

    12.3. Market Size (US$ Million) Forecast, by Oil Companies, 2022 to 2032

        12.3.1. National Oil Companies

        12.3.2. Independent Oil Companies

        12.3.3. National Data Repository

    12.4. Market Size (US$ Million) Forecast, by Application, 2022 to 2032

        12.4.1. Upstream

            12.4.1.1. Conventional

            12.4.1.2. Unconventional

        12.4.2. Midstream

        12.4.3. Downstream

    12.5. Upstream Market Size (US$ Million) Forecast, by E&P Lifecycle, 2022 to 2032

        12.5.1. Exploration 

        12.5.2. Development 

        12.5.3. Production

    12.6. Market Size (US$ Million) Forecast, by Country, 2022 to 2032

        12.6.1. China

        12.6.2. Japan

        12.6.3. India

        12.6.4. Rest of Asia Pacific

    12.7. Market Attractiveness Analysis 

        12.7.1. by Component

        12.7.2. by Oil Companies

        12.7.3. by Application

        12.7.4. by E&P Lifecycle

        12.7.5. by Country

13. Middle East & Africa (MEA) Market Analysis and Forecast

    13.1. Key Findings

    13.2. Market Size (US$ Million) Forecast, by Component, 2022 to 2032

        13.2.1. Big Data

            13.2.1.1. Software

                13.2.1.1.1. Data Analytics

                13.2.1.1.2. Data Collection

                13.2.1.1.3. Data Discovery and Visualization

                13.2.1.1.4. Data Management

            13.2.1.2. Services

                13.2.1.2.1. Consulting 

                13.2.1.2.2. System Integration

                13.2.1.2.3. Operation and Maintenance

        13.2.2. Data Management

            13.2.2.1. Software

                13.2.2.1.1. Corporate/Enterprise Data Management

                13.2.2.1.2. Project Data Management

                13.2.2.1.3. National Data Repository

            13.2.2.2. Services

                13.2.2.2.1. Consulting  & Planning

                13.2.2.2.2. Integration & Implementation

                13.2.2.2.3. Operation & Maintenance

        13.2.3. Direct Data Monetization

    13.3. Market Size (US$ Million) Forecast, by Oil Companies, 2022 to 2032

        13.3.1. National Oil Companies

        13.3.2. Independent Oil Companies

        13.3.3. National Data Repository

    13.4. Market Size (US$ Million) Forecast, by Application, 2022 to 2032

        13.4.1. Upstream

            13.4.1.1. Conventional

            13.4.1.2. Unconventional

        13.4.2. Midstream

        13.4.3. Downstream

    13.5. Upstream Market Size (US$ Million) Forecast, by E&P Lifecycle, 2022 to 2032

        13.5.1. Exploration 

        13.5.2. Development

        13.5.3. Production

    13.6. Market Size (US$ Million) Forecast, by Country, 2022 to 2032

        13.6.1. GCC Countries

        13.6.2. South Africa

        13.6.3. Rest of Middle East and Africa(MEA)

    13.7. Market Attractiveness Analysis 

        13.7.1. by Component

        13.7.2. by Oil Companies

        13.7.3. by Application

        13.7.4. by E&P Lifecycle

        13.7.5. by Country

14. South America Market  Analysis and Forecast

    14.1. Key Findings

    14.2. Market Size (US$ Million) Forecast, by Component, 2022 to 2032

        14.2.1. Big Data

            14.2.1.1. Software

                14.2.1.1.1. Data Analytics

                14.2.1.1.2. Data Collection

                14.2.1.1.3. Data Discovery and Visualization

                14.2.1.1.4. Data Management

            14.2.1.2. Services

                14.2.1.2.1. Consulting 

                14.2.1.2.2. System Integration

                14.2.1.2.3. Operation and Maintenance

        14.2.2. Data Management

            14.2.2.1. Software

                14.2.2.1.1. Corporate/Enterprise Data Management

                14.2.2.1.2. Project Data Management

                14.2.2.1.3. National Data Repository

            14.2.2.2. Services

                14.2.2.2.1. Consulting  & Planning

                14.2.2.2.2. Integration & Implementation

                14.2.2.2.3. Operation & Maintenance

        14.2.3. Direct Data Monetization

    14.3. Market Size (US$ Million) Forecast, by Oil Companies, 2022 to 2032

        14.3.1. National Oil Companies

        14.3.2. Independent Oil Companies

        14.3.3. National Data Repository

    14.4. Market Size (US$ Million) Forecast, by Application, 2022 to 2032

        14.4.1. Upstream

            14.4.1.1. Conventional

            14.4.1.2. Unconventional

        14.4.2. Midstream

        14.4.3. Downstream

    14.5. Upstream Market Size (US$ Million) Forecast, by E&P Lifecycle, 2022 to 2032

        14.5.1. Exploration 

        14.5.2. Development 

        14.5.3. Production

    14.6. Market Size (US$ Million) Forecast, by Country, 2022 to 2032

        14.6.1. Brazil

        14.6.2. Rest of South America

    14.7. Market Attractiveness Analysis 

        14.7.1. by Component

        14.7.2. by Oil Companies

        14.7.3. by Application

        14.7.4. by E&P Lifecycle

        14.7.5. by Country

15. Competition Landscape

    15.1. Market Player - Competition Matrix

    15.2. Market Share Analysis by Company (2021)

    15.3. Big Data Company Profiles 

        15.3.1. Accenture

            15.3.1.1. Overview

            15.3.1.2. Key Competitors

            15.3.1.3. Financial Overview

            15.3.1.4. Strategy

            15.3.1.5. Recent Developments

        15.3.2. Datameer

            15.3.2.1. Overview

            15.3.2.2. Key Competitors

            15.3.2.3. Financial Overview

            15.3.2.4. Strategy

            15.3.2.5. Recent Developments

        15.3.3. Datawatch

            15.3.3.1. Overview

            15.3.3.2. Key Competitors

            15.3.3.3. Financial Overview

            15.3.3.4. Strategy

            15.3.3.5. Recent Developments

        15.3.4. Enverus

            15.3.4.1. Overview

            15.3.4.2. Key Competitors

            15.3.4.3. Financial Overview

            15.3.4.4. Strategy

            15.3.4.5. Recent Developments  

        15.3.5. General Electric

            15.3.5.1. Overview

            15.3.5.2. Key Competitors

            15.3.5.3. Financial Overview

            15.3.5.4. Strategy

            15.3.5.5. Recent Developments

        15.3.6. Hitachi Vantara Corporation

            15.3.6.1. Overview

            15.3.6.2. Key Competitors

            15.3.6.3. Financial Overview

            15.3.6.4. Strategy

            15.3.6.5. Recent Developments

        15.3.7. International Business Machines Corporation  

            15.3.7.1. Overview

            15.3.7.2. Key Competitors

            15.3.7.3. Financial Overview

            15.3.7.4. Strategy

            15.3.7.5. Recent Developments  

        15.3.8. Hewlett Packard Enterprise (HPE)

            15.3.8.1. Overview

            15.3.8.2. Key Competitors

            15.3.8.3. Financial Overview

            15.3.8.4. Strategy

            15.3.8.5. Recent Developments

        15.3.9. Microsoft Corporation  

            15.3.9.1. Overview

            15.3.9.2. Key Competitors

            15.3.9.3. Financial Overview

            15.3.9.4. Strategy

            15.3.9.5. Recent Developments

        15.3.10. Northwest Analytics Inc.

            15.3.10.1. Overview

            15.3.10.2. Key Competitors

            15.3.10.3. Financial Overview

            15.3.10.4. Strategy

            15.3.10.5. Recent Developments 

        15.3.11. Oracle Corporation

            15.3.11.1. Overview

            15.3.11.2. Key Competitors

            15.3.11.3. Financial Overview

            15.3.11.4. Strategy

            15.3.11.5. Recent Developments

        15.3.12. OSI Soft

            15.3.12.1. Overview

            15.3.12.2. Key Competitors

            15.3.12.3. Financial Overview

            15.3.12.4. Strategy

            15.3.12.5. Recent Developments

        15.3.13. SAP SE  

            15.3.13.1. Overview

            15.3.13.2. Key Competitors

            15.3.13.3. Financial Overview

            15.3.13.4. Strategy

            15.3.13.5. Recent Developments  

        15.3.14. SAS Institute Inc.

            15.3.14.1. Overview

            15.3.14.2. Key Competitors

            15.3.14.3. Financial Overview

            15.3.14.4. Strategy

            15.3.14.5. Recent Developments

        15.3.15. Capgemini S.A.

            15.3.15.1. Overview

            15.3.15.2. Key Competitors

            15.3.15.3. Financial Overview

            15.3.15.4. Strategy

            15.3.15.5. Recent Developments

        15.3.16. Cloudera, Inc.

            15.3.16.1. Overview

            15.3.16.2. Key Competitors

            15.3.16.3. Financial Overview

            15.3.16.4. Strategy

            15.3.16.5. Recent Developments

    15.4. Data Management Company Profiles 

        15.4.1. Dell EMC 

            15.4.1.1. Overview

            15.4.1.2. Key Competitors

            15.4.1.3. Financial Overview

            15.4.1.4. Strategy

            15.4.1.5. SWOT Analysis

        15.4.2. Newgen Software, Inc.

            15.4.2.1. Overview

            15.4.2.2. Key Competitors

            15.4.2.3. Financial Overview

            15.4.2.4. Strategy

            15.4.2.5. SWOT Analysis

        15.4.3. Cisco Systems, Inc.

            15.4.3.1. Overview

            15.4.3.2. Key Competitors

            15.4.3.3. Financial Overview

            15.4.3.4. Strategy

            15.4.3.5. SWOT Analysis

        15.4.4. Tata Consultancy Services Ltd.

            15.4.4.1. Overview

            15.4.4.2. Key Competitors

            15.4.4.3. Financial Overview

            15.4.4.4. Strategy

            15.4.4.5. SWOT Analysis

        15.4.5. Halliburton

            15.4.5.1. Overview

            15.4.5.2. Key Competitors

            15.4.5.3. Financial Overview

            15.4.5.4. Strategy

            15.4.5.5. SWOT Analysis

        15.4.6. Informatica Corporation

            15.4.6.1. Overview

            15.4.6.2. Key Competitors

            15.4.6.3. Financial Overview

            15.4.6.4. Strategy

            15.4.6.5. SWOT Analysis

        15.4.7. Schlumberger Limited

            15.4.7.1. Overview

            15.4.7.2. Key Competitors

            15.4.7.3. Financial Overview

            15.4.7.4. Strategy

            15.4.7.5. SWOT Analysis

    15.5. Direct Data Monetization Company Profiles 

        15.5.1. National Data Repository, India

            15.5.1.1. Overview

            15.5.1.2. Key Competitors

            15.5.1.3. Financial Overview

            15.5.1.4. Strategy

            15.5.1.5. Recent Developments

        15.5.2. ION Geophysical Corporation

            15.5.2.1. Overview

            15.5.2.2. Key Competitors

            15.5.2.3. Financial Overview

            15.5.2.4. Strategy

            15.5.2.5. Recent Developments

16. Key Takeaway

Don't pay for what you don't need

Customize your report by selecting specific countries or regions and save 30%!

List of Tables

Table 1: Global Market Revenue (US$ Million) Forecast, By Component, 2022 to 2032

Table 2: Global Market Revenue (US$ Million) Forecast, By Big Data Software, 2022 to 2032

Table 3: Global Market Revenue (US$ Million) Forecast, By Big Data Services, 2022 to 2032

Table 4: Global Market Revenue (US$ Million) Forecast, By Data Management Software, 2022 to 2032

Table 5: Global Market Revenue (US$ Million) Forecast, By Data Management Services, 2022 to 2032

Table 6: Global Market Revenue (US$ Million) Forecast, By Oil Companies, 2022 to 2032

Table 7: Global Market Revenue (US$ Million) Forecast, By Application, 2022 to 2032

Table 8: Global Upstream Market Revenue (US$ Million) Forecast, By E&P Lifecycle, 2022 to 2032

Table 9: Global Market Revenue (US$ Million) Forecast, By Region, 2022 to 2032

Table 10: North America Market Revenue (US$ Million) Forecast, By Component, 2022 to 2032

Table 11: North America Market Revenue (US$ Million) Forecast, By Big Data Software, 2022 to 2032

Table 12: North America Market Revenue (US$ Million) Forecast, By Big Data Services, 2022 to 2032

Table 13: North America Market Revenue (US$ Million) Forecast, By Data Management Software, 2022 to 2032

Table 14: North America Market Revenue (US$ Million) Forecast, By Data Management Services, 2022 to 2032

Table 15: North America Market Revenue (US$ Million) Forecast, By Oil Companies, 2022 to 2032

Table 16: North America Market Revenue (US$ Million) Forecast, By Application, 2022 to 2032

Table 17: North America Upstream Market Revenue (US$ Million) Forecast, By E&P Lifecycle, 2022 to 2032

Table 18: North America Market Revenue (US$ Million) Forecast, By Country, 2022 to 2032

Table 19: Europe Market Revenue (US$ Million) Forecast, By Component, 2022 to 2032

Table 20: Europe Market Revenue (US$ Million) Forecast, By Big Data Software, 2022 to 2032

Table 21: Europe Market Revenue (US$ Million) Forecast, By Big Data Services, 2022 to 2032

Table 22: Europe Market Revenue (US$ Million) Forecast, By Data Management Software, 2022 to 2032

Table 23: Europe Market Revenue (US$ Million) Forecast, By Data Management Services, 2022 to 2032

Table 24: Europe Market Revenue (US$ Million) Forecast, By Oil Companies, 2022 to 2032

Table 25: Europe Market Revenue (US$ Million) Forecast, By Application, 2022 to 2032

Table 26: Europe Upstream Market Revenue (US$ Million) Forecast, By E&P Lifecycle, 2022 - 2032

Table 27: Europe Market Revenue (US$ Million) Forecast, By Country, 2022 to 2032

Table 28: Asia Pacific Market Revenue (US$ Million) Forecast, By Component, 2022 to 2032

Table 29: Asia Pacific Market Revenue (US$ Million) Forecast, By Big Data Software, 2022 to 2032

Table 30: Asia Pacific Market Revenue (US$ Million) Forecast, By Big Data Services, 2022 to 2032

Table 31: Asia Pacific Market Revenue (US$ Million) Forecast, By Data Management Software, 2022 to 2032

Table 32: Asia Pacific Market Revenue (US$ Million) Forecast, By Data Management Services, 2022 to 2032

Table 33: Asia Pacific Market Revenue (US$ Million) Forecast, By Oil Companies, 2022 to 2032

Table 34: Asia Pacific Market Revenue (US$ Million) Forecast, By Application, 2022 to 2032

Table 35: Asia Pacific Upstream Market Revenue (US$ Million) Forecast, By E&P Lifecycle, 2022 to 2032

Table 36: North America Market Revenue (US$ Million) Forecast, By Country, 2022 to 2032

Table 37: Middle East and Africa (MEA) Market Revenue (US$ Million) Forecast, By Component, 2022 to 2032

Table 38: Middle East and Africa (MEA) Market Revenue (US$ Million) Forecast, By Big Data Software, 2022 to 2032

Table 39: Middle East and Africa (MEA) Market Revenue (US$ Million) Forecast, By Big Data Services, 2022 to 2032

Table 40: Middle East and Africa (MEA) Market Revenue (US$ Million) Forecast, By Data Management Software, 2022 to 2032

Table 41: Middle East and Africa (MEA) Market Revenue (US$ Million) Forecast, By Data Management Services, 2022 to 2032

Table 42: Middle East and Africa (MEA) Market Revenue (US$ Million) Forecast, By Oil Companies, 2022 to 2032

Table 43: Middle East and Africa (MEA) Market Revenue (US$ Million) Forecast, By Application, 2022 to 2032

Table 44: Middle East and Africa (MEA) Upstream Market Revenue (US$ Million) Forecast, By E&P Lifecycle, 2022 to 2032

Table 45: North America Market Revenue (US$ Million) Forecast, By Country, 2022 to 2032

Table 46: South America Market Revenue (US$ Million) Forecast, By Component, 2022 to 2032

Table 47: South America Market Revenue (US$ Million) Forecast, By Big Data Software, 2022 to 2032

Table 48: South America Market Revenue (US$ Million) Forecast, By Big Data Services, 2022 to 2032

Table 49: South America Market Revenue (US$ Million) Forecast, By Data Management Software, 2022 to 2032

Table 50: South America Market Revenue (US$ Million) Forecast, By Data Management Services, 2022 to 2032

Table 51: South America Market Revenue (US$ Million) Forecast, By Oil Companies, 2022 to 2032

Table 52: South America Market Revenue (US$ Million) Forecast, By Application, 2022 to 2032

Table 53: South America Upstream Market Revenue (US$ Million) Forecast, By E&P Lifecycle, 2022 to 2032

Table 54: North America Market Revenue (US$ Million) Forecast, By Country, 2022 to 2032
Sudip Saha
Sudip Saha
Principal Consultant
LinkedIn
Talk to Analyst

Find your sweet spots for generating winning opportunities in this market.

Talk to Analyst

List of Charts

Figure 1: Research Methodology

Figure 2: Global Market

Figure 3: World GDP Indicator

Figure 4: Global ICT Spending (US$ Bn), 2016 to 2032

Figure 5: Global Oil and Gas CAPEX (US$ Million), 2016 to 2032

Figure 6: Global Oil and Gas IT Spending (US$ Million), 2016 to 2032

Figure 7: Global Oil and Gas IT Spending, By Type (US$ Million)

Figure 8: Global Oil and Gas IT Spending, By Type (% Share)

Figure 9: Market Revenue Analysis, 2016 to 2032 (US$ Million)

Figure 10: Historic growth trends, 2016 to 2032

Figure 11: Market Volume Analysis, 2021 to 2032 (US$ Million)

Figure 12: Forecast growth trends, 2021 to 2032

Figure 13: Global Market Revenue (US$ Million) and Y-o-Y Forecast, 2022 to 2032

Figure 14: Global Opportunity Growth Analysis (US$ Million) Forecast, 2022 to 2032

Figure 15: Global Market Share Analysis, By Component (2021)

Figure 16: Global Market Share Analysis, By Component (2021)

Figure 17: Global Market Share Analysis, By Big Data Software (2021)

Figure 18: Global Market Share Analysis, By Big Data Software (2021)

Figure 19: Global Market Share Analysis, By Big Data Services (2021)

Figure 20: Global Market Share Analysis, By Big Data Services (2021)

Figure 21: Global Market Share Analysis, By Data Management Software (2021)

Figure 22: Global Market Share Analysis, By Data Management Software (2021)

Figure 23: Global Market Share Analysis, By Data Management Services (2021)

Figure 24: Global Market Share Analysis, By Data Management Services (2021)

Figure 25: Global Market Attractiveness Analysis, By Component, 2022 to 2032

Figure 26: Global Market Attractiveness Analysis, By Big Data Software, 2022 to 2032

Figure 27: Global Market Attractiveness Analysis, By Big Data Services, 2022 to 2032

Figure 28: Global Market Attractiveness Analysis, By Data Management Software, 2022 to 2032

Figure 29: Global Market Attractiveness Analysis, By Data Management Services, 2022 to 2032

Figure 30: Global Market Share Analysis, By Oil Companies (2021)

Figure 31: Global Market Share Analysis, By Companies (2021)

Figure 32: Global Market Attractiveness Analysis, By Oil Companies, 2022 to 2032

Figure 33: Global Market Share Analysis, By Application (2021)

Figure 34: Global Market Share Analysis, By Application (2021)

Figure 35: Global Upstream Market Share Analysis, By E&P Lifecycle (2021)

Figure 36: Global Upstream Market Share Analysis, By E&P Lifecycle (2021)

Figure 37: Global Market Attractiveness Analysis, By Application, 2022 to 2032

Figure 38: Global Upstream Market Attractiveness Analysis, By E&P Lifecycle, 2022 to 2032

Figure 39: Global Market Share Analysis, By Region (2021)

Figure 40: Global Market Share Analysis, By Region (2021)

Figure 41: Global Market Attractiveness Analysis, by Region

Figure 42: North America Market Revenue (US$ Million) and Y-o-Y Forecast, 2022 to 2032

Figure 43: North America Opportunity Growth Analysis (US$ Million) Forecast, 2022 to 2032

Figure 44: North America Market Share Analysis, By Component (2021)

Figure 45: North America Market Share Analysis, By Component (2021)

Figure 46: North America Market Share Analysis, By Big Data Software (2021)

Figure 47: North America Market Share Analysis, By Big Data Software (2021)

Figure 48: North America Market Share Analysis, By Big Data Services (2021)

Figure 49: North America Market Share Analysis, By Big Data Services (2021)

Figure 50: North America Market Share Analysis, By Data Management Software (2021)

Figure 51: North America Market Share Analysis, By Data Management Software (2021)

Figure 52: North America Market Share Analysis, By Data Management Services (2021)

Figure 53: North America Market Share Analysis, By Data Management Services (2021)

Figure 54: North America Market Share Analysis, By Oil Companies (2021)

Figure 55: North America Market Share Analysis, By Oil Companies (2021)

Figure 56: North America Market Share Analysis, By Application (2021)

Figure 57: North America Market Share Analysis, By Application (2021)

Figure 58: North America Upstream Market Share Analysis, By E&P Lifecycle (2021)

Figure 59: North America Upstream Market Share Analysis, By E&P Lifecycle (2021)

Figure 60: North America Market Share Analysis, By Country (2021)

Figure 61: North America Market Share Analysis, By Country (2021)

Figure 62: North America Market Attractiveness Analysis, By Component, 2022 to 2032

Figure 63: North America Market Attractiveness Analysis, By Big Data Software, 2022 to 2032

Figure 64: North America Market Attractiveness Analysis, By Big Data Services, 2022 to 2032

Figure 65: North America Market Attractiveness Analysis, By Data Management Software, 2022 to 2032

Figure 66: North America Market Attractiveness Analysis, By Data Management Services, 2022 to 2032

Figure 67: North America Market Attractiveness Analysis, By Oil Companies, 2022 to 2032

Figure 68: North America Market Attractiveness Analysis, By Application, 2022 to 2032

Figure 69: North America Upstream Market Attractiveness Analysis, By E&P Lifecycle, 2022 to 2032

Figure 70: North America Market Attractiveness Analysis, by Country

Figure 71: Europe Market Revenue (US$ Million) and Y-o-Y Forecast, 2022 to 2032

Figure 72: Europe Opportunity Growth Analysis (US$ Million) Forecast, 2022 to 2032

Figure 73: Europe Market Share Analysis, By Component (2021)

Figure 74: Europe Market Share Analysis, By Component (2021)

Figure 75: Europe Market Share Analysis, By Big Data Software (2021)

Figure 76: Europe Market Share Analysis, By Big Data Software (2021)

Figure 77: Europe Market Share Analysis, By Big Data Services (2021)

Figure 78: Europe Market Share Analysis, By Big Data Services (2021)

Figure 79: Europe Market Share Analysis, By Data Management Software (2021)

Figure 80: Europe Market Share Analysis, By Data Management Software (2021)

Figure 81: Europe Market Share Analysis, By Data Management Services (2021)

Figure 82: Europe Market Share Analysis, By Data Management Services (2021)

Figure 83: Europe Market Share Analysis, By Oil Companies (2021)

Figure 84: Europe Market Share Analysis, By Oil Companies (2021)

Figure 85: Europe Market Share Analysis, By Application (2021)

Figure 86: Europe Market Share Analysis, By Application (2021)

Figure 87: Europe Upstream Market Share Analysis, By E&P Lifecycle (2021)

Figure 88: Europe Upstream Market Share Analysis, By E&P Lifecycle (2021)

Figure 89: Europe Market Share Analysis, By Country (2021)

Figure 90: Europe Market Share Analysis, By Country (2021)

Figure 91: Europe Market Attractiveness Analysis, By Component, 2022 to 2032

Figure 92: Europe Market Attractiveness Analysis, By Big Data Software, 2022 to 2032

Figure 93: Europe Market Attractiveness Analysis, By Big Data Services, 2022 to 2032

Figure 94: Europe Market Attractiveness Analysis, By Data Management Software, 2022 to 2032

Figure 95: Europe Market Attractiveness Analysis, By Data Management Services, 2022 to 2032

Figure 96: Europe Market Attractiveness Analysis, By Oil Companies, 2022 to 2032

Figure 97: Europe Market Attractiveness Analysis, By Application, 2022 to 2032

Figure 98: Europe Upstream Market Attractiveness Analysis, By E&P Lifecycle, 2022 to 2032

Figure 99: Europe Market Attractiveness Analysis, by Country

Figure 100: Asia Pacific Market Revenue (US$ Million) and Y-o-Y Forecast, 2022 to 2032

Figure 101: Asia Pacific Opportunity Growth Analysis (US$ Million) Forecast, 2022 to 2032

Figure 102: Asia Pacific Market Share Analysis, By Component (2021)

Figure 103: Asia Pacific Market Share Analysis, By Component (2021)

Figure 104: Asia Pacific Market Share Analysis, By Big Data Software (2021)

Figure 105: Asia Pacific Market Share Analysis, By Big Data Software (2021)

Figure 106: Asia Pacific Market Share Analysis, By Big Data Services (2021)

Figure 107: Asia Pacific Market Share Analysis, By Big Data Services (2021)

Figure 108: Asia Pacific Market Share Analysis, By Data Management Software (2021)

Figure 109: Asia Pacific Market Share Analysis, By Data Management Software (2021)

Figure 110: Asia Pacific Market Share Analysis, By Data Management Services (2021)

Figure 111: Asia Pacific Market Share Analysis, By Data Management Services (2021)

Figure 112: Asia Pacific Market Share Analysis, By Oil Companies (2021)

Figure 113: Asia Pacific Market Share Analysis, By Oil Companies (2021)

Figure 114: Asia Pacific Market Share Analysis, By Application (2021)

Figure 115: Asia Pacific Market Share Analysis, By Application (2021)

Figure 116: Asia Pacific Upstream Market Share Analysis, By E&P Lifecycle (2021)

Figure 117: Asia Pacific Upstream Market Share Analysis, By E&P Lifecycle (2021)

Figure 118: North America Market Share Analysis, By Country (2021)

Figure 119: North America Market Share Analysis, By Country (2021)

Figure 120: Asia Pacific Market Attractiveness Analysis, By Component, 2022 to 2032

Figure 121: Asia Pacific Market Attractiveness Analysis, By Big Data Software, 2022 to 2032

Figure 122: Asia Pacific Market Attractiveness Analysis, By Big Data Services, 2022 to 2032

Figure 123: Asia Pacific Market Attractiveness Analysis, By Data Management Software, 2022 to 2032

Figure 124: Asia Pacific Market Attractiveness Analysis, By Data Management Services, 2022 to 2032

Figure 125: Asia Pacific Market Attractiveness Analysis, By Oil Companies, 2022 to 2032

Figure 126: Asia Pacific Market Attractiveness Analysis, By Application, 2022 to 2032

Figure 127: Asia Pacific Upstream Market Attractiveness Analysis, By E&P Lifecycle, 2022 to 2032

Figure 128: Asia Pacific Market Attractiveness Analysis, by Country

Figure 129: Middle East & Africa Market Revenue (US$ Million) and Y-o-Y Forecast, 2022 to 2032

Figure 130: Middle East & Africa Opportunity Growth Analysis (US$ Million) Forecast, 2022 to 2032

Figure 131: Middle East and Africa (MEA) Market Share Analysis, By Component (2021)

Figure 132: Middle East and Africa (MEA) Market Share Analysis, By Component (2021)

Figure 133: Middle East and Africa (MEA) Market Share Analysis, By Big Data Software (2021)

Figure 134: Middle East and Africa (MEA) Market Share Analysis, By Big Data Software (2021)

Figure 135: Middle East and Africa (MEA) Market Share Analysis, By Big Data Services (2021)

Figure 136: Middle East and Africa (MEA) Market Share Analysis, By Big Data Services (2021)

Figure 137: Middle East and Africa (MEA) Market Share Analysis, By Data Management Software (2021)

Figure 138: Middle East and Africa (MEA) Market Share Analysis, By Data Management Software (2021)

Figure 139: Middle East and Africa (MEA) Market Share Analysis, By Data Management Services (2021)

Figure 140: Middle East and Africa (MEA) Market Share Analysis, By Data Management Services (2021)

Figure 141: Middle East and Africa (MEA) Market Share Analysis, By Oil Companies (2021)

Figure 142: Middle East and Africa (MEA) Market Share Analysis, By Oil Companies (2021)

Figure 143: Middle East and Africa (MEA) Market Share Analysis, By Application (2021)

Figure 144: Middle East and Africa (MEA) Market Share Analysis, By Application (2021)

Figure 145: Middle East and Africa (MEA) Upstream Market Share Analysis, By E&P Lifecycle (2021)

Figure 146: Middle East and Africa (MEA) Upstream Market Share Analysis, By E&P Lifecycle (2021)

Figure 147: North America Market Share Analysis, By Country (2021)

Figure 148: North America Market Share Analysis, By Country (2021)

Figure 149: Middle East and Africa (MEA) Market Attractiveness Analysis, By Component, 2022 to 2032

Figure 150: Middle East and Africa (MEA) Market Attractiveness Analysis, By Big Data Software, 2022 to 2032

Figure 151: Middle East and Africa (MEA) Market Attractiveness Analysis, By Big Data Services, 2022 to 2032

Figure 152: Middle East and Africa (MEA) Market Attractiveness Analysis, By Data Management Software, 2022 to 2032

Figure 153: Middle East and Africa (MEA) Market Attractiveness Analysis, By Data Management Services, 2022 to 2032

Figure 154: Middle East and Africa (MEA) Market Attractiveness Analysis, By Oil Companies, 2022 to 2032

Figure 155: Middle East and Africa (MEA) Market Attractiveness Analysis, By Application, 2022 to 2032

Figure 156: Middle East and Africa (MEA) Upstream Market Attractiveness Analysis, By E&P Lifecycle, 2022 to 2032

Figure 157: Middle East and Africa (MEA) Market Attractiveness Analysis, By Country

Figure 158: South America Market Revenue (US$ Million) and Y-o-Y Forecast, 2022 to 2032

Figure 159: South America Opportunity Growth Analysis (US$ Million) Forecast, 2022 to 2032

Figure 160: South America Market Share Analysis, By Component (2021)

Figure 161: South America Market Share Analysis, By Component (2021)

Figure 162: South America Market Share Analysis, By Big Data Software (2021)

Figure 163: South America Market Share Analysis, By Big Data Software (2021)

Figure 164: South America Market Share Analysis, By Big Data Services (2021)

Figure 165: South America Market Share Analysis, By Big Data Services (2021)

Figure 166: South America Market Share Analysis, By Data Management Software (2021)

Figure 167: South America Market Share Analysis, By Data Management Software (2021)

Figure 168: South America Market Share Analysis, By Data Management Services (2021)

Figure 169: South America Market Share Analysis, By Data Management Services (2021)

Figure 170: South America Market Share Analysis, By Oil Companies (2021)

Figure 171: South America Market Share Analysis, By Oil Companies (2021)

Figure 172: South America Market Share Analysis, By Application (2021)

Figure 173: South America Market Share Analysis, By Application (2021)

Figure 174: South America Upstream Market Share Analysis, By E&P Lifecycle (2021)

Figure 175: South America Upstream Market Share Analysis, By E&P Lifecycle (2021)

Figure 176: North America Market Share Analysis, By Country (2021)

Figure 177: North America Market Share Analysis, By Country (2021)

Figure 178: South America Market Attractiveness Analysis, By Component, 2022 to 2032

Figure 179: South America Market Attractiveness Analysis, By Big Data Software, 2022 to 2032

Figure 180: South America Market Attractiveness Analysis, By Big Data Services, 2022 to 2032

Figure 181: South America Market Attractiveness Analysis, By Data Management Software, 2022 to 2032

Figure 182: South America Market Attractiveness Analysis, By Data Management Services, 2022 to 2032

Figure 183: South America Market Attractiveness Analysis, By Oil Companies, 2022 to 2032

Figure 184: South America Market Attractiveness Analysis, By Application, 2022 to 2032

Figure 185: South America Upstream Market Attractiveness Analysis, By E&P Lifecycle, 2022 to 2032

Figure 186: South America Market Attractiveness Analysis, By Country

Recommendations

Technology

Carrier Infrastructure in Telecom Applications Market

Published : November 2022

Technology

Data Business in Oil & Gas Market

Published : April 2022

Explore Technology Insights

View Reports
Google translate

Data Business in Oil & Gas Market