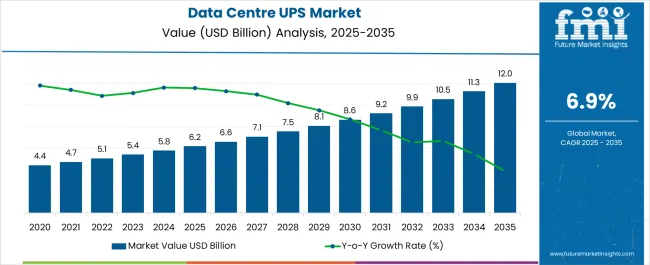
The global data centre UPS market is expected to secure USD 5,407.8 million in 2023. During the forecast period of 2023 to 2033, the market is likely to exhibit a CAGR of 6.9% while amassing a market value worth USD 10,571.6, million. The growth of the market can be attributed to the increasing expansion of the consumer electronics sector.
Data Points | Key Statistics |
---|---|
Expected Market Value (2023) | USD 5,407.8 million |
Anticipated Forecast Value (2033) | USD 10,571.6 ,million |
Projected Growth Rate (2023 to 2033) | 6.9% CAGR |
The increasing application of cloud computing services by SMEs and significant growth in the volume of data centres globally is projected to be the most significant factors contributing to the growth of the data centre uninterrupted power supply (UPS) market during the forecast period. Data Centre UPS provides a continuous power supply to the data centres and protects machines against power disruptions.
Data Centres are an important asset used in organizations for the distribution and processing of large data in an uninterrupted manner to secure the data, data centre UPS are installed.
Growing Inclination towards Cloud Computing to Benefit the Centre UPS Market
The rising inclination towards cloud computing, virtualization, and the growing demand for easy data availability is expected to propel the data centre’s uninterrupted power supply (UPS) market during the forecast period.
The rising application of digital services and the prevalence of the digital age or increasing digitization in general especially in the evolving economies will further propel expansion in the data centre uninterrupted power supply (UPS) market. Moreover, concerns regarding the loss of data in case of a power outage will also drive growth in the demand for data centre uninterrupted power supply (UPS).
Cloud computing services are spending about 4.5 times the rate of IT spending. The primary growth of the cloud is due to its availability of about 99% and ease of access. Cloud services need to be online to deliver services that enhance the demand for UPS systems.
High Costs Associated with Raw Materials to Hamper the Market
The most significant factor responsible for hampering the global data centre UPS market is the high expenses associated with raw materials. Further, a lack of expertise and trained personnel will offer a major challenge to the expansion of the data centre-interrupted power supply market.
However, the presence of untapped markets in regions such as the Middle East and Africa, and the growing number of data centres in South America are expected to counter hampering factors and propel the market growth during the forecast period.
Increasing Demand for UPS Systems in SMEs to Augment the Market Size
Growing demand for standby UPS systems among SMEs is expected to offer significant opportunities to the global data centre UPS market during the forecast period.
The associated benefits such as small size, low cost, silent operation when on standby, and greater efficiency have resulted in an increased acceptance of offline UPS among small data centre operators.
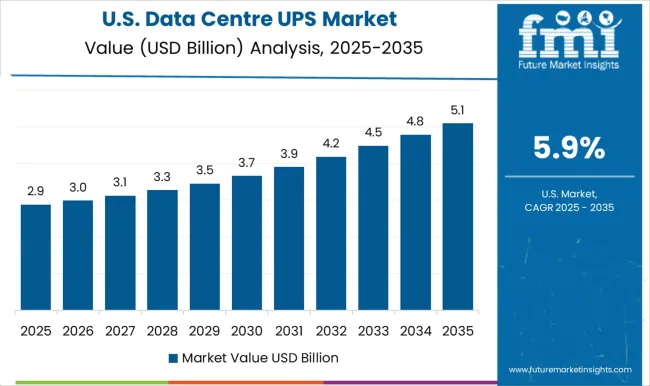
According to the study, the global data centre UPS market is expected to be dominated by North America. In 2023, the region is anticipated to secure 34.7% of the global share. The domination of the region can be attributed to the presence of established firms in the region.
The USA market has a robust presence of various cloud service providers such as Facebook Inc., Delta Electronics Inc., and Google LLC., which are focusing on new strategies to power their data centres. These factors are boosting the industry value of data centre UPS which offers the optimum Power Usage Efficiency (PUE) ratio.
Also, the growing penetration of cloud solutions is expected to benefit the market during the forecast period. As per the World Trade Statistical Review, cloud infrastructure investment in the USA increased by 1.1% in the third quarter of 2021, as the COVID-19 pandemic accelerated the country's digital transition.
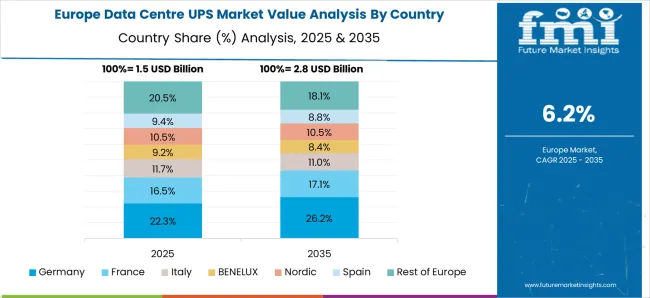
The European market for Data Centre UPS market is expected to be the second-largest market. As of 2023, the region is projected to secure 28.4% of the global share. The development of the region can be attributed to the increasing application of digital payment solutions.
The rising application of contactless payments has grown the demand for data centre UPS that assures reliable power supply. The industry will rise exponentially due to the rising acceptance of these data centre UPS that helps in the maintenance of customer access to online and mobile banking and the operation of trading equipment in large data centre facilities operated by banking and financial institutions.
According to the study, the Asia Pacific is expected to be the fastest-growing market during the forecast period. The growth of the regional market can be attributed to the rapid expansion of the IT & Telecom sector.
The increasing digitization and penetration of technologies like Iota and 5G are expected to play a significant role in driving the global market for data centre UPS market. The telecom operators are introducing a 5G standalone (SA) network to offer modern and advanced services to customers to efficiently run a wireless network that demands a reliable power infrastructure to deliver high-speed services.
In February 2023, Nokia announced the plan to launch advanced services and network solutions for 5G between 2023 and 2025 in India to meet the increasing demand for various industry verticals.
QTS (USA), Vantage Data Centre (USA), Data Bank (USA), structure (Canada), ZoomInfo (USA), Delphix (USA), Oxford Semantic (United Kingdom), Princeton Digital Group (India), and Xplenty (Israel) are some of the emerging names in the global data centre UPS market.
Recent Updates from the Industry:
In February 2023, Data centre company Princeton Digital Group (PDG) announced that it has closed an equity investment of more than USD 500 million led by Mubadala Investment Company, which put in USD 350 million. Both existing shareholders in PDG - Warburg Pincus and Ontario Teachers’ Pension Plan Board - also invested in this round, the company informed.
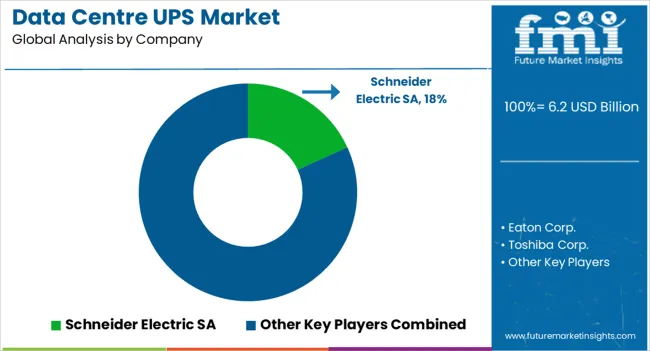
Key players in the global data centre UPSC market include Schneider Electric SA Eaton Corp., Toshiba Corp., Emerson Network Power Inc., Clary Corp., Intellipower Inc., General Electric Electrical Systems, Belkin International Inc., and Power Innovations International Inc.
Key Updates from the Industry Include:
Attributes | Details |
---|---|
Growth Rate | CAGR of 6.9% from 2023 to 2033 |
Market Value in 2023 | USD 5,407.8 million |
Market Value in 2033 | USD 10,571.6 ,million |
Base Year for Estimation | 2022 |
Historical Data | 2018 to 2022 |
Forecast Period | 2023 to 2033 |
Quantitative Units | Revenue in USD million and CAGR from 2023 to 2033 |
Report Coverage | Revenue Forecast, Volume Forecast, Company Ranking, Competitive Landscape, Growth Factors, Trends, and Pricing Analysis |
Segments Covered | Product Type, Application, Technology, Region |
Regions Covered | North America; Latin America; Europe; Asia Pacific; Middle East and Africa |
Key Countries Profiled | United States of America, Canada, Brazil, Mexico, Germany, United Kingdom, France, Spain, Italy, China, Japan, South Korea, Malaysia, Singapore, Australia, New Zealand, GCC Countries, South Africa, Israel |
Key Companies Profiled | Schneider Electric SA; Eaton Corp.; Toshiba Corp.; Emerson Network Power Inc.; Clary Corp.; Intellipower Inc.; General Electric Electrical Systems; Belkin International Inc.; Power Innovations International Inc.; Barri; ABB Ltd.; Huawei Technologies; Mitsubishi Electric Corporation; Vertiv Group |
Customization | Available Upon Request |
Table 1: Global Market Value (US$ Million) Forecast by Region, 2018 to 2033
Table 2: Global Market Volume (Units) Forecast by Region, 2018 to 2033
Table 3: Global Market Value (US$ Million) Forecast by Product, 2018 to 2033
Table 4: Global Market Volume (Units) Forecast by Product, 2018 to 2033
Table 5: Global Market Value (US$ Million) Forecast by Application, 2018 to 2033
Table 6: Global Market Volume (Units) Forecast by Application, 2018 to 2033
Table 7: Global Market Value (US$ Million) Forecast by Technology, 2018 to 2033
Table 8: Global Market Volume (Units) Forecast by Technology, 2018 to 2033
Table 9: North America Market Value (US$ Million) Forecast by Country, 2018 to 2033
Table 10: North America Market Volume (Units) Forecast by Country, 2018 to 2033
Table 11: North America Market Value (US$ Million) Forecast by Product, 2018 to 2033
Table 12: North America Market Volume (Units) Forecast by Product, 2018 to 2033
Table 13: North America Market Value (US$ Million) Forecast by Application, 2018 to 2033
Table 14: North America Market Volume (Units) Forecast by Application, 2018 to 2033
Table 15: North America Market Value (US$ Million) Forecast by Technology, 2018 to 2033
Table 16: North America Market Volume (Units) Forecast by Technology, 2018 to 2033
Table 17: Latin America Market Value (US$ Million) Forecast by Country, 2018 to 2033
Table 18: Latin America Market Volume (Units) Forecast by Country, 2018 to 2033
Table 19: Latin America Market Value (US$ Million) Forecast by Product, 2018 to 2033
Table 20: Latin America Market Volume (Units) Forecast by Product, 2018 to 2033
Table 21: Latin America Market Value (US$ Million) Forecast by Application, 2018 to 2033
Table 22: Latin America Market Volume (Units) Forecast by Application, 2018 to 2033
Table 23: Latin America Market Value (US$ Million) Forecast by Technology, 2018 to 2033
Table 24: Latin America Market Volume (Units) Forecast by Technology, 2018 to 2033
Table 25: Western Europe Market Value (US$ Million) Forecast by Country, 2018 to 2033
Table 26: Western Europe Market Volume (Units) Forecast by Country, 2018 to 2033
Table 27: Western Europe Market Value (US$ Million) Forecast by Product, 2018 to 2033
Table 28: Western Europe Market Volume (Units) Forecast by Product, 2018 to 2033
Table 29: Western Europe Market Value (US$ Million) Forecast by Application, 2018 to 2033
Table 30: Western Europe Market Volume (Units) Forecast by Application, 2018 to 2033
Table 31: Western Europe Market Value (US$ Million) Forecast by Technology, 2018 to 2033
Table 32: Western Europe Market Volume (Units) Forecast by Technology, 2018 to 2033
Table 33: Eastern Europe Market Value (US$ Million) Forecast by Country, 2018 to 2033
Table 34: Eastern Europe Market Volume (Units) Forecast by Country, 2018 to 2033
Table 35: Eastern Europe Market Value (US$ Million) Forecast by Product, 2018 to 2033
Table 36: Eastern Europe Market Volume (Units) Forecast by Product, 2018 to 2033
Table 37: Eastern Europe Market Value (US$ Million) Forecast by Application, 2018 to 2033
Table 38: Eastern Europe Market Volume (Units) Forecast by Application, 2018 to 2033
Table 39: Eastern Europe Market Value (US$ Million) Forecast by Technology, 2018 to 2033
Table 40: Eastern Europe Market Volume (Units) Forecast by Technology, 2018 to 2033
Table 41: South Asia and Pacific Market Value (US$ Million) Forecast by Country, 2018 to 2033
Table 42: South Asia and Pacific Market Volume (Units) Forecast by Country, 2018 to 2033
Table 43: South Asia and Pacific Market Value (US$ Million) Forecast by Product, 2018 to 2033
Table 44: South Asia and Pacific Market Volume (Units) Forecast by Product, 2018 to 2033
Table 45: South Asia and Pacific Market Value (US$ Million) Forecast by Application, 2018 to 2033
Table 46: South Asia and Pacific Market Volume (Units) Forecast by Application, 2018 to 2033
Table 47: South Asia and Pacific Market Value (US$ Million) Forecast by Technology, 2018 to 2033
Table 48: South Asia and Pacific Market Volume (Units) Forecast by Technology, 2018 to 2033
Table 49: East Asia Market Value (US$ Million) Forecast by Country, 2018 to 2033
Table 50: East Asia Market Volume (Units) Forecast by Country, 2018 to 2033
Table 51: East Asia Market Value (US$ Million) Forecast by Product, 2018 to 2033
Table 52: East Asia Market Volume (Units) Forecast by Product, 2018 to 2033
Table 53: East Asia Market Value (US$ Million) Forecast by Application, 2018 to 2033
Table 54: East Asia Market Volume (Units) Forecast by Application, 2018 to 2033
Table 55: East Asia Market Value (US$ Million) Forecast by Technology, 2018 to 2033
Table 56: East Asia Market Volume (Units) Forecast by Technology, 2018 to 2033
Table 57: Middle East and Africa Market Value (US$ Million) Forecast by Country, 2018 to 2033
Table 58: Middle East and Africa Market Volume (Units) Forecast by Country, 2018 to 2033
Table 59: Middle East and Africa Market Value (US$ Million) Forecast by Product, 2018 to 2033
Table 60: Middle East and Africa Market Volume (Units) Forecast by Product, 2018 to 2033
Table 61: Middle East and Africa Market Value (US$ Million) Forecast by Application, 2018 to 2033
Table 62: Middle East and Africa Market Volume (Units) Forecast by Application, 2018 to 2033
Table 63: Middle East and Africa Market Value (US$ Million) Forecast by Technology, 2018 to 2033
Table 64: Middle East and Africa Market Volume (Units) Forecast by Technology, 2018 to 2033
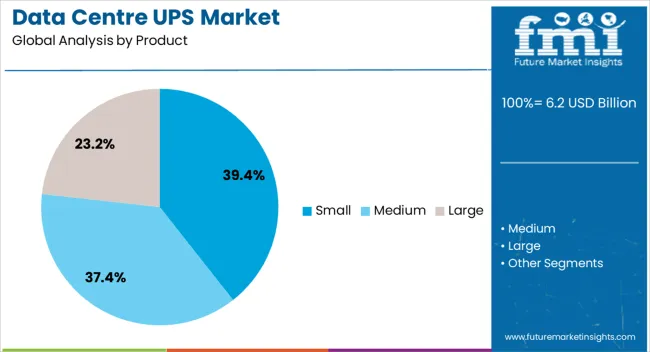
Figure 1: Global Market Value (US$ Million) by Product, 2023 to 2033
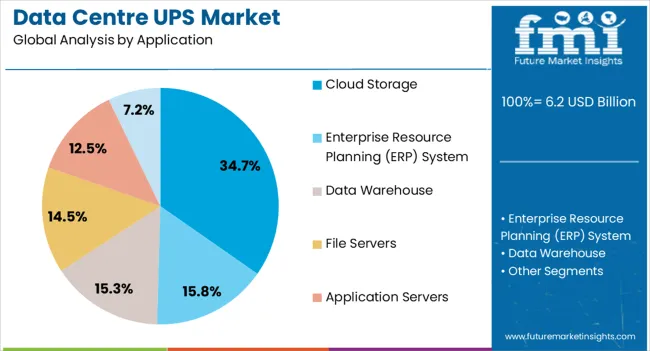
Figure 2: Global Market Value (US$ Million) by Application, 2023 to 2033
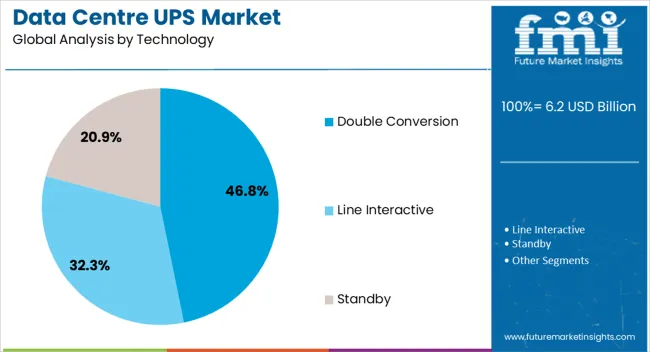
Figure 3: Global Market Value (US$ Million) by Technology, 2023 to 2033
Figure 4: Global Market Value (US$ Million) by Region, 2023 to 2033
Figure 5: Global Market Value (US$ Million) Analysis by Region, 2018 to 2033
Figure 6: Global Market Volume (Units) Analysis by Region, 2018 to 2033
Figure 7: Global Market Value Share (%) and BPS Analysis by Region, 2023 to 2033
Figure 8: Global Market Y-o-Y Growth (%) Projections by Region, 2023 to 2033
Figure 9: Global Market Value (US$ Million) Analysis by Product, 2018 to 2033
Figure 10: Global Market Volume (Units) Analysis by Product, 2018 to 2033
Figure 11: Global Market Value Share (%) and BPS Analysis by Product, 2023 to 2033
Figure 12: Global Market Y-o-Y Growth (%) Projections by Product, 2023 to 2033
Figure 13: Global Market Value (US$ Million) Analysis by Application, 2018 to 2033
Figure 14: Global Market Volume (Units) Analysis by Application, 2018 to 2033
Figure 15: Global Market Value Share (%) and BPS Analysis by Application, 2023 to 2033
Figure 16: Global Market Y-o-Y Growth (%) Projections by Application, 2023 to 2033
Figure 17: Global Market Value (US$ Million) Analysis by Technology, 2018 to 2033
Figure 18: Global Market Volume (Units) Analysis by Technology, 2018 to 2033
Figure 19: Global Market Value Share (%) and BPS Analysis by Technology, 2023 to 2033
Figure 20: Global Market Y-o-Y Growth (%) Projections by Technology, 2023 to 2033
Figure 21: Global Market Attractiveness by Product, 2023 to 2033
Figure 22: Global Market Attractiveness by Application, 2023 to 2033
Figure 23: Global Market Attractiveness by Technology, 2023 to 2033
Figure 24: Global Market Attractiveness by Region, 2023 to 2033
Figure 25: North America Market Value (US$ Million) by Product, 2023 to 2033
Figure 26: North America Market Value (US$ Million) by Application, 2023 to 2033
Figure 27: North America Market Value (US$ Million) by Technology, 2023 to 2033
Figure 28: North America Market Value (US$ Million) by Country, 2023 to 2033
Figure 29: North America Market Value (US$ Million) Analysis by Country, 2018 to 2033
Figure 30: North America Market Volume (Units) Analysis by Country, 2018 to 2033
Figure 31: North America Market Value Share (%) and BPS Analysis by Country, 2023 to 2033
Figure 32: North America Market Y-o-Y Growth (%) Projections by Country, 2023 to 2033
Figure 33: North America Market Value (US$ Million) Analysis by Product, 2018 to 2033
Figure 34: North America Market Volume (Units) Analysis by Product, 2018 to 2033
Figure 35: North America Market Value Share (%) and BPS Analysis by Product, 2023 to 2033
Figure 36: North America Market Y-o-Y Growth (%) Projections by Product, 2023 to 2033
Figure 37: North America Market Value (US$ Million) Analysis by Application, 2018 to 2033
Figure 38: North America Market Volume (Units) Analysis by Application, 2018 to 2033
Figure 39: North America Market Value Share (%) and BPS Analysis by Application, 2023 to 2033
Figure 40: North America Market Y-o-Y Growth (%) Projections by Application, 2023 to 2033
Figure 41: North America Market Value (US$ Million) Analysis by Technology, 2018 to 2033
Figure 42: North America Market Volume (Units) Analysis by Technology, 2018 to 2033
Figure 43: North America Market Value Share (%) and BPS Analysis by Technology, 2023 to 2033
Figure 44: North America Market Y-o-Y Growth (%) Projections by Technology, 2023 to 2033
Figure 45: North America Market Attractiveness by Product, 2023 to 2033
Figure 46: North America Market Attractiveness by Application, 2023 to 2033
Figure 47: North America Market Attractiveness by Technology, 2023 to 2033
Figure 48: North America Market Attractiveness by Country, 2023 to 2033
Figure 49: Latin America Market Value (US$ Million) by Product, 2023 to 2033
Figure 50: Latin America Market Value (US$ Million) by Application, 2023 to 2033
Figure 51: Latin America Market Value (US$ Million) by Technology, 2023 to 2033
Figure 52: Latin America Market Value (US$ Million) by Country, 2023 to 2033
Figure 53: Latin America Market Value (US$ Million) Analysis by Country, 2018 to 2033
Figure 54: Latin America Market Volume (Units) Analysis by Country, 2018 to 2033
Figure 55: Latin America Market Value Share (%) and BPS Analysis by Country, 2023 to 2033
Figure 56: Latin America Market Y-o-Y Growth (%) Projections by Country, 2023 to 2033
Figure 57: Latin America Market Value (US$ Million) Analysis by Product, 2018 to 2033
Figure 58: Latin America Market Volume (Units) Analysis by Product, 2018 to 2033
Figure 59: Latin America Market Value Share (%) and BPS Analysis by Product, 2023 to 2033
Figure 60: Latin America Market Y-o-Y Growth (%) Projections by Product, 2023 to 2033
Figure 61: Latin America Market Value (US$ Million) Analysis by Application, 2018 to 2033
Figure 62: Latin America Market Volume (Units) Analysis by Application, 2018 to 2033
Figure 63: Latin America Market Value Share (%) and BPS Analysis by Application, 2023 to 2033
Figure 64: Latin America Market Y-o-Y Growth (%) Projections by Application, 2023 to 2033
Figure 65: Latin America Market Value (US$ Million) Analysis by Technology, 2018 to 2033
Figure 66: Latin America Market Volume (Units) Analysis by Technology, 2018 to 2033
Figure 67: Latin America Market Value Share (%) and BPS Analysis by Technology, 2023 to 2033
Figure 68: Latin America Market Y-o-Y Growth (%) Projections by Technology, 2023 to 2033
Figure 69: Latin America Market Attractiveness by Product, 2023 to 2033
Figure 70: Latin America Market Attractiveness by Application, 2023 to 2033
Figure 71: Latin America Market Attractiveness by Technology, 2023 to 2033
Figure 72: Latin America Market Attractiveness by Country, 2023 to 2033
Figure 73: Western Europe Market Value (US$ Million) by Product, 2023 to 2033
Figure 74: Western Europe Market Value (US$ Million) by Application, 2023 to 2033
Figure 75: Western Europe Market Value (US$ Million) by Technology, 2023 to 2033
Figure 76: Western Europe Market Value (US$ Million) by Country, 2023 to 2033
Figure 77: Western Europe Market Value (US$ Million) Analysis by Country, 2018 to 2033
Figure 78: Western Europe Market Volume (Units) Analysis by Country, 2018 to 2033
Figure 79: Western Europe Market Value Share (%) and BPS Analysis by Country, 2023 to 2033
Figure 80: Western Europe Market Y-o-Y Growth (%) Projections by Country, 2023 to 2033
Figure 81: Western Europe Market Value (US$ Million) Analysis by Product, 2018 to 2033
Figure 82: Western Europe Market Volume (Units) Analysis by Product, 2018 to 2033
Figure 83: Western Europe Market Value Share (%) and BPS Analysis by Product, 2023 to 2033
Figure 84: Western Europe Market Y-o-Y Growth (%) Projections by Product, 2023 to 2033
Figure 85: Western Europe Market Value (US$ Million) Analysis by Application, 2018 to 2033
Figure 86: Western Europe Market Volume (Units) Analysis by Application, 2018 to 2033
Figure 87: Western Europe Market Value Share (%) and BPS Analysis by Application, 2023 to 2033
Figure 88: Western Europe Market Y-o-Y Growth (%) Projections by Application, 2023 to 2033
Figure 89: Western Europe Market Value (US$ Million) Analysis by Technology, 2018 to 2033
Figure 90: Western Europe Market Volume (Units) Analysis by Technology, 2018 to 2033
Figure 91: Western Europe Market Value Share (%) and BPS Analysis by Technology, 2023 to 2033
Figure 92: Western Europe Market Y-o-Y Growth (%) Projections by Technology, 2023 to 2033
Figure 93: Western Europe Market Attractiveness by Product, 2023 to 2033
Figure 94: Western Europe Market Attractiveness by Application, 2023 to 2033
Figure 95: Western Europe Market Attractiveness by Technology, 2023 to 2033
Figure 96: Western Europe Market Attractiveness by Country, 2023 to 2033
Figure 97: Eastern Europe Market Value (US$ Million) by Product, 2023 to 2033
Figure 98: Eastern Europe Market Value (US$ Million) by Application, 2023 to 2033
Figure 99: Eastern Europe Market Value (US$ Million) by Technology, 2023 to 2033
Figure 100: Eastern Europe Market Value (US$ Million) by Country, 2023 to 2033
Figure 101: Eastern Europe Market Value (US$ Million) Analysis by Country, 2018 to 2033
Figure 102: Eastern Europe Market Volume (Units) Analysis by Country, 2018 to 2033
Figure 103: Eastern Europe Market Value Share (%) and BPS Analysis by Country, 2023 to 2033
Figure 104: Eastern Europe Market Y-o-Y Growth (%) Projections by Country, 2023 to 2033
Figure 105: Eastern Europe Market Value (US$ Million) Analysis by Product, 2018 to 2033
Figure 106: Eastern Europe Market Volume (Units) Analysis by Product, 2018 to 2033
Figure 107: Eastern Europe Market Value Share (%) and BPS Analysis by Product, 2023 to 2033
Figure 108: Eastern Europe Market Y-o-Y Growth (%) Projections by Product, 2023 to 2033
Figure 109: Eastern Europe Market Value (US$ Million) Analysis by Application, 2018 to 2033
Figure 110: Eastern Europe Market Volume (Units) Analysis by Application, 2018 to 2033
Figure 111: Eastern Europe Market Value Share (%) and BPS Analysis by Application, 2023 to 2033
Figure 112: Eastern Europe Market Y-o-Y Growth (%) Projections by Application, 2023 to 2033
Figure 113: Eastern Europe Market Value (US$ Million) Analysis by Technology, 2018 to 2033
Figure 114: Eastern Europe Market Volume (Units) Analysis by Technology, 2018 to 2033
Figure 115: Eastern Europe Market Value Share (%) and BPS Analysis by Technology, 2023 to 2033
Figure 116: Eastern Europe Market Y-o-Y Growth (%) Projections by Technology, 2023 to 2033
Figure 117: Eastern Europe Market Attractiveness by Product, 2023 to 2033
Figure 118: Eastern Europe Market Attractiveness by Application, 2023 to 2033
Figure 119: Eastern Europe Market Attractiveness by Technology, 2023 to 2033
Figure 120: Eastern Europe Market Attractiveness by Country, 2023 to 2033
Figure 121: South Asia and Pacific Market Value (US$ Million) by Product, 2023 to 2033
Figure 122: South Asia and Pacific Market Value (US$ Million) by Application, 2023 to 2033
Figure 123: South Asia and Pacific Market Value (US$ Million) by Technology, 2023 to 2033
Figure 124: South Asia and Pacific Market Value (US$ Million) by Country, 2023 to 2033
Figure 125: South Asia and Pacific Market Value (US$ Million) Analysis by Country, 2018 to 2033
Figure 126: South Asia and Pacific Market Volume (Units) Analysis by Country, 2018 to 2033
Figure 127: South Asia and Pacific Market Value Share (%) and BPS Analysis by Country, 2023 to 2033
Figure 128: South Asia and Pacific Market Y-o-Y Growth (%) Projections by Country, 2023 to 2033
Figure 129: South Asia and Pacific Market Value (US$ Million) Analysis by Product, 2018 to 2033
Figure 130: South Asia and Pacific Market Volume (Units) Analysis by Product, 2018 to 2033
Figure 131: South Asia and Pacific Market Value Share (%) and BPS Analysis by Product, 2023 to 2033
Figure 132: South Asia and Pacific Market Y-o-Y Growth (%) Projections by Product, 2023 to 2033
Figure 133: South Asia and Pacific Market Value (US$ Million) Analysis by Application, 2018 to 2033
Figure 134: South Asia and Pacific Market Volume (Units) Analysis by Application, 2018 to 2033
Figure 135: South Asia and Pacific Market Value Share (%) and BPS Analysis by Application, 2023 to 2033
Figure 136: South Asia and Pacific Market Y-o-Y Growth (%) Projections by Application, 2023 to 2033
Figure 137: South Asia and Pacific Market Value (US$ Million) Analysis by Technology, 2018 to 2033
Figure 138: South Asia and Pacific Market Volume (Units) Analysis by Technology, 2018 to 2033
Figure 139: South Asia and Pacific Market Value Share (%) and BPS Analysis by Technology, 2023 to 2033
Figure 140: South Asia and Pacific Market Y-o-Y Growth (%) Projections by Technology, 2023 to 2033
Figure 141: South Asia and Pacific Market Attractiveness by Product, 2023 to 2033
Figure 142: South Asia and Pacific Market Attractiveness by Application, 2023 to 2033
Figure 143: South Asia and Pacific Market Attractiveness by Technology, 2023 to 2033
Figure 144: South Asia and Pacific Market Attractiveness by Country, 2023 to 2033
Figure 145: East Asia Market Value (US$ Million) by Product, 2023 to 2033
Figure 146: East Asia Market Value (US$ Million) by Application, 2023 to 2033
Figure 147: East Asia Market Value (US$ Million) by Technology, 2023 to 2033
Figure 148: East Asia Market Value (US$ Million) by Country, 2023 to 2033
Figure 149: East Asia Market Value (US$ Million) Analysis by Country, 2018 to 2033
Figure 150: East Asia Market Volume (Units) Analysis by Country, 2018 to 2033
Figure 151: East Asia Market Value Share (%) and BPS Analysis by Country, 2023 to 2033
Figure 152: East Asia Market Y-o-Y Growth (%) Projections by Country, 2023 to 2033
Figure 153: East Asia Market Value (US$ Million) Analysis by Product, 2018 to 2033
Figure 154: East Asia Market Volume (Units) Analysis by Product, 2018 to 2033
Figure 155: East Asia Market Value Share (%) and BPS Analysis by Product, 2023 to 2033
Figure 156: East Asia Market Y-o-Y Growth (%) Projections by Product, 2023 to 2033
Figure 157: East Asia Market Value (US$ Million) Analysis by Application, 2018 to 2033
Figure 158: East Asia Market Volume (Units) Analysis by Application, 2018 to 2033
Figure 159: East Asia Market Value Share (%) and BPS Analysis by Application, 2023 to 2033
Figure 160: East Asia Market Y-o-Y Growth (%) Projections by Application, 2023 to 2033
Figure 161: East Asia Market Value (US$ Million) Analysis by Technology, 2018 to 2033
Figure 162: East Asia Market Volume (Units) Analysis by Technology, 2018 to 2033
Figure 163: East Asia Market Value Share (%) and BPS Analysis by Technology, 2023 to 2033
Figure 164: East Asia Market Y-o-Y Growth (%) Projections by Technology, 2023 to 2033
Figure 165: East Asia Market Attractiveness by Product, 2023 to 2033
Figure 166: East Asia Market Attractiveness by Application, 2023 to 2033
Figure 167: East Asia Market Attractiveness by Technology, 2023 to 2033
Figure 168: East Asia Market Attractiveness by Country, 2023 to 2033
Figure 169: Middle East and Africa Market Value (US$ Million) by Product, 2023 to 2033
Figure 170: Middle East and Africa Market Value (US$ Million) by Application, 2023 to 2033
Figure 171: Middle East and Africa Market Value (US$ Million) by Technology, 2023 to 2033
Figure 172: Middle East and Africa Market Value (US$ Million) by Country, 2023 to 2033
Figure 173: Middle East and Africa Market Value (US$ Million) Analysis by Country, 2018 to 2033
Figure 174: Middle East and Africa Market Volume (Units) Analysis by Country, 2018 to 2033
Figure 175: Middle East and Africa Market Value Share (%) and BPS Analysis by Country, 2023 to 2033
Figure 176: Middle East and Africa Market Y-o-Y Growth (%) Projections by Country, 2023 to 2033
Figure 177: Middle East and Africa Market Value (US$ Million) Analysis by Product, 2018 to 2033
Figure 178: Middle East and Africa Market Volume (Units) Analysis by Product, 2018 to 2033
Figure 179: Middle East and Africa Market Value Share (%) and BPS Analysis by Product, 2023 to 2033
Figure 180: Middle East and Africa Market Y-o-Y Growth (%) Projections by Product, 2023 to 2033
Figure 181: Middle East and Africa Market Value (US$ Million) Analysis by Application, 2018 to 2033
Figure 182: Middle East and Africa Market Volume (Units) Analysis by Application, 2018 to 2033
Figure 183: Middle East and Africa Market Value Share (%) and BPS Analysis by Application, 2023 to 2033
Figure 184: Middle East and Africa Market Y-o-Y Growth (%) Projections by Application, 2023 to 2033
Figure 185: Middle East and Africa Market Value (US$ Million) Analysis by Technology, 2018 to 2033
Figure 186: Middle East and Africa Market Volume (Units) Analysis by Technology, 2018 to 2033
Figure 187: Middle East and Africa Market Value Share (%) and BPS Analysis by Technology, 2023 to 2033
Figure 188: Middle East and Africa Market Y-o-Y Growth (%) Projections by Technology, 2023 to 2033
Figure 189: Middle East and Africa Market Attractiveness by Product, 2023 to 2033
Figure 190: Middle East and Africa Market Attractiveness by Application, 2023 to 2033
Figure 191: Middle East and Africa Market Attractiveness by Technology, 2023 to 2033
Figure 192: Middle East and Africa Market Attractiveness by Country, 2023 to 2033
In 2023, the dehydrated onions market is valued at USD 5,407.8 million.
Until 2033, the market will experience a 6.9% CAGR.
The market shall reach USD 10,571.6, million in 2033.
Europe is likely to generate 28.4% revenue in 2023.
Toshiba Corp., Emerson Network Power Inc. and, Clary Corp. are key market players.
Explore Similar Insights
Thank you!
You will receive an email from our Business Development Manager. Please be sure to check your SPAM/JUNK folder too.