Reports

- Global Locations -

Headquarters

Future Market Insights, Inc.

Christiana Corporate, 200
Continental Drive, Suite 401,
Newark, Delaware - 19713,
United States

T: +1-845-579-5705

Americas

Future Market Insights, Inc.

616 Corporate Way, Suite 2-9018,
Valley Cottage, NY 10989, United States

T: +1-347-918-3531

MEA

Future Market Insights

1602-6 Jumeirah Bay X2 Tower, Plot No: JLT-PH2-X2A,
Jumeirah Lakes Towers, Dubai,
United Arab Emirates

Europe

Future Market Insights

3rd Floor, 207 Regent Street,
W1B 3HH London
United Kingdom

T: + 44 (0) 20 8123 9659
D: +44 (0) 20 3287 4268

Asia Pacific

Future Market Insights

Office No. 401-A, 4th Floor,
VANTAGE 9, S.No. 36/1/1,
Baner, Pune 411045, India

Data Center Market Snapshot (2022-2032)

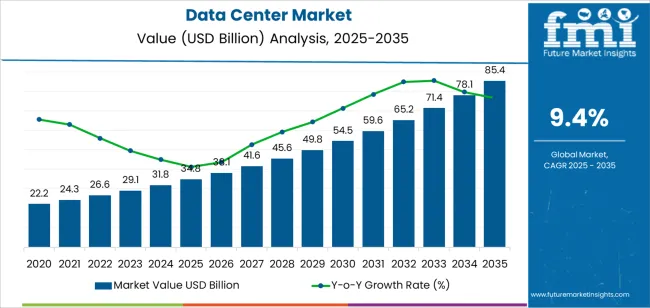
[370 Pages Report] The global data center market garnered a market value of US$ 101.79 Billion in 2022 and is expected to accumulate a market value of US$ 209.8 Billion by registering a CAGR of 7.5% in the forecast period 2022-2032.

Growth of the data center market can be attributed to exponential rise in data consumption and data generation by organizations across various industries. The market for data center registered a CAGR of 5.5% in the historical period 2017-2021.

Report Attribute Details
Estimated Base Year Value (2021) US$ 94.69 Billion
Expected Market Value (2022) US$ 101.79 Billion
Anticipated Forecast Value (2032) US$ 209.8 Billion
Projected Growth Rate (2022-2032) 7.5% CAGR

Don't pay for what you don't need

Customize your report by selecting specific countries or regions and save 30%!

2017-2021 Data Centers Demand Analysis Vs. Forecast 2022-2032

Between 2017 and 2021, global data center market registered a CAGR of 5.5%. The increasing adoption of small and mid-scale data centers has been enabling growth across various sectors.

Growth is also expected to accelerate amid the pandemic as the COVID-19 outbreak has pushed organizations towards digital transformation, thanks to the surge in remote working calls and the need for rapid mobilization of cloud computing to cope with a rise in demand for data.

Countries across the world reported intensified data demand during the pandemic, which underscored the importance of digital technology and data centers. Owing to these factors, the data center demand is likely to increase, expanding at a CAGR exceeding 7.5% throughout the 2022-2032 assessment period.

Which Are Some Prominent Drivers Of Data Center Market?

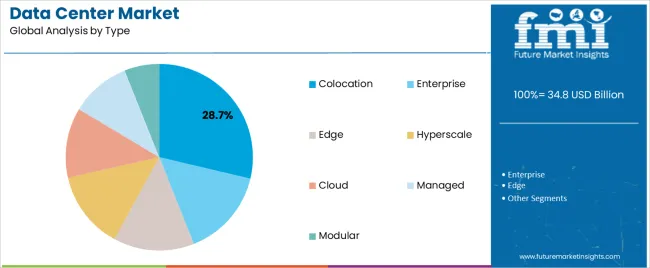
Data center collocation changing landscape for data centers

Data center colocation is a data center facility in which a business can rent space for equipment such as servers and other computing hardware. Data center colocation providers offer building (space), cooling, power units, bandwidth and physical security for customers to install their own servers and storage.

Colocation provides a high-performance environment for critical IT infrastructure. Rather than managing a data center, customers can focus more on their core business by collocating their data servers and take the benefits of 100% uptime SLA.

Additionally, colocation provides dedicated, private connection options to hundreds of network, cloud, and IT service providers to help streamline the architecture. Moreover, choosing a colocated, multi-tenant data center allows companies to scale their environments according to their specific needs.

Also, splitting the expenses of space and equipment with other companies offsets costs. Thus, various small and mid-sized companies are entering into this market space, which would in return will drive the growth of data center market.

Increasing Internet Bandwidth & Use of Data Consumption Enabling Data Center Market Growth

Globally, the internet continues to transform to how one connects with others, organize the flow of things, and share information. The internet has a huge influence on individual consumers and large economies alike. It has become an increasingly vital part of our day-to-day life.

As per Cisco analysis, nearly two-thirds of the global population will have Internet access by 2023. There will be 5.3 billion total Internet users by 2023, up from 3.9 billion in 2018. In the developing countries like Indonesia, Internet traffic will grow 4.9-fold from 2017 to 2022, a compound annual growth rate of 37%.

Developing countries are exhibiting high demand for social media, television, video content streaming, e-Commerce, and net banking, all of which require robust IT infrastructure and data networks. This has been supporting growth of IT infrastructure and data centers are at the heart of this growth. These countries also represent a key markets for several local and multinational data center providers and tech giants.

Internet of Things (IoT) Transforming Data Centers

Over the past few years, technological advancements are continue to occur at a high pace, allowing faster processing of data and enabling vast amounts of data storage. The introduction of IoT technology has totally transformed the design and deployment of data centers in the last two decades. It is estimated that IoT will include 35 billion units installed by 2022.

The deployment of IoT will generate large quantities of data that need to be processed and analyzed in real time. As more data is generated there will be a corresponding growth in demand for storage space.

Not only will this drive the demand for data centers but will lead to the advent of innovative ways for optimizing storage capacity with better servers and newer compression technologies, which would bring several growth opportunities for data center providers.

Sudip Saha
Sudip Saha

Principal Consultant

Talk to Analyst

Find your sweet spots for generating winning opportunities in this market.

What Are The Challenges Faced By The Data Center Market?

High Cost of Data Centers Continues to be a Key Challenge

One of the major factors hampering growth and adoption of data centers is the high cost associated with them. The cost associated with the manufacturing of servers and integration of all the components into one aggregately adds up to the cost, owing to which the overall cost of the product increases.

Thus, in spite of the low service costs and long life cycle of the product, the adoption of data centers has been restricted.

Region Wise Insights

Data shipment center accelerating growth of data center market in U.S.?

Localized data centers and investments cloud facilities accelerating growth of data centers

Until 2020, data center sales across the U.S. reported a Y-o-Y growth of over 2.7% to reach US$ 32.15 Bn. The U.S. has emerged as a highly lucrative market owing to surging demand from hyperscale cloud providers.

The data center shipment is increasing in the country due to the rising popularity of moving localized data center activity to colocation or cloud facilities. Moreover, the market is likely to experience a rise in edge data center computing to deliver services with low latency and high efficiency across the country.

According to current study, South Eastern U.S. is one of the major contributors to the U.S. data center market. States such as Virginia, Arizona, Illinois, Nevada, California, Texas, Ohio, Tennessee, Iowa, and North Carolina have received significant investments in recent years related to data center. The market is set to further aggrandize at a CAGR of nearly 4.5% through 2032.

Innovation and Digitization Creating Lucrative Opportunities for Data Center Market in U.K.?

Storage of consumer data making data centers essential in U.K.

With the fear of Brexit in their minds data center operators in the U.K. are shifting their infrastructure abroad. Brexit has brought several uncertainties among cloud providers in terms of storage and retrieval of customer data. European companies that are associated with the U.K. data center market are migrating workloads to Germany, Netherlands, France and other EU countries.

However, the UK is the leading colocation services market in Europe and comprises over 250 operational colocation data centers. According to the Tech Nation, in 2019, the UK tech industry received a funding of around US$13.2 billion to drive innovations and digitalization in the business sector. The growing demand for data center services from business and consumer end users are driving investment in UK data center market. The U.K. data center market is estimated to reach a valuation of 7,379.0 Mn by the end of 2032 by registering a CAGR of 10%.

Data Centers Ensuring Reliability and Security of Data in China?

Investment from top players in data centers surging growth of data center market in China

China Telecom, China Mobile, and China Unicom are currently owning the greatest number of data centers in the country, leveraging their operational history in the space.

China is focusing on taking the lead over global peers in data center construction with larger enterprises looking to scale up their data centers for ensuring the stability and reliability of data services as the application of 5G, internet of things, artificial intelligence generates the demand for computing power. Much of this growth has come from widespread adoption of data centers by government agencies during the last decade.

Alibaba announced in April 2020 that it would invest around US$ 28.26 Bn on its cloud infrastructure. Investment by some of the leading players is expected to aid the overall expansion of the market in China. Thus, China is estimated to record an incremental opportunity worth US$ 14.85 Bn during the forecast period.

Development of Smart Cities and IT Infrastructure Boosting Growth of Data Centers in India?

Investment from key players in data centers propelling growth of market

Growing investments towards the development of digital economy coupled with increased investor interest and stable long-term returns.

The rise in digital adoption set to fuel explosive growth for data center market in India. The increasing spending on smart cities is resulting in the growing need for IT infrastructure which is leading to the development of data centers in the country.

Leading tech players are continuously investing in India Data Center market space. For instance, Amazon is expected to invest US$1.6 billion towards the construction of two hyperscale Data Centres in Hyderabad. Moreover, Microsoft is planning to integrate its Azure cloud platform with Reliance Jio’s proposed Data Centres in Maharashtra and Gujarat.

The telecom industry in India is witnessing the high growth with a CAGR of 10% and is estimated to record the incremental opportunity worth US$ 2.7 Bn during the forecast period.

How Big is Scope for Data Center Market in Brazil?

Brazil has been exhibiting strong growth owing to the increasing penetration of cloud vendors, government regulations for local data security and increasing investments by players is driving the growth in positive direction. Moreover, the introduction of the General Law of Protection of Personal Data (LGPD) in August 2020, is expected to increase the cloud service and data centre service adoption in the country.

As per Cloudscene, there are almost 120 data centres in the country. Moreover, according to Brazilian Software Association, Brazil is Latin American’s largest technology ecosystem. According to estimates the IT investment in Latin America witnessed growth by around 4% to 5% in 2020. This is expected to provide a massive boost to cloud computing, and hence will generate the demand for data center market.

Get the data you need at a Fraction of the cost

Personalize your report by choosing insights you need
and save 40%!

Category-Wise Insights

Demand for Customized Business Needs Propelling Growth of Small Data Centers?

Small data centers helping in saving expenditure

The presence of a large number of small and medium enterprises (SMEs) globally as compared to large enterprises is driving the growth of small data centers. The rise in number of SMEs globally has resulted in the increasing demand for small data centers that cater to the customized business needs of small enterprises. These enterprises do not require large data center spaces due to limited IT requirements and budgetary constraints.

However, the term small data center does not always mean the implementation of a data center in a small business. Even large enterprise creates and deploys multiple small data centers within its premises, depending upon the business needs and operational feasibility.

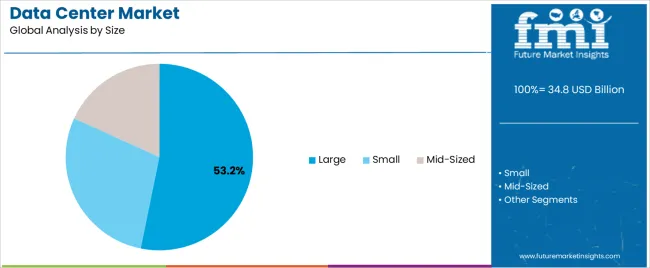
The deployment of small data center can save tens of thousands of dollars simply through efficient choices in management practices, IT hardware, power, and cooling infrastructure. Thus, small data centers are expected to possess 45% market share for data centers in the forecast period 2022-2032.

Cloud and social Media Services Heavily Depending on Data Centers to Improve Performance?

Data centers offering big data analytics along with generating performance metrics for entertainment industry

By industry, media and entertainment industry is expected to show significant growth in the coming years, while IT and Telecom is expected to remain dominant through the forecast period. The demand for cloud and social media services showing no sign of decline, several tech players are investing in the construction of more of these massive facilities.

These facilities will be crucial to managing the massive amounts of data generated by media and entertainment industry, big data social media analytics, and the information being gathered by IoT devices, which provides huge opportunities for data center manufactures to cater in media and entertainment industry.

Thus, media and entertainment industry is expected to possess 35% market share for data center market in the assessment period 2022-2032.

Start-Ups For Data Centers Market

Key start-up players in the data centers market are eStruxture, Vanatge Data Center Services, Hewlett Packard Enterprise

  • eStruxture, a key player in the data center market is focusing on offering cloud-neutral data center solutions for enterprise applications.
  • Vanatge Data Center Services customizes data center services and solutions. The company is focusing on offering planning, designing and migrating data for different data centers

Market Competition

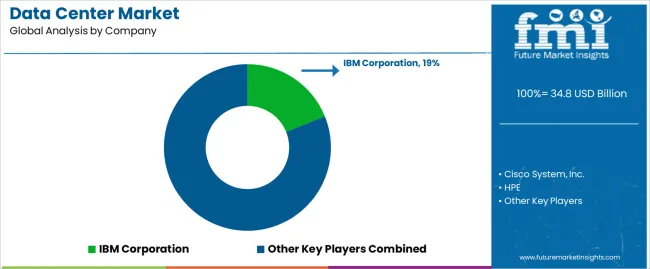
Key players in the data center market are IBM Corporation, Cisco System, Inc, HPE, Dell Technologies, Hitachi Ltd, NTT Communications, Schneider Electric, Comarch SA, ABB, Huawei Technologies Co., Ltd.

The data center market is highly concentrated because the majority share is held by leading data center providers. The companies that hold market share of 10% to 12% are tier-1 companies and this group includes players like Cisco Systems, HPE, and Dell Technologies.

The companies with market share of above 7% and below 12% are the promising players. These companies are likely to showcase a quick growth trend and harness the opportunities that the global market has to offer to accommodate business expansion and revenue generation. This group includes NTT communications, Huawei Technologies, and Fujitsu.

Companies that holds a relatively lower share, worth less than 7% are strategizing to attract new clientele in foreign markets. Some of the companies in this group are Rackspace, Hitachi, and KDDI.

According to FMI, market players rely on multiple expansion strategies to deepen penetration across lucrative markets. These strategies include product launches, collaborations with key players, partnerships, acquisitions and strengthening of regional and global distribution networks.

  • In April 2021, IBM International launched advanced storage solutions that are designed to simplify data accessibility & availability across hybrid clouds. Through this, the company is planning to store and offer actionable data.
  • In August 2022, Oracle extended its cloud agreement with AT&T for five years. The deal will be built on Oracle Cloud Infrastructure that will help in eliminating manual processes and make data saving and accessibility easier.

Report Scope

Report Attribute Details
Market Value in 2022 US$ 101.79 Billion
Market Value in 2032 US$ 209.8 Billion
Growth Rate CAGR of 7.5% from 2022 to 2032
Base Year for Estimation 2021
Historical Data 2017-2021
Forecast Period 2022-2032
Quantitative Units Revenue in USD Billion and CAGR from 2022-2032
Report Coverage Revenue Forecast, Volume Forecast, Company Ranking, Competitive Landscape, Growth Factors, Trends and Pricing Analysis
Segments Covered
  • Product Type
  • Application
  • Region
Regions Covered
  • North America
  • Latin America
  • Europe
  • East Asia
  • South Asia & Pacific
  • Middle East & Africa
Key Countries Profiled
  • USA
  • Canada
  • Brazil
  • Argentina
  • Germany
  • UK
  • France
  • Spain
  • Italy
  • Nordics
  • BENELUX
  • Australia & New Zealand
  • China
  • India
  • ASEAN
  • GCC
  • South Africa
Key Companies Profiled
  • IBM Corporation
  • Cisco System, Inc.
  • HPE
  • Dell Technologies
  • Hitachi Ltd
  • NTT Communications
  • Schneider Electric
  • Comarch SA
  • ABB
  • Huawei Technologies Co., Ltd.

Key Segments Profiled In The Data Center Market Industry Survey

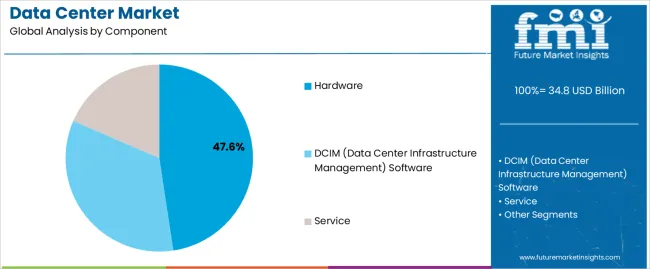
Data Center by Component:

  • Data Center by Hardware
    • Data Center Power Systems
    • Data Center Racks
    • Data Center Servers
    • Data Center Networking Devices
    • Others
  • Data Center Software
  • Data Center Service
    • Professional Services
      • Integration & Implementation
      • Consulting
      • Support & Maintenance
    • Managed Services

Data Center by Size:

  • Small Data Center
  • Mid-Sized Data Center
  • Large Data Center

Data Center Market by Industry:

  • Data Center for IT & Telecom
  • Data Center for BFSI
  • Data Center for Manufacturing
  • Data Center for Healthcare
  • Data Center for Media & Entertainment
  • Data Center for Others

Data Center by Region:

  • North America Data Center Market
  • Latin America Data Center Market
  • Europe Data Center Market
  • East Asia Data Center Market
  • South Asia & Pacific Data Center Market
  • Middle East & Africa Data Center Market

Frequently Asked Questions

FMI projects the global data center market to expand at a 7.5% value CAGR by 2032

The global data center market is estimated at a market value of US$ 101.79 Billion

The global data center market is expected to garner a market value of US$ 209.8 Billion

The U.K. data center market is estimated to reach a valuation of 7,379.0 Mn by the end of 2032 by registering a CAGR of 10%.

AkzoNobel N.V, Asahi Glass Co. Ltd., Dow Chemical Company and Solvay S.A are some prominent data center manufacturers

The market is set to further aggrandize at a CAGR of nearly 4.5% through 2032.

China is estimated to record an incremental opportunity worth US$ 14.85 Bn during the forecast period.

Media and entertainment industry is expected to possess 35% market share for data center market in the assessment period 2022-2032.

Small data centers are expected to possess 45% market share for data centers in the forecast period 2022-2032.

Table of Content

1. Executive Summary

    1.1. Global Market Outlook

    1.2. Demand Side Trends

    1.3. Supply Side Trends

    1.4. Analysis and Recommendations

2. Market Overview

    2.1. Market Coverage / Taxonomy

    2.2. Market Definition / Scope / Limitations

3. Key Market Trends

    3.1. Key Trends Impacting the Market

    3.2. Product Innovation / Development Trends

    3.3. Key Use-Case Analysis & Product Potential

    3.4. Key Success Factors

4. Market - Pricing Analysis

    4.1. Pricing Analysis, By Solution

    4.2. Global Average Pricing Analysis Benchmark

5. COVID-19 Pandemic Crisis Impact Analysis

    5.1. Impact of COVID-19 Pandemic Crisis on Market Growth

        5.1.1. Pre-COVID-19 Analysis

        5.1.2. Post-COVID-19 Analysis

    5.2. Expected Recovery Scenario

    5.3. Key Action Points for Solution Vendors

6. Market Structure Analysis

    6.1. Market Analysis by Tier of Companies (Data Center)

    6.2. Market Concentration

    6.3. Market Share Analysis of Top Players

    6.4. Market Presence Analysis

        6.4.1. Regional footprint by Players

        6.4.2. Product footprint by Players

    6.5. Channel footprint by Players

7. Global Market Demand (in Value or Size in US$ Mn) Analysis 2017–2021 and Forecast, 2022–2032

    7.1. Historical Market Value (US$ Mn) Analysis, 2017–2021

    7.2. Current and Future Market Value (US$ Mn) Projections, 2022–2032

        7.2.1. Y-o-Y Growth Trend Analysis

        7.2.2. Absolute $ Opportunity Analysis

8. Global Solution Market Demand (in Volume in ‘000 Units) Analysis 2017–2021 and Forecast, 2022–2032

    8.1. Historical Market Value (‘000 Units) Analysis, 2017–2021

    8.2. Current and Future Market Value (‘000 Units) Projections, 2022–2032

        8.2.1. Y-o-Y Growth Trend Analysis

        8.2.2. Absolute $ Opportunity Analysis

9. Market Background

    9.1. Macro-Economic Factors

    9.2. Forecast Factors - Relevance & Impact

    9.3. Value Chain

    9.4. Market Dynamics

        9.4.1. Drivers

        9.4.2. Restraints

        9.4.3. Opportunity Analysis

10. Global Market Analysis 2017–2021 and Forecast 2022–2032, by Component

    10.1. Introduction / Key Findings

    10.2. Historical Market Size (US$ Mn) Analysis By Component, 2017–2021

    10.3. Current and Future Market Size (US$ Mn)Analysis and Forecast By Component, 2022–2032

        10.3.1. Hardware

            10.3.1.1. Power Systems

            10.3.1.2. Racks

            10.3.1.3. Servers

            10.3.1.4. Networking Devices

            10.3.1.5. Others

        10.3.2. Software

        10.3.3. Service

            10.3.3.1. Professional Services

                10.3.3.1.1. Integration & Implementation

                10.3.3.1.2. Consulting

                10.3.3.1.3. Support & Maintenance

            10.3.3.2. Managed Services

11. Global Market Analysis 2017–2021 and Forecast 2022–2032, by Size

    11.1. Introduction / Key Findings

    11.2. Historical Market Size (US$ Mn) Analysis By Size, 2017–2021

    11.3. Current and Future Market Size (US$ Mn) Analysis and Forecast By Size, 2022–2032

        11.3.1. Small Data Center

        11.3.2. Mid-Sized Data Center

        11.3.3. Large Data Center

12. Global Market Analysis 2017–2021 and Forecast 2022–2032, by Industry

    12.1. Introduction / Key Findings

    12.2. Historical Market Size (US$ Mn) Analysis By Industry, 2017–2021

    12.3. Current and Future Market Size (US$ Mn) Analysis and Forecast By Industry, 2022–2032

        12.3.1. IT & Telecom

        12.3.2. BFSI

        12.3.3. Manufacturing

        12.3.4. Healthcare

        12.3.5. Media & Entertainment

        12.3.6. Others

13. Global Market Analysis 2017–2021 and Forecast 2022–2032, by Region

    13.1. Introduction

    13.2. Historical Market Size (US$ Mn) Analysis By Region, 2017–2021

    13.3. Current Market Size (US$ Mn) Analysis and Forecast By Region, 2022–2032

        13.3.1. North America

        13.3.2. Latin America

        13.3.3. Europe

        13.3.4. East Asia

        13.3.5. South Asia & Pacific

        13.3.6. Middle East & Africa

    13.4. Market Attractiveness Analysis By Region

14. North America Market Analysis 2017–2021 and Forecast 2022–2032

    14.1. Introduction

    14.2. Historical Market Size (US$ Mn) Trend Analysis By Market Taxonomy, 2017–2021

    14.3. Market Size (US$ Mn) Forecast By Market Taxonomy, 2022–2032

        14.3.1. By Country

            14.3.1.1. U.S.

            14.3.1.2. Canada

        14.3.2. By Component

        14.3.3. By Size

        14.3.4. By Industry

    14.4. Market Attractiveness Analysis

        14.4.1. By Country

        14.4.2. By Component

        14.4.3. By Size

        14.4.4. By Industry

    14.5. Market Trends

    14.6. Key Market Participants - Intensity Mapping

15. Latin America Market Analysis 2017–2021 and Forecast 2022–2032

    15.1. Introduction

    15.2. Historical Market Size (US$ Mn) Trend Analysis By Market Taxonomy, 2017–2021

    15.3. Market Size (US$ Mn) Forecast By Market Taxonomy, 2022–2032

        15.3.1. By Country

            15.3.1.1. Brazil

            15.3.1.2. Mexico

            15.3.1.3. Rest of Latin America

        15.3.2. By Component

        15.3.3. By Size

        15.3.4. By Industry

    15.4. Market Attractiveness Analysis

        15.4.1. By Country

        15.4.2. By Component

        15.4.3. By Size

        15.4.4. By Industry

    15.5. Market Trends

    15.6. Key Market Participants - Intensity Mapping

16. Europe Market Analysis 2017–2021 and Forecast 2022–2032

    16.1. Introduction

    16.2. Historical Market Size (US$ Mn) Trend Analysis By Market Taxonomy, 2017–2021

    16.3. Market Size (US$ Mn) Forecast By Market Taxonomy, 2022–2032

        16.3.1. By Country

            16.3.1.1. Germany

            16.3.1.2. Italy

            16.3.1.3. France

            16.3.1.4. U.K.

            16.3.1.5. Spain

            16.3.1.6. BENELUX

            16.3.1.7. Russia

            16.3.1.8. Rest of Europe

        16.3.2. By Component

        16.3.3. By Size

        16.3.4. By Industry

    16.4. Market Attractiveness Analysis

        16.4.1. By Country

        16.4.2. By Component

        16.4.3. By Size

        16.4.4. By Industry

    16.5. Market Trends

    16.6. Key Market Participants - Intensity Mapping

17. East Asia Market Analysis 2017–2021 and Forecast 2022–2032

    17.1. Introduction

    17.2. Historical Market Size (US$ Mn) Trend Analysis By Market Taxonomy, 2017–2021

    17.3. Market Size (US$ Mn) Forecast By Market Taxonomy, 2022–2032

        17.3.1. By Country

            17.3.1.1. China

            17.3.1.2. Japan

            17.3.1.3. South Korea

        17.3.2. By Component

        17.3.3. By Size

        17.3.4. By Industry

    17.4. Market Attractiveness Analysis

        17.4.1. By Country

        17.4.2. By Component

        17.4.3. By Size

        17.4.4. By Industry

    17.5. Market Trends

    17.6. Key Market Participants - Intensity Mapping

18. South Asia & Pacific Market Analysis 2017–2021 and Forecast 2022–2032

    18.1. Introduction

    18.2. Historical Market Size (US$ Mn) Trend Analysis By Market Taxonomy, 2017–2021

    18.3. Market Size (US$ Mn) Forecast By Market Taxonomy, 2022–2032

        18.3.1. By Country

            18.3.1.1. India

            18.3.1.2. Thailand

            18.3.1.3. Indonesia

            18.3.1.4. Malaysia

            18.3.1.5. Oceania

            18.3.1.6. Rest of South Asia & Pacific

        18.3.2. By Component

        18.3.3. By Size

        18.3.4. By Industry

    18.4. Market Attractiveness Analysis

        18.4.1. By Country

        18.4.2. By Component

        18.4.3. By Size

        18.4.4. By Industry

    18.5. Market Trends

    18.6. Key Market Participants - Intensity Mapping

19. Middle East and Africa Market Analysis 2017–2021 and Forecast 2022–2032

    19.1. Introduction

    19.2. Historical Market Size (US$ Mn) Trend Analysis By Market Taxonomy, 2017–2021

    19.3. Market Size (US$ Mn) Forecast By Market Taxonomy, 2022–2032

        19.3.1. By Country

            19.3.1.1. GCC Countries

            19.3.1.2. Turkey

            19.3.1.3. Northern Africa

            19.3.1.4. South Africa

            19.3.1.5. Rest of Middle East and Africa

        19.3.2. By Component

        19.3.3. By Size

        19.3.4. By Industry

    19.4. Market Attractiveness Analysis

        19.4.1. By Country

        19.4.2. By Component

        19.4.3. By Size

        19.4.4. By Industry

    19.5. Market Trends

    19.6. Key Market Participants - Intensity Mapping

20. Key and Emerging Countries Market Analysis

    20.1. U.S. Market Analysis

        20.1.1. By Component

        20.1.2. By Size

        20.1.3. By Industry

    20.2. Canada Market Analysis

        20.2.1. By Component

        20.2.2. By Size

        20.2.3. By Industry

    20.3. Mexico Market Analysis

        20.3.1. By Component

        20.3.2. By Size

        20.3.3. By Industry

    20.4. Brazil Market Analysis

        20.4.1. By Component

        20.4.2. By Size

        20.4.3. By Industry

    20.5. Germany Market Analysis

        20.5.1. By Component

        20.5.2. By Size

        20.5.3. By Industry

    20.6. France Market Analysis

        20.6.1. By Component

        20.6.2. By Size

        20.6.3. By Industry

    20.7. Italy Market Analysis

        20.7.1. By Component

        20.7.2. By Size

        20.7.3. By Industry

    20.8. Spain Market Analysis

        20.8.1. By Component

        20.8.2. By Size

        20.8.3. By Industry

    20.9. U.K. Market Analysis

        20.9.1. By Component

        20.9.2. By Size

        20.9.3. By Industry

    20.10. BENELUX Market Analysis

        20.10.1. By Component

        20.10.2. By Size

        20.10.3. By Industry

    20.11. Russia Market Analysis

        20.11.1. By Component

        20.11.2. By Size

        20.11.3. By Industry

    20.12. China Market Analysis

        20.12.1. By Component

        20.12.2. By Size

        20.12.3. By Industry

    20.13. Japan Market Analysis

        20.13.1. By Component

        20.13.2. By Size

        20.13.3. By Industry

    20.14. S. Korea Market Analysis

        20.14.1. By Component

        20.14.2. By Size

        20.14.3. By Industry

    20.15. India Market Analysis

        20.15.1. By Component

        20.15.2. By Size

        20.15.3. By Industry

    20.16. Thailand Market Analysis

        20.16.1. By Component

        20.16.2. By Size

        20.16.3. By Industry

    20.17. Malaysia Market Analysis

        20.17.1. By Component

        20.17.2. By Size

        20.17.3. By Industry

    20.18. Indonesia Market Analysis

        20.18.1. By Component

        20.18.2. By Size

        20.18.3. By Industry

    20.19. Australia and New Zealand Market Analysis

        20.19.1. By Component

        20.19.2. By Size

        20.19.3. By Industry

    20.20. GCC Countries Market Analysis

        20.20.1. By Component

        20.20.2. By Size

        20.20.3. By Industry

    20.21. Turkey Market Analysis

        20.21.1. By Component

        20.21.2. By Size

        20.21.3. By Industry

    20.22. South Africa Market Analysis

        20.22.1. By Component

        20.22.2. By Size

        20.22.3. By Industry

21. Competition Analysis

    21.1. Competition Dashboard

    21.2. Pricing Analysis by Competition

    21.3. Competition Benchmarking

    21.4. Competition Deep Dive

        21.4.1. IBM Corporation

            21.4.1.1. Overview

            21.4.1.2. Product Portfolio

            21.4.1.3. Profitability by Market Segments (Product/Channel/Region)

            21.4.1.4. Sales Footprint

            21.4.1.5. Strategy Overview

                21.4.1.5.1. Marketing Strategy

                21.4.1.5.2. Product Strategy

                21.4.1.5.3. Channel Strategy

        21.4.2. Cisco System, Inc.

            21.4.2.1. Overview

            21.4.2.2. Product Portfolio

            21.4.2.3. Profitability by Market Segments (Product/Channel/Region)

            21.4.2.4. Sales Footprint

            21.4.2.5. Strategy Overview

                21.4.2.5.1. Marketing Strategy

                21.4.2.5.2. Product Strategy

                21.4.2.5.3. Channel Strategy

        21.4.3. HPE

            21.4.3.1. Overview

            21.4.3.2. Product Portfolio

            21.4.3.3. Profitability by Market Segments (Product/Channel/Region)

            21.4.3.4. Sales Footprint

            21.4.3.5. Strategy Overview

                21.4.3.5.1. Marketing Strategy

                21.4.3.5.2. Product Strategy

                21.4.3.5.3. Channel Strategy

        21.4.4. Dell Technologies

            21.4.4.1. Overview

            21.4.4.2. Product Portfolio

            21.4.4.3. Profitability by Market Segments (Product/Channel/Region)

            21.4.4.4. Sales Footprint

            21.4.4.5. Strategy Overview

                21.4.4.5.1. Marketing Strategy

                21.4.4.5.2. Product Strategy

                21.4.4.5.3. Channel Strategy

        21.4.5. Hitachi Ltd.

            21.4.5.1. Overview

            21.4.5.2. Product Portfolio

            21.4.5.3. Profitability by Market Segments (Product/Channel/Region)

            21.4.5.4. Sales Footprint

            21.4.5.5. Strategy Overview

                21.4.5.5.1. Marketing Strategy

                21.4.5.5.2. Product Strategy

                21.4.5.5.3. Channel Strategy

        21.4.6. NTT Communications

            21.4.6.1. Overview

            21.4.6.2. Product Portfolio

            21.4.6.3. Profitability by Market Segments (Product/Channel/Region)

            21.4.6.4. Sales Footprint

            21.4.6.5. Strategy Overview

                21.4.6.5.1. Marketing Strategy

                21.4.6.5.2. Product Strategy

                21.4.6.5.3. Channel Strategy

        21.4.7. Schneider Electric

            21.4.7.1. Overview

            21.4.7.2. Product Portfolio

            21.4.7.3. Profitability by Market Segments (Product/Channel/Region)

            21.4.7.4. Sales Footprint

            21.4.7.5. Strategy Overview

                21.4.7.5.1. Marketing Strategy

                21.4.7.5.2. Product Strategy

                21.4.7.5.3. Channel Strategy

        21.4.8. Comarch SA

            21.4.8.1. Overview

            21.4.8.2. Product Portfolio

            21.4.8.3. Profitability by Market Segments (Product/Channel/Region)

            21.4.8.4. Sales Footprint

            21.4.8.5. Strategy Overview

                21.4.8.5.1. Marketing Strategy

                21.4.8.5.2. Product Strategy

                21.4.8.5.3. Channel Strategy

        21.4.9. ABB

            21.4.9.1. Overview

            21.4.9.2. Product Portfolio

            21.4.9.3. Profitability by Market Segments (Product/Channel/Region)

            21.4.9.4. Sales Footprint

            21.4.9.5. Strategy Overview

                21.4.9.5.1. Marketing Strategy

                21.4.9.5.2. Product Strategy

                21.4.9.5.3. Channel Strategy

        21.4.10. Huawei Technologies Co., Ltd.

            21.4.10.1. Overview

            21.4.10.2. Product Portfolio

            21.4.10.3. Profitability by Market Segments (Product/Channel/Region)

            21.4.10.4. Sales Footprint

            21.4.10.5. Strategy Overview

                21.4.10.5.1. Marketing Strategy

                21.4.10.5.2. Product Strategy

                21.4.10.5.3. Channel Strategy

22. Assumptions and Acronyms Used

23. Research Methodology

Don't pay for what you don't need

Customize your report by selecting specific countries or regions and save 30%!

List of Tables

Table 1: Global Market Value (US$ Mn) Analysis by Component, 2017-2021

Table 2: Global Market Value (US$ Mn) Analysis by Component, 2022-2032

Table 3: Global Market Volume (‘000 Units) Analysis by Component, 2017-2021

Table 4: Global Market Value (‘000 Units) Analysis by Component, 2022-2032

Table 5: Global Market Value (US$ Mn) Analysis by Size, 2017-2021

Table 6: Global Market Value (US$ Mn) Analysis by Size, 2022-2032

Table 7: Global Market Value (US$ Mn) Analysis by Industry, 2017-2021

Table 8: Global Market Value (US$ Mn) Analysis by Industry, 2022-2032

Table 9: Global Market Value (US$ Mn) Analysis by Region, 2017-2021

Table 10: Global Market Value (US$ Mn) Analysis by Region, 2022-2032

Table 11: North America Market Value (US$ Mn) Analysis by Component, 2017-2021

Table 12: North America Market Value (US$ Mn) Analysis by Component, 2022-2032

Table 13: North America Market Value (US$ Mn) Analysis by Size, 2017-2021

Table 14: North America Market Value (US$ Mn) Analysis by Size, 2022-2032

Table 15: North America Market Value (US$ Mn) Analysis by Industry, 2017-2021

Table 16: North America Market Value (US$ Mn) Analysis by Industry, 2022-2032

Table 17: North America Market Value (US$ Mn) Analysis by Country, 2017-2021

Table 18: North America Market Value (US$ Mn) Analysis by Country, 2022-2032

Table 19: Latin America Market Value (US$ Mn) Analysis by Component, 2017-2021

Table 20: Latin America Market Value (US$ Mn) Analysis by Component, 2022-2032

Table 21: Latin America Market Value (US$ Mn) Analysis by Size, 2017-2021

Table 22: Latin America Market Value (US$ Mn) Analysis by Size, 2022-2032

Table 23: Latin America Market Value (US$ Mn) Analysis by Industry, 2017-2021

Table 24: Latin America Market Value (US$ Mn) Analysis by Industry, 2022-2032

Table 25: Latin America Market Value (US$ Mn) Analysis by Country, 2017-2021

Table 26: Latin America Market Value (US$ Mn) Analysis by Country, 2022-2032

Table 27: Europe Market Value (US$ Mn) Analysis by Component, 2017-2021

Table 28: Europe Market Value (US$ Mn) Analysis by Component, 2022-2032

Table 29: Europe Market Value (US$ Mn) Analysis by Size, 2017-2021

Table 30: Europe Market Value (US$ Mn) Analysis by Size, 2022-2032

Table 31: Europe Market Value (US$ Mn) Analysis by Industry, 2017-2021

Table 32: Europe Market Value (US$ Mn) Analysis by Industry, 2022-2032

Table 33: Europe Market Value (US$ Mn) Analysis by Country, 2017-2021

Table 34: Europe Market Value (US$ Mn) Analysis by Country, 2022-2032

Table 35: East Asia Market Value (US$ Mn) Analysis by Component, 2017-2021

Table 36: East Asia Market Value (US$ Mn) Analysis by Component, 2022-2032

Table 37: East Asia Market Value (US$ Mn) Analysis by Size, 2017-2021

Table 38: East Asia Market Value (US$ Mn) Analysis by Size, 2022-2032

Table 39: East Asia Market Value (US$ Mn) Analysis by Industry, 2017-2021

Table 40: East Asia Market Value (US$ Mn) Analysis by Industry, 2022-2032

Table 41: East Asia Market Value (US$ Mn) Analysis by Country, 2017-2021

Table 42: East Asia Market Value (US$ Mn) Analysis by Country, 2022-2032

Table 43: South Asia & Pacific Market Value (US$ Mn) Analysis by Component, 2017-2021

Table 44: South Asia & Pacific Market Value (US$ Mn) Analysis by Component, 2022-2032

Table 45: South Asia & Pacific Market Value (US$ Mn) Analysis by Size, 2017-2021

Table 46: South Asia & Pacific Market Value (US$ Mn) Analysis by Size, 2022-2032

Table 47: South Asia & Pacific Market Value (US$ Mn) Analysis by Industry, 2017-2021

Table 48: South Asia & Pacific Market Value (US$ Mn) Analysis by Industry, 2022-2032

Table 49: South Asia & Pacific Market Value (US$ Mn) Analysis by Country, 2017-2021

Table 50: South Asia & Pacific Market Value (US$ Mn) Analysis by Country, 2022-2032

Table 51: Middle East & Africa Market Value (US$ Mn) Analysis by Component, 2017-2021

Table 52: Middle East & Africa Market Value (US$ Mn) Analysis by Component, 2022-2032

Table 53: Middle East & Africa Market Value (US$ Mn) Analysis by Size, 2017-2021

Table 54: Middle East & Africa Market Value (US$ Mn) Analysis by Size, 2022-2032

Table 55: Middle East & Africa Market Value (US$ Mn) Analysis by Industry, 2017-2021

Table 56: Middle East & Africa Market Value (US$ Mn) Analysis by Industry, 2022-2032

Table 57: Middle East & Africa Market Value (US$ Mn) Analysis by Country, 2017-2021

Table 58: Middle East & Africa Market Value (US$ Mn) Analysis by Country, 2022-2032
Sudip Saha
Sudip Saha

Principal Consultant

Talk to Analyst

Find your sweet spots for generating winning opportunities in this market.

List of Charts

Figure 01: Global Market Absolute $ Opportunity (US$ Mn), 2022-2032

Figure 02: Global Market Size and Y-o-Y Growth Rate from 2022-2032

Figure 03: Global Market Volume in Units and Y-o-Y Growth Rate from 2022-2032

Figure 04: Global Market Value (US$ Mn), 2017-2021

Figure 05: Global Market Value (US$ Mn), 2022-2032

Figure 06: Global Market Share Analysis by Component– 2022 & 2032

Figure 07: Global Market Y-o-Y Growth by Component, 2022-2032

Figure 08: Global Market Attractiveness Analysis by Component, 2022-2032

Figure 09: Global Market Share Analysis by Size– 2022 & 2032

Figure 10: Global Market Y-o-Y Growth by Size, 2022-2032

Figure 11: Global Market Attractiveness Analysis by Size, 2022-2032

Figure 12: Global Market Share Analysis by Industry – 2022 & 2032

Figure 13: Global Market Y-o-Y Growth by Industry, 2022-2032

Figure 14: Global Market Attractiveness Analysis by Industry, 2022-2032

Figure 15: Global Market Share Analysis by Region – 2022 & 2032

Figure 16: Global Market Y-o-Y Growth by Region, 2022-2032

Figure 17: Global Market Attractiveness Analysis by Region, 2022-2032

Figure 18: North America Market Absolute $ Opportunity (US$ Mn), 2017-2032

Figure 19: Latin America Market Absolute $ Opportunity (US$ Mn), 2017-2032

Figure 20: Europe Market Absolute $ Opportunity (US$ Mn), 2017-2032

Figure 21: East Asia Market Absolute $ Opportunity (US$ Mn), 2017-2032

Figure 22: South Asia & Pacific Market Absolute $ Opportunity (US$ Mn), 2017-2032

Figure 23: Middle East & Africa Market Absolute $ Opportunity (US$ Mn), 2017-2032

Figure 24: North America Market Value (US$ Mn), 2017-2021

Figure 25: North America Market Value (US$ Mn), 2022-2032

Figure 26: North America Market Share Analysis by Component– 2022 & 2032

Figure 27: North America Market Y-o-Y Growth by Component, 2022-2032

Figure 28: North America Market Attractiveness Analysis by Component, 2022-2032

Figure 29: North America Market Share Analysis by Size– 2022 & 2032

Figure 30: North America Market Y-o-Y Growth by Size, 2022-2032

Figure 31: North America Market Attractiveness Analysis by Size, 2022-2032

Figure 32: North America Market Share Analysis by Industry – 2022 & 2032

Figure 33: North America Market Y-o-Y Growth by Industry, 2022-2032

Figure 34: North America Market Attractiveness Analysis by Industry, 2022-2032

Figure 35: North America Market Share Analysis by Country – 2022 & 2032

Figure 36: North America Market Y-o-Y Growth by Country, 2022-2032

Figure 37: North America Market Attractiveness Analysis by Country, 2022-2032

Figure 38: U.S. Market Absolute $ Opportunity (US$ Mn), 2017-2032

Figure 39: Canada Market Absolute $ Opportunity (US$ Mn), 2017-2032

Figure 40: Latin America Market Value (US$ Mn), 2017-2021

Figure 41: Latin America Market Value (US$ Mn), 2022-2032

Figure 42: Latin America Market Share Analysis by Component– 2022 & 2032

Figure 43: Latin America Market Y-o-Y Growth by Component, 2022-2032

Figure 44: Latin America Market Attractiveness Analysis by Component, 2022-2032

Figure 45: Latin America Market Share Analysis by Size– 2022 & 2032

Figure 46: Latin America Market Y-o-Y Growth by Size, 2022-2032

Figure 47: Latin America Market Attractiveness Analysis by Size, 2022-2032

Figure 48: Latin America Market Share Analysis by Industry – 2022 & 2032

Figure 49: Latin America Market Y-o-Y Growth by Industry, 2022-2032

Figure 50: Latin America Market Attractiveness Analysis by Industry, 2022-2032

Figure 51: Latin America Market Share Analysis by Country – 2022 & 2032

Figure 52: Latin America Market Y-o-Y Growth by Country, 2022-2032

Figure 53: Latin America Market Attractiveness Analysis by Country, 2022-2032

Figure 54: Brazil Market Absolute $ Opportunity (US$ Mn), 2017-2021

Figure 55: Mexico Market Absolute $ Opportunity (US$ Mn), 2017-2021

Figure 56: Rest of LA Market Absolute $ Opportunity (US$ Mn), 2017-2021

Figure 57: Europe Market Value (US$ Mn), 2017-2021

Figure 58: Europe Market Value (US$ Mn), 2022-2032

Figure 59: Europe Market Share Analysis by Component– 2022 & 2032

Figure 60: Europe Market Y-o-Y Growth by Component, 2022-2032

Figure 61: Europe Market Attractiveness Analysis by Component, 2022-2032

Figure 62: Europe Market Share Analysis by Size– 2022 & 2032

Figure 63: Europe Market Y-o-Y Growth by Size, 2022-2032

Figure 64: Europe Market Attractiveness Analysis by Size, 2022-2032

Figure 65: Europe Market Share Analysis by Industry – 2022 & 2032

Figure 66: Europe Market Y-o-Y Growth by Industry, 2022-2032

Figure 67: Europe Market Attractiveness Analysis by Industry, 2022-2032

Figure 68: Europe Market Share Analysis by Country – 2022 & 2032

Figure 69: Europe Market Y-o-Y Growth by Country, 2022-2032

Figure 70: Europe Market Attractiveness Analysis by Country, 2022-2032

Figure 71: Germany Market Absolute $ Opportunity (US$ Mn), 2017-2021

Figure 72: France Market Absolute $ Opportunity (US$ Mn), 2017-2021

Figure 73: Italy Market Absolute $ Opportunity (US$ Mn), 2017-2021

Figure 74: Spain Market Absolute $ Opportunity (US$ Mn), 2017-2021

Figure 75: U.K. Market Absolute $ Opportunity (US$ Mn), 2017-2021

Figure 76: BENELUX Market Absolute $ Opportunity (US$ Mn), 2017-2021

Figure 77: Russia Market Absolute $ Opportunity (US$ Mn), 2017-2021

Figure 78: Rest of Europe Market Absolute $ Opportunity (US$ Mn), 2017-2021

Figure 79: East Asia Market Value (US$ Mn), 2017-2021

Figure 80: East Asia Market Value (US$ Mn), 2022-2032

Figure 81: East Asia Market Share Analysis by Component– 2022 & 2032

Figure 82: East Asia Market Y-o-Y Growth by Component, 2022-2032

Figure 83: East Asia Market Attractiveness Analysis by Component, 2022-2032

Figure 84: East Asia Market Share Analysis by Size– 2022 & 2032

Figure 85: East Asia Market Y-o-Y Growth by Size, 2022-2032

Figure 86: East Asia Market Attractiveness Analysis by Size, 2022-2032

Figure 87: East Asia Market Share Analysis by Industry – 2022 & 2032

Figure 88: East Asia Market Y-o-Y Growth by Industry, 2022-2032

Figure 89: East Asia Market Attractiveness Analysis by Industry, 2022-2032

Figure 90: East Asia Market Share Analysis by Country – 2022 & 2032

Figure 91: East Asia Market Y-o-Y Growth by Country, 2022-2032

Figure 92: East Asia Market Attractiveness Analysis by Country, 2022-2032

Figure 93: China Market Absolute $ Opportunity (US$ Mn), 2017-2021

Figure 94: Japan Market Absolute $ Opportunity (US$ Mn), 2017-2021

Figure 95: South Korea Market Absolute $ Opportunity (US$ Mn), 2017-2021

Figure 96: South Asia & Pacific Market Value (US$ Mn), 2017-2021

Figure 97: South Asia & Pacific Market Value (US$ Mn), 2022-2032

Figure 98: South Asia & Pacific Market Share Analysis by Component– 2022 & 2032

Figure 99: South Asia & Pacific Market Y-o-Y Growth by Component, 2022-2032

Figure 100: South Asia & Pacific Market Attractiveness Analysis by Component, 2022-2032

Figure 101: South Asia & Pacific Market Share Analysis by Size– 2022 & 2032

Figure 102: South Asia & Pacific Market Y-o-Y Growth by Size, 2022-2032

Figure 103: South Asia & Pacific Market Attractiveness Analysis by Size, 2022-2032

Figure 104: South Asia & Pacific Market Share Analysis by Industry – 2022 & 2032

Figure 105: South Asia & Pacific Market Y-o-Y Growth by Industry, 2022-2032

Figure 106: South Asia & Pacific Market Attractiveness Analysis by Industry, 2022-2032

Figure 107: South Asia & Pacific Market Share Analysis by Country – 2022 & 2032

Figure 108: South Asia & Pacific Market Y-o-Y Growth by Country, 2022-2032

Figure 109: South Asia & Pacific Market Attractiveness Analysis by Country, 2022-2032

Figure 110: India Market Absolute $ Opportunity (US$ Mn), 2017-2021

Figure 111: Thailand Market Absolute $ Opportunity (US$ Mn), 2017-2021

Figure 112: Malaysia Market Absolute $ Opportunity (US$ Mn), 2017-2021

Figure 113: Indonesia Market Absolute $ Opportunity (US$ Mn), 2017-2021

Figure 114: Australia & New Zealand Market Absolute $ Opportunity (US$ Mn), 2017-2021

Figure 115: Rest of South Asia & Pacific Market Absolute $ Opportunity (US$ Mn), 2017-2032

Figure 116: Middle East & Africa Market Value (US$ Mn), 2017-2021

Figure 117: Middle East & Africa Market Value (US$ Mn), 2022-2032

Figure 118: Middle East & Africa Market Share Analysis by Component– 2022 & 2032

Figure 119: Middle East & Africa Market Y-o-Y Growth by Component, 2022-2032

Figure 120: Middle East & Africa Market Attractiveness Analysis by Component, 2022-2032

Figure 121: Middle East & Africa Market Share Analysis by Size– 2022 & 2032

Figure 122: Middle East & Africa Market Y-o-Y Growth by Size, 2022-2032

Figure 123: Middle East & Africa Market Attractiveness Analysis by Size, 2022-2032

Figure 124: Middle East & Africa Market Share Analysis by Industry – 2022 & 2032

Figure 125: Middle East & Africa Market Y-o-Y Growth by Industry, 2022-2032

Figure 126: Middle East & Africa Market Attractiveness Analysis by Industry, 2022-2032

Figure 127: Middle East & Africa Market Share Analysis by Country – 2022 & 2032

Figure 128: Middle East & Africa Market Y-o-Y Growth by Country, 2022-2032

Figure 129: Middle East & Africa Market Attractiveness Analysis by Country, 2022-2032

Figure 130: GCC Countries Market Absolute $ Opportunity (US$ Mn), 2017-2021

Figure 131: Turkey Market Absolute $ Opportunity (US$ Mn), 2017-2021

Figure 132: South Africa Market Absolute $ Opportunity (US$ Mn), 2017-2021

Figure 133: Rest of Middle East & Africa Market Absolute $ Opportunity (US$ Mn), 2017-2032

Figure 134: U.S. Incremental Opportunity Share Analysis, by Component

Figure 135: U.S. Incremental Opportunity Share Analysis, by Size

Figure 136: U.S. Incremental Opportunity Share Analysis, by Industry

Figure 137: Canada Incremental Opportunity Share Analysis, by Component

Figure 138: Canada Incremental Opportunity Share Analysis, by Size

Figure 139: Canada Incremental Opportunity Share Analysis, by Industry

Figure 140: Brazil Incremental Opportunity Share Analysis, by Component

Figure 141: Brazil Incremental Opportunity Share Analysis, by Size

Figure 142: Brazil Incremental Opportunity Share Analysis, by Industry

Figure 143: Mexico Incremental Opportunity Share Analysis, by Component

Figure 144: Mexico Incremental Opportunity Share Analysis, by Size

Figure 145: Mexico Incremental Opportunity Share Analysis, by Industry

Figure 146: Germany Incremental Opportunity Share Analysis, by Component

Figure 147: Germany Incremental Opportunity Share Analysis, by Size

Figure 148: Germany Incremental Opportunity Share Analysis, by Industry

Figure 149: Italy Incremental Opportunity Share Analysis, by Component

Figure 150: Italy Incremental Opportunity Share Analysis, by Size

Figure 151: Italy Incremental Opportunity Share Analysis, by Industry

Figure 152: France Incremental Opportunity Share Analysis, by Component

Figure 153: France Incremental Opportunity Share Analysis, by Size

Figure 154: France Incremental Opportunity Share Analysis, by Industry

Figure 155: U.K. Incremental Opportunity Share Analysis, by Component

Figure 156: U.K. Incremental Opportunity Share Analysis, by Size

Figure 157: U.K. Incremental Opportunity Share Analysis, by Industry

Figure 158: Spain Incremental Opportunity Share Analysis, by Component

Figure 159: Spain Incremental Opportunity Share Analysis, by Size

Figure 160: Spain Incremental Opportunity Share Analysis, by Industry

Figure 161: BENELUX Incremental Opportunity Share Analysis, by Component

Figure 162: BENELUX Incremental Opportunity Share Analysis, by Size

Figure 163: BENELUX Incremental Opportunity Share Analysis, by Industry

Figure 164: Russia Incremental Opportunity Share Analysis, by Component

Figure 165: Russia Incremental Opportunity Share Analysis, by Size

Figure 166: Russia Incremental Opportunity Share Analysis, by Industry

Figure 167: China Incremental Opportunity Share Analysis, by Component

Figure 168: China Incremental Opportunity Share Analysis, by Size

Figure 169: China Incremental Opportunity Share Analysis, by Industry

Figure 170: Japan Incremental Opportunity Share Analysis, by Component

Figure 171: Japan Incremental Opportunity Share Analysis, by Size

Figure 172: Japan Incremental Opportunity Share Analysis, by Industry

Figure 173: South Korea Incremental Opportunity Share Analysis, by Component

Figure 174: South Korea Incremental Opportunity Share Analysis, by Size

Figure 175: South Korea Incremental Opportunity Share Analysis, by Industry

Figure 176: India Incremental Opportunity Share Analysis, by Component

Figure 177: India Incremental Opportunity Share Analysis, by Size

Figure 178: India Incremental Opportunity Share Analysis, by Industry

Figure 179: Thailand Incremental Opportunity Share Analysis, by Component

Figure 180: Thailand Incremental Opportunity Share Analysis, by Size

Figure 181: Thailand Incremental Opportunity Share Analysis, by Industry

Figure 182: Malaysia Incremental Opportunity Share Analysis, by Component

Figure 183: Malaysia Incremental Opportunity Share Analysis, by Size

Figure 184: Malaysia Incremental Opportunity Share Analysis, by Industry

Figure 185: Indonesia Incremental Opportunity Share Analysis, by Component

Figure 186: Indonesia Incremental Opportunity Share Analysis, by Size

Figure 187: Indonesia Incremental Opportunity Share Analysis, by Industry

Figure 188: Australia & New Zealand Incremental Opportunity Share Analysis, by Component

Figure 189: Australia & New Zealand Incremental Opportunity Share Analysis, by Size

Figure 190: Australia & New Zealand Incremental Opportunity Share Analysis, by Industry

Figure 191: GCC Countries Incremental Opportunity Share Analysis, by Component

Figure 192: GCC Countries Incremental Opportunity Share Analysis, by Size

Figure 193: GCC Countries Incremental Opportunity Share Analysis, by Industry

Figure 194: Turkey Incremental Opportunity Share Analysis, by Component

Figure 195: Turkey Incremental Opportunity Share Analysis, by Size

Figure 196: Turkey Incremental Opportunity Share Analysis, by Industry

Figure 197: South Africa Incremental Opportunity Share Analysis, by Component

Figure 198: South Africa Incremental Opportunity Share Analysis, by Size

Figure 199: South Africa Incremental Opportunity Share Analysis, by Industry

Recommendations

Industrial Automation

Fuel Cell For Data Center Market

Published : December 2022

Oil and Gas

On-Site Photovoltaic Solar Power For Data Centers Market

Published : December 2022

Technology

Data Center Modeling and Simulation Tools Market

Published : March 2018

Explore Technology Insights

View Reports