Reports

- Global Locations -

Headquarters

Future Market Insights, Inc.

Christiana Corporate, 200
Continental Drive, Suite 401,
Newark, Delaware - 19713,
United States

T: +1-845-579-5705

Americas

Future Market Insights, Inc.

616 Corporate Way, Suite 2-9018,
Valley Cottage, NY 10989, United States

T: +1-347-918-3531

MEA

Future Market Insights

1602-6 Jumeirah Bay X2 Tower, Plot No: JLT-PH2-X2A,
Jumeirah Lakes Towers, Dubai,
United Arab Emirates

Europe

Future Market Insights

3rd Floor, 207 Regent Street,
W1B 3HH London
United Kingdom

T: + 44 (0) 20 8123 9659
D: +44 (0) 20 3287 4268

Asia Pacific

Future Market Insights

IndiaLand Global Tech Park, Unit UG-1, Behind Grand HighStreet, Phase 1, Hinjawadi, MH, Pune – 411057, India

Data Center CPU Market Outlook (2023 to 2033)

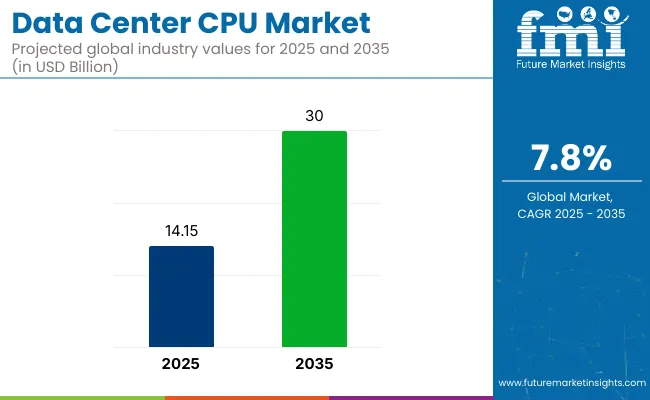
The global data center CPU market is estimated to be valued at US$ 10.92 billion in 2023. The market is expected to continue booming as it has in previous years. Therefore, the global revenue of this market is projected to reach US$ 19.55 billion by 2033, exhibiting a CAGR of 6% from 2023 to 2033.

The data center CPU market is expected to grow significantly over the next few years, driven by the increasing demand for cloud computing, big data analytics, and artificial intelligence (AI). Key drivers of this growth include the need for faster data processing, increased efficiency, and reduced costs.

The demand for data center CPUs is growing as more businesses move their IT infrastructure to the cloud. To meet this demand, cloud service providers are making significant investments in data centers, which are propelling market expansion. More data is being gathered and analyzed by businesses than ever before. This calls for strong CPUs to do the processing. This trend is anticipated to continue as businesses want to enhance their decision-making and obtain insights from their data.

To handle specialized workloads like AI and machine learning, data center CPUs are getting increasingly specialized. To build models and make predictions, AI and machine learning need substantial computing power. The demand for specialized CPUs, such as graphics processing units (GPUs) and field-programmable gate arrays (FPGAs), is increasing.

One trend driving the data center CPU market is the increasing use of multi-core processors, which allow for more efficient processing of large amounts of data. Another trend is virtualization technology, which enables multiple applications to run on a single server, thereby increasing efficiency and reducing costs.

With businesses like Google and Meta creating their open-source CPU designs, there is a rising trend towards open-source hardware in the data center chip market. This is likely to stimulate market competitiveness along with creativity. Moreover, data centers use a lot of energy, and a rising demand exists to lower this usage. This is boosting demand for Processors that use less energy and can help data centers cut back on their carbon impact.

Opportunities in the data center CPU market include the growing demand for edge computing, which requires powerful processors to process data at the edge of the network. The AI and machine learning market is expected to continue to grow rapidly, which presents a significant opportunity for companies that specialize in CPUs optimized for these workloads. Edge computing includes processing data closer to the source, which calls for Processors designed to cope with this workload. This presents an opportunity for companies that can develop CPUs specially optimized for edge computing.

Attributes Details
Data Center CPU Market Value (2023) US$ 10.92 billion
Data Center CPU Market Expected Value (2033) US$ 19.55 billion
Data Center CPU Market Projected CAGR (2023 to 2033) 6%

Don't pay for what you don't need

Customize your report by selecting specific countries or regions and save 30%!

2018 to 2022 Data Center CPU Market Outlook Compared to 2023 to 2033 Forecast

From 2018 to 2022, the data center CPU market evolved dynamically and accelerated. New product introductions and shifts in the competitive landscape resulted in substantial market position and revenue growth fluctuations. Significant market consolidation has occurred, with Intel continuing to hold the top position and AMD finishing behind it. While ARM has progressed with its design for low-power servers, other firms like IBM and Oracle have left the industry.

Substantial performance enhancements have been made possible by developing new microarchitectures, manufacturing technologies, and chip designs. Compared to its predecessors, the Xeon Scalable CPU series from Intel and the EPYC processors from AMD showed considerable performance improvements. With its EPYC CPUs having a superior price-performance ratio than Intel's Xeon processors, AMD has established itself as a serious rival to Intel in the data center CPU market. As a result, there is now more competition and pricing pressure in the market.

Since businesses migrate their workloads to the cloud, the demand for data center CPUs has increased. As a result, CPUs intended for cloud workloads, like Intel's Xeon Scalable and AMD's EPYC processors, have seen a surge in deployment. Moreover, the COVID-19 outbreak has sped up the transition to cloud computing, increasing demand for data center CPUs. At the same time, supply shortages and higher pricing for certain components have resulted from production and supply chain disruptions.

Although Intel continues to dominate the industry, a decline in market share can be attributed to AMD's expanding product line and superior performance versus Intel. In 2022, AMD outgrew Intel in terms of market share expansion. With ongoing delays in the delivery of Sapphire Rapids, its next-generation product that is generationally equivalent to AMD's Milan released in 2021, Intel suffered.

  • Short Term (2023 to 2026): With the increasing popularity of cloud computing, the market is expected to grow larger. Owing to the necessity of many CPUs to meet the demand, cloud computing enables businesses to store and analyze their data in distant data centers. It is anticipated that as more businesses shift their data to the cloud, demand for data center CPUs could rise, offering short-term growth prospects for CPU manufacturers.
  • Medium Term (2026 to 2029): The emergence of AI and ML applications is expected to stimulate market growth. High-performance CPUs can deliver the substantial processing power these applications demand.

Demand for data center CPUs with high processing capacities is anticipated to increase as AI and ML become prevalent in numerous sectors. This opens up prospects for mid-term development for CPU developers.

  • Long Term (2029 to 2033): The market is anticipated to expand due to the rising demand for HPC workloads. HPC involves utilizing high-performance computing systems to tackle challenging computational issues, such as weather forecasting, simulating scientific experiments, and modeling financial outcomes.

Since HPC workloads necessitate high processing power and efficiency, the demand for data center CPUs with innovative designs and technologies is anticipated to increase. The ability to produce high-performance CPUs that satisfy the demands of HPC applications is anticipated to open up long-term growth potential for CPU producers.

These factors are anticipated to support a 1.8X increase in the data center CPU market between 2023 and 2033. The market is projected to be worth US$ 19.55 billion by the end of 2033, according to FMI analysts.

Comparative Analysis of Adjacent Data Center CPU Market

Data Center CPU Market:

Differentiating Aspects Data Center CPU Market
CAGR (2023 to 2033) 6%
Market Valuation in 2023 US$ 10.92 billion
Projected Market Value in 2033 US$ 19.55 billion
Growth Factors The expanding use of cloud-based services and programs
Opportunities The expanding use of hybrid cloud computing
Key Trends The shift toward modular data center designs

Data Center Power Management Market:

Differentiating Aspects Data Center Power Management Market
CAGR (2023 to 2033) 6.9%
Market Valuation in 2023 US$ 19.42 billion
Projected Market Value in 2033 US$ 37.85 billion
Growth Factors Growing demand for high-performance computing and cloud computing services
Opportunities The adoption of edge computing and the increasing use of IoT devices
Key Trends The emergence of edge computing and the need for distributed data centers

Data Center Rack Server Market:

Differentiating Aspects Data Center Rack Server Market
CAGR (2023 to 2033) 14.5%
Market Valuation in 2023 US$ 89.31 billion
Projected Market Value in 2033 US$ 345.90 billion
Growth Factors Growing need across businesses for data processing and storage capabilities
Opportunities Growing need for energy-efficient and cost-effective data center solutions
Key Trends Increasing trend toward outsourcing data center services and infrastructure
Sudip Saha
Sudip Saha

Principal Consultant

Talk to Analyst

Find your sweet spots for generating winning opportunities in this market.

Uncovering the Regional Trends in the Data Center CPU Market: A Country-Level Study

Intel and AMD Battle for CPU Dominance in the United States Data Center Industry

The increasing demand for cloud-based services, artificial intelligence, and big data analytics primarily drives the market in the United States. Companies invest substantially in research & development to stay on the cutting edge, a primary driver of growth in this industry. Numerous trends, including the rise of edge computing, the growing need for cloud-based services, and the mounting demand for energy-efficient CPUs, are also driving the market in the United States.

Technology improvements fuel the USA market, with businesses continuously creating faster, more effective CPUs that can handle more challenging workloads. As many businesses have moved their operations to the cloud and need high-performance CPUs to power their applications, the advent of cloud computing has also substantially influenced the market in the United States.

The United States data center CPU market is highly competitive, with key players like Intel, AMD, and Qualcomm vying for market share. With its Xeon processors being widely employed in data centers throughout the country, Intel has long been the dominating player in this market. AMD has made considerable strides in recent years with its EPYC processors, which provide performance on par with Intel's Xeon CPUs at a cheaper price point. With its Centriq CPUs, which are made exclusively for cloud-based applications, Qualcomm is also attempting to get into the data center CPU industry.

Next-generation CPUs Empowering the Future of the United Kingdom's Digital Landscape

The United Kingdom datacenter CPU market is very competitive and improving rapidly. FMI explores key regional trends:

  • Businesses in the United Kingdom have made significant investments in modernizing their hardware and infrastructure as a result of the rising demand for cloud computing services.
  • Intel leads the industry in this country, although rival companies like AMD and ARM are becoming more competitive.
  • Demand for high-performance CPUs that can effectively and rapidly conduct complicated computations is increasing as AI and machine learning become more widely used in data centers.
  • The government's initiatives to promote digital transformation and invest in technological infrastructure are anticipated to spur further market expansion.
  • As these technologies demand strong processing capabilities at the network edge, the growing popularity of edge computing and the Internet of Things (IoT) is also opening up new opportunities for data center CPU manufacturers.

With organizations like Amazon Web Services and Microsoft Azure offering Arm-based workloads, there has also been an increasing trend towards the usage of Arm-based processors in data centers. The rising need for energy-efficient CPUs. This need could lessen the carbon footprint of data centers, which seemed to be the trend's driving force.

Government's Push for Self-reliance Boosts Data Center CPU Industry in China

China's data center CPU market is a rapidly growing and highly competitive industry. The country's efforts to build its domestic technology industry and lessen its reliance on foreign technology helped to fuel the demand for data center CPUs in China. More funding for research and development of indigenous CPU designs has resulted.

Given its solid reputation for dependability and performance, Intel has long held the top spot in China's data center CPU market. However, AMD has recently gained momentum with its powerful and reasonably priced EPYC CPUs. With its Kunpeng processors, made exclusively for Chinese data centers and offering satisfactory accuracy at an affordable price point, Huawei, a Chinese IT giant, has made headway in the market. In addition to these well-known firms, China's data center CPU industry is also home to several emerging businesses, including Cambricon and Horizon Robotics, which focus on CPUs with an AI focus.

The development of big data and cloud computing in China has significantly increased the demand for data center CPUs. More potent and effective CPUs are required to manage the massive volumes of data being processed due to the growth of these businesses. To encourage local businesses to create their processor technology, the Chinese government has also been aggressively pushing for the growth of the domestic CPU sector. Other Chinese CPU producers have emerged as a result, including Loongson and Zhaoxin, which are beginning to gain momentum in the data center industry.

Rising Demand for Cloud Services Boosts CPU Sales in Japan's Data Center Sector

The data center CPU market in Japan is a vibrant, fiercely competitive sector home to numerous top international companies. These companies include Intel, AMD, IBM, and Fujitsu. The industry has experienced a tremendous expansion in recent years due to the rising demand for cloud computing and data center services. As a result, there are now more data centers in Japan, which has increased the demand for CPUs.

Regarding market share, Intel, AMD, and IBM are the top three players in the Japanese market for data center CPUs. Due to their focus on creating CPUs that are suited to the requirements of Japanese data center operators, domestic firms like Fujitsu are also making headway in the industry.

The market did not, however, come without difficulties. Japan's aging population and low birth rate led to a labor deficit. This included people with knowledge of managing and maintaining data centers. Also, increasing inspection and regulation of data center operations has been brought on by data security and privacy concerns.

Japanese businesses have been investing in automation and artificial intelligence technologies to address these issues since they increase productivity and decrease the need for human interaction. Also, they were working together with foreign partners to introduce fresh knowledge and technology. Hence, the expanding need for data processing, storage, and analysis was anticipated to fuel future growth in the Japanese data center CPU market.

Exploring the Data Center CPU Market: An In-Depth Segment Analysis

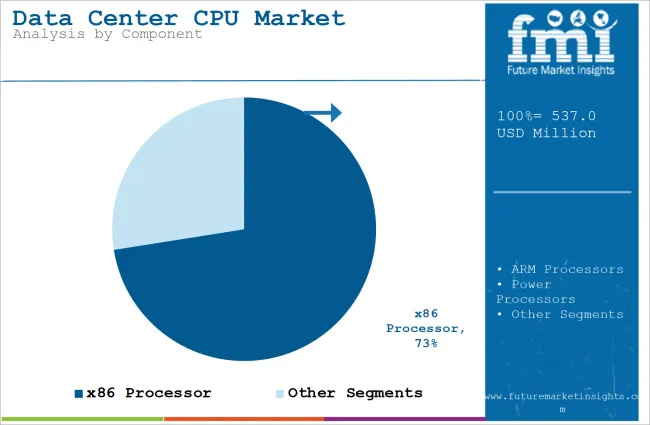
x86 Processors Show No Signs of Slowing Down in Data Center Market

The x86 processors segment dominates the data center CPU market for several reasons:

  • Compatibility: As it has been around for so long, the x86 processor is compatible with the maximum operating systems and programs. This makes it simpler for data centers to manage their workloads since software designed for x86 processors can operate on servers with x86 CPUs.
  • Performance: The performance of x86 processors has significantly increased over time, making them suitable for handling various tasks. These processors may handle the high-speed data processing and demanding workloads typical in data center environments.
  • Availability: x86 processors are produced by numerous businesses, including Intel and AMD, making them broadly accessible and affordable.
  • Ecosystem: The x86 architecture is supported by a sizable ecosystem of hardware and software companies, including makers of servers, motherboards, and software. This makes it simpler for data center operators to locate the parts and software required to assemble and run their data centers.
  • Familiarity: Since x86 processors are well-known to IT experts, managing and maintaining data centers that employ them is simpler for them. This lessens the learning curve for new hires and simplifies the process for operators of data centers to locate qualified personnel to oversee their settings.

Data Center CPU Market Swings in Favor of Cloud Service Providers

The size of their operations is one of the main factors influencing cloud service providers' dominance in the industry. Several large-scale cloud service providers, including Amazon Web Services (AWS), Microsoft Azure, and Google Cloud, serve millions of clients worldwide. They require highly effective and dependable data centers to manage huge data and workloads to operate such a large-scale business. As a result, cloud service providers invest significantly in cutting-edge data center technologies, such as high-performance CPUs.

The dominance of cloud service providers in the data center CPU industry can also be attributed to their emphasis on efficiency and cost reduction. The selection of the proper CPU can considerably influence a cloud provider's capacity to provide services at cheaper prices than traditional on-premises data centers. For their workloads, cloud providers carefully assess several CPU alternatives, such as x86 and ARM-based CPUs, to decide which provides optimal performance and cost-effectiveness.

Cloud service providers are also at the forefront of using fresh technologies that spur innovation in the CPUs used in data centers. For instance, creating specialized Processors, such as GPUs and TPUs, designed for certain workloads is a direct outcome of the advent of AI and machine learning. Cloud companies are among the first to adopt such technology, as they can use their sizable data centers to test and optimize these new CPUs for their workloads.

Last but not least, the capacity of cloud service providers to deliver customizable services that satisfy different client demands also contributes to their dominance in the market. Thanks to their sizable data centers and potent CPUs, cloud companies can provide a wide range of services, from straightforward web hosting to intricate data analytics and machine learning. Because of their adaptability, cloud service providers have been able to serve the various demands of clients all over the world and gain a sizable portion of the data center CPU market.

Battle of the Titans: Top Companies Vying for Dominance in the Data Center CPU Market

The data center CPU market is highly competitive, with several key players vying for dominance. Here are certain leading players in the market and their strategies:

Intel: Maximum CPUs in data centers belong to Intel's Xeon processor series, making it one of the market's top players. Creating new solutions to address the changing demands of the data center industry is a key component of Intel's innovation and diversification strategy. Intel's new 3rd Gen Xeon Scalable CPUs have enhanced performance, AI capabilities, and security features.

AMD: With its EPYC processor line, AMD is another significant competitor in the data center CPU industry. AMD's business approach is to sell high-performance CPUs for less money than Intel, which makes them a desirable alternative for operators of cost-conscious data centers. The 3rd Gen EPYC CPUs from AMD, which promise better performance and power efficiency than earlier generations, have just been released.

Nvidia: Despite being widely regarded for its graphics processing units (GPUs), the business has expanded into other markets with the acquisition of Arm, including the data center CPUs. To deliver high-performance computing solutions for AI, machine learning, and other data-intensive applications, Nvidia's approach is centered on creating CPUs and GPUs that integrate naturally.

IBM: With its Power processor series, IBM has had a long history of participation in the data center CPU industry. The principal goal of IBM's strategy is to deliver high-performance CPUs for business applications, notably in artificial intelligence and hybrid cloud. The Power10 CPU, newly released by IBM, offers notable upgrades in speed, security, and energy efficiency over its predecessor.

Qualcomm: Although Qualcomm is renowned for its mobile CPUs, the Centriq chip family has allowed the company to enter the data center CPU market. The core objective of Qualcomm's strategy is to deliver powerful, energy-efficient CPUs for data center workloads, particularly in artificial intelligence and machine learning. To concentrate on other aspects of its company, Qualcomm recently disclosed that it was stopping the development of its Centriq chips.

Arm: Arm is a significant participant in the CPU industry, especially in the mobile and IoT industries. Yet the business also intends to increase its market share for data center CPUs after Nvidia's acquisition. Arm's approach is to create highly adaptable and energy-efficient CPUs perfect for various data center applications. Neoverse V1 and Neoverse N2 CPU architectures from Arm, geared for performance and energy efficiency in data center applications, have recently gone on sale.

AWS: Leading cloud service provider Amazon Web Services (AWS) provides a selection of CPUs for data center applications, including AMD EPYC and Intel Xeon processors. The core of Amazon's goal is to give clients customizable CPU performance choices and interaction with other AWS services for improved performance and scalability. The debut of AWS's Graviton2 ARM-based processors, which provide up to 40% better price/performance than x86 processors, was announced recently.

Google: Google is another significant cloud service provider that provides a variety of CPUs for data center tasks, including Intel Xeon, AMD EPYC, and its own specifically designed Tensor Processing Units (TPUs). Google's approach is centered on offering clients highly specialized Processors for certain tasks, such as machine learning and data analytics. Google recently made public the arrival of its third-generation TPUs, which provide up to 8 times the performance of the prior generation in certain workloads.

Huawei: In China and other Asian regions, Huawei participates significantly in the data center CPU industry. The core objective of Huawei's approach is to offer high-performance CPUs for a wide range of data center applications, including AI, cloud computing, and big data analytics. Lately, Huawei unveiled the Kunpeng 920 ARM-based CPU, which provides great performance and energy efficiency for applications in data centers.

Lenovo: With different CPUs for data center tasks, including Intel Xeon and AMD EPYC processors, Lenovo is a significant PC and server producer. Lenovo's business approach is to provide clients with a wide range of CPU performance and scalability choices and customization options for certain workloads. Recently, Lenovo and Intel revealed an agreement to create MareNostrum 5, a new supercomputer that combines Lenovo servers and Intel Xeon Scalable processors to provide high-performance computing for research and scientific applications.

Get the data you need at a Fraction of the cost

Personalize your report by choosing insights you need
and save 40%!

Data Center CPU Market Segmentation

By Type:

  • x86 Processors
  • ARM Processors
  • Power Processors

By Architecture:

  • Multi-core
  • Multi-thread
  • Many-core

By Application:

  • Web Hosting
  • Cloud
  • High Performance Computing
  • Artificial Intelligence
  • Machine Learning
  • Big Data Analytics

By End-user:

  • Cloud Service Providers
  • Enterprises
  • Government Agencies

By Region:

  • North America
  • Latin America
  • Europe
  • Asia Pacific
  • Middle East & Africa

Frequently Asked Questions

What is the Data Center CPU Market Size in 2023?

The market is valued at US$ 10.92 billion in 2023.

Which are the key Data Center CPU players?

Nvidia, IBM, and Qualcomm are key market players.

What will the market size be in 2033?

The market will reach US$ 19.55 billion by 2033.

What drives Data Center CPU sales?

The adoption of cloud computing will drive data center CPU sales.

Which is the key segment by type?

X86 processors are likely to remain preferred through 2033.

Table of Content

1. Executive Summary | Data Center CPU Market

    1.1. Global Market Outlook

    1.2. Demand-side Trends

    1.3. Supply-side Trends

    1.4. Technology Roadmap Analysis

    1.5. Analysis and Recommendations

2. Market Overview

    2.1. Market Coverage / Taxonomy

    2.2. Market Definition / Scope / Limitations

3. Market Background

    3.1. Market Dynamics

        3.1.1. Drivers

        3.1.2. Restraints

        3.1.3. Opportunity

        3.1.4. Trends

    3.2. Scenario Forecast

        3.2.1. Demand in Optimistic Scenario

        3.2.2. Demand in Likely Scenario

        3.2.3. Demand in Conservative Scenario

    3.3. Opportunity Map Analysis

    3.4. Investment Feasibility Matrix

    3.5. PESTLE and Porter’s Analysis

    3.6. Regulatory Landscape

        3.6.1. By Key Regions

        3.6.2. By Key Countries

    3.7. Regional Parent Market Outlook

4. Global Market Analysis 2018 to 2022 and Forecast, 2023 to 2033

    4.1. Historical Market Size Value (US$ Million) Analysis, 2018 to 2022

    4.2. Current and Future Market Size Value (US$ Million) Projections, 2023 to 2033

        4.2.1. Y-o-Y Growth Trend Analysis

        4.2.2. Absolute $ Opportunity Analysis

5. Global Market Analysis 2018 to 2022 and Forecast 2023 to 2033, By Component

    5.1. Introduction / Key Findings

    5.2. Historical Market Size Value (US$ Million) Analysis By Component, 2018 to 2022

    5.3. Current and Future Market Size Value (US$ Million) Analysis and Forecast By Component, 2023 to 2033

        5.3.1. Hardware

        5.3.2. Software

        5.3.3. Service

    5.4. Y-o-Y Growth Trend Analysis By Component, 2018 to 2022

    5.5. Absolute $ Opportunity Analysis By Component, 2023 to 2033

6. Global Market Analysis 2018 to 2022 and Forecast 2023 to 2033, By Size

    6.1. Introduction / Key Findings

    6.2. Historical Market Size Value (US$ Million) Analysis By Size, 2018 to 2022

    6.3. Current and Future Market Size Value (US$ Million) Analysis and Forecast By Size, 2023 to 2033

        6.3.1. Small Data Center

        6.3.2. Mid-Sized Data Center

        6.3.3. Large Data Center

    6.4. Y-o-Y Growth Trend Analysis By Size, 2018 to 2022

    6.5. Absolute $ Opportunity Analysis By Size, 2023 to 2033

7. Global Market Analysis 2018 to 2022 and Forecast 2023 to 2033, By Industry

    7.1. Introduction / Key Findings

    7.2. Historical Market Size Value (US$ Million) Analysis By Industry, 2018 to 2022

    7.3. Current and Future Market Size Value (US$ Million) Analysis and Forecast By Industry, 2023 to 2033

        7.3.1. IT & Telecom

        7.3.2. BFSI

        7.3.3. Manufacturing

        7.3.4. Healthcare

        7.3.5. Media & Entertainment

        7.3.6. Others

    7.4. Y-o-Y Growth Trend Analysis By Industry, 2018 to 2022

    7.5. Absolute $ Opportunity Analysis By Industry, 2023 to 2033

8. Global Market Analysis 2018 to 2022 and Forecast 2023 to 2033, By Region

    8.1. Introduction

    8.2. Historical Market Size Value (US$ Million) Analysis By Region, 2018 to 2022

    8.3. Current Market Size Value (US$ Million) Analysis and Forecast By Region, 2023 to 2033

        8.3.1. North America

        8.3.2. Latin America

        8.3.3. Europe

        8.3.4. South Asia

        8.3.5. East Asia

        8.3.6. Oceania

        8.3.7. MEA

    8.4. Market Attractiveness Analysis By Region

9. North America Market Analysis 2018 to 2022 and Forecast 2023 to 2033, By Country

    9.1. Historical Market Size Value (US$ Million) Trend Analysis By Market Taxonomy, 2018 to 2022

    9.2. Market Size Value (US$ Million) Forecast By Market Taxonomy, 2023 to 2033

        9.2.1. By Country

            9.2.1.1. USA

            9.2.1.2. Canada

        9.2.2. By Component

        9.2.3. By Size

        9.2.4. By Industry

    9.3. Market Attractiveness Analysis

        9.3.1. By Country

        9.3.2. By Component

        9.3.3. By Size

        9.3.4. By Industry

    9.4. Key Takeaways

10. Latin America Market Analysis 2018 to 2022 and Forecast 2023 to 2033, By Country

    10.1. Historical Market Size Value (US$ Million) Trend Analysis By Market Taxonomy, 2018 to 2022

    10.2. Market Size Value (US$ Million) Forecast By Market Taxonomy, 2023 to 2033

        10.2.1. By Country

            10.2.1.1. Brazil

            10.2.1.2. Mexico

            10.2.1.3. Rest of Latin America

        10.2.2. By Component

        10.2.3. By Size

        10.2.4. By Industry

    10.3. Market Attractiveness Analysis

        10.3.1. By Country

        10.3.2. By Component

        10.3.3. By Size

        10.3.4. By Industry

    10.4. Key Takeaways

11. Europe Market Analysis 2018 to 2022 and Forecast 2023 to 2033, By Country

    11.1. Historical Market Size Value (US$ Million) Trend Analysis By Market Taxonomy, 2018 to 2022

    11.2. Market Size Value (US$ Million) Forecast By Market Taxonomy, 2023 to 2033

        11.2.1. By Country

            11.2.1.1. Germany

            11.2.1.2. UNITED KINGDOM

            11.2.1.3. France

            11.2.1.4. Spain

            11.2.1.5. Italy

            11.2.1.6. Rest of Europe

        11.2.2. By Component

        11.2.3. By Size

        11.2.4. By Industry

    11.3. Market Attractiveness Analysis

        11.3.1. By Country

        11.3.2. By Component

        11.3.3. By Size

        11.3.4. By Industry

    11.4. Key Takeaways

12. South Asia Market Analysis 2018 to 2022 and Forecast 2023 to 2033, By Country

    12.1. Historical Market Size Value (US$ Million) Trend Analysis By Market Taxonomy, 2018 to 2022

    12.2. Market Size Value (US$ Million) Forecast By Market Taxonomy, 2023 to 2033

        12.2.1. By Country

            12.2.1.1. India

            12.2.1.2. Malaysia

            12.2.1.3. Singapore

            12.2.1.4. Thailand

            12.2.1.5. Rest of South Asia

        12.2.2. By Component

        12.2.3. By Size

        12.2.4. By Industry

    12.3. Market Attractiveness Analysis

        12.3.1. By Country

        12.3.2. By Component

        12.3.3. By Size

        12.3.4. By Industry

    12.4. Key Takeaways

13. East Asia Market Analysis 2018 to 2022 and Forecast 2023 to 2033, By Country

    13.1. Historical Market Size Value (US$ Million) Trend Analysis By Market Taxonomy, 2018 to 2022

    13.2. Market Size Value (US$ Million) Forecast By Market Taxonomy, 2023 to 2033

        13.2.1. By Country

            13.2.1.1. China

            13.2.1.2. Japan

            13.2.1.3. South Korea

        13.2.2. By Component

        13.2.3. By Size

        13.2.4. By Industry

    13.3. Market Attractiveness Analysis

        13.3.1. By Country

        13.3.2. By Component

        13.3.3. By Size

        13.3.4. By Industry

    13.4. Key Takeaways

14. Oceania Market Analysis 2018 to 2022 and Forecast 2023 to 2033, By Country

    14.1. Historical Market Size Value (US$ Million) Trend Analysis By Market Taxonomy, 2018 to 2022

    14.2. Market Size Value (US$ Million) Forecast By Market Taxonomy, 2023 to 2033

        14.2.1. By Country

            14.2.1.1. Australia

            14.2.1.2. New Zealand

        14.2.2. By Component

        14.2.3. By Size

        14.2.4. By Industry

    14.3. Market Attractiveness Analysis

        14.3.1. By Country

        14.3.2. By Component

        14.3.3. By Size

        14.3.4. By Industry

    14.4. Key Takeaways

15. MEA Market Analysis 2018 to 2022 and Forecast 2023 to 2033, By Country

    15.1. Historical Market Size Value (US$ Million) Trend Analysis By Market Taxonomy, 2018 to 2022

    15.2. Market Size Value (US$ Million) Forecast By Market Taxonomy, 2023 to 2033

        15.2.1. By Country

            15.2.1.1. GCC Countries

            15.2.1.2. South Africa

            15.2.1.3. Israel

            15.2.1.4. Rest of MEA

        15.2.2. By Component

        15.2.3. By Size

        15.2.4. By Industry

    15.3. Market Attractiveness Analysis

        15.3.1. By Country

        15.3.2. By Component

        15.3.3. By Size

        15.3.4. By Industry

    15.4. Key Takeaways

16. Key Countries Market Analysis

    16.1. USA

        16.1.1. Pricing Analysis

        16.1.2. Market Share Analysis, 2022

            16.1.2.1. By Component

            16.1.2.2. By Size

            16.1.2.3. By Industry

    16.2. Canada

        16.2.1. Pricing Analysis

        16.2.2. Market Share Analysis, 2022

            16.2.2.1. By Component

            16.2.2.2. By Size

            16.2.2.3. By Industry

    16.3. Brazil

        16.3.1. Pricing Analysis

        16.3.2. Market Share Analysis, 2022

            16.3.2.1. By Component

            16.3.2.2. By Size

            16.3.2.3. By Industry

    16.4. Mexico

        16.4.1. Pricing Analysis

        16.4.2. Market Share Analysis, 2022

            16.4.2.1. By Component

            16.4.2.2. By Size

            16.4.2.3. By Industry

    16.5. Germany

        16.5.1. Pricing Analysis

        16.5.2. Market Share Analysis, 2022

            16.5.2.1. By Component

            16.5.2.2. By Size

            16.5.2.3. By Industry

    16.6. UNITED KINGDOM

        16.6.1. Pricing Analysis

        16.6.2. Market Share Analysis, 2022

            16.6.2.1. By Component

            16.6.2.2. By Size

            16.6.2.3. By Industry

    16.7. France

        16.7.1. Pricing Analysis

        16.7.2. Market Share Analysis, 2022

            16.7.2.1. By Component

            16.7.2.2. By Size

            16.7.2.3. By Industry

    16.8. Spain

        16.8.1. Pricing Analysis

        16.8.2. Market Share Analysis, 2022

            16.8.2.1. By Component

            16.8.2.2. By Size

            16.8.2.3. By Industry

    16.9. Italy

        16.9.1. Pricing Analysis

        16.9.2. Market Share Analysis, 2022

            16.9.2.1. By Component

            16.9.2.2. By Size

            16.9.2.3. By Industry

    16.10. India

        16.10.1. Pricing Analysis

        16.10.2. Market Share Analysis, 2022

            16.10.2.1. By Component

            16.10.2.2. By Size

            16.10.2.3. By Industry

    16.11. Malaysia

        16.11.1. Pricing Analysis

        16.11.2. Market Share Analysis, 2022

            16.11.2.1. By Component

            16.11.2.2. By Size

            16.11.2.3. By Industry

    16.12. Singapore

        16.12.1. Pricing Analysis

        16.12.2. Market Share Analysis, 2022

            16.12.2.1. By Component

            16.12.2.2. By Size

            16.12.2.3. By Industry

    16.13. Thailand

        16.13.1. Pricing Analysis

        16.13.2. Market Share Analysis, 2022

            16.13.2.1. By Component

            16.13.2.2. By Size

            16.13.2.3. By Industry

    16.14. China

        16.14.1. Pricing Analysis

        16.14.2. Market Share Analysis, 2022

            16.14.2.1. By Component

            16.14.2.2. By Size

            16.14.2.3. By Industry

    16.15. Japan

        16.15.1. Pricing Analysis

        16.15.2. Market Share Analysis, 2022

            16.15.2.1. By Component

            16.15.2.2. By Size

            16.15.2.3. By Industry

    16.16. South Korea

        16.16.1. Pricing Analysis

        16.16.2. Market Share Analysis, 2022

            16.16.2.1. By Component

            16.16.2.2. By Size

            16.16.2.3. By Industry

    16.17. Australia

        16.17.1. Pricing Analysis

        16.17.2. Market Share Analysis, 2022

            16.17.2.1. By Component

            16.17.2.2. By Size

            16.17.2.3. By Industry

    16.18. New Zealand

        16.18.1. Pricing Analysis

        16.18.2. Market Share Analysis, 2022

            16.18.2.1. By Component

            16.18.2.2. By Size

            16.18.2.3. By Industry

    16.19. GCC Countries

        16.19.1. Pricing Analysis

        16.19.2. Market Share Analysis, 2022

            16.19.2.1. By Component

            16.19.2.2. By Size

            16.19.2.3. By Industry

    16.20. South Africa

        16.20.1. Pricing Analysis

        16.20.2. Market Share Analysis, 2022

            16.20.2.1. By Component

            16.20.2.2. By Size

            16.20.2.3. By Industry

    16.21. Israel

        16.21.1. Pricing Analysis

        16.21.2. Market Share Analysis, 2022

            16.21.2.1. By Component

            16.21.2.2. By Size

            16.21.2.3. By Industry

17. Market Structure Analysis

    17.1. Competition Dashboard

    17.2. Competition Benchmarking

    17.3. Market Share Analysis of Top Players

        17.3.1. By Regional

        17.3.2. By Component

        17.3.3. By Size

        17.3.4. By Industry

18. Competition Analysis

    18.1. Competition Deep Dive

        18.1.1. IBM Corporation

            18.1.1.1. Overview

            18.1.1.2. Product Portfolio

            18.1.1.3. Profitability by Market Segments

            18.1.1.4. Sales Footprint

            18.1.1.5. Strategy Overview

                18.1.1.5.1. Marketing Strategy

        18.1.2. Cisco System, Inc.

            18.1.2.1. Overview

            18.1.2.2. Product Portfolio

            18.1.2.3. Profitability by Market Segments

            18.1.2.4. Sales Footprint

            18.1.2.5. Strategy Overview

                18.1.2.5.1. Marketing Strategy

        18.1.3. HPE

            18.1.3.1. Overview

            18.1.3.2. Product Portfolio

            18.1.3.3. Profitability by Market Segments

            18.1.3.4. Sales Footprint

            18.1.3.5. Strategy Overview

                18.1.3.5.1. Marketing Strategy

        18.1.4. Dell Technologies

            18.1.4.1. Overview

            18.1.4.2. Product Portfolio

            18.1.4.3. Profitability by Market Segments

            18.1.4.4. Sales Footprint

            18.1.4.5. Strategy Overview

                18.1.4.5.1. Marketing Strategy

        18.1.5. Hitachi Ltd

            18.1.5.1. Overview

            18.1.5.2. Product Portfolio

            18.1.5.3. Profitability by Market Segments

            18.1.5.4. Sales Footprint

            18.1.5.5. Strategy Overview

                18.1.5.5.1. Marketing Strategy

        18.1.6. NTT Communications

            18.1.6.1. Overview

            18.1.6.2. Product Portfolio

            18.1.6.3. Profitability by Market Segments

            18.1.6.4. Sales Footprint

            18.1.6.5. Strategy Overview

                18.1.6.5.1. Marketing Strategy

        18.1.7. Schneider Electric

            18.1.7.1. Overview

            18.1.7.2. Product Portfolio

            18.1.7.3. Profitability by Market Segments

            18.1.7.4. Sales Footprint

            18.1.7.5. Strategy Overview

                18.1.7.5.1. Marketing Strategy

        18.1.8. Comarch SA

            18.1.8.1. Overview

            18.1.8.2. Product Portfolio

            18.1.8.3. Profitability by Market Segments

            18.1.8.4. Sales Footprint

            18.1.8.5. Strategy Overview

                18.1.8.5.1. Marketing Strategy

        18.1.9. ABB

            18.1.9.1. Overview

            18.1.9.2. Product Portfolio

            18.1.9.3. Profitability by Market Segments

            18.1.9.4. Sales Footprint

            18.1.9.5. Strategy Overview

                18.1.9.5.1. Marketing Strategy

        18.1.10. Huawei Technologies Co., Ltd.

            18.1.10.1. Overview

            18.1.10.2. Product Portfolio

            18.1.10.3. Profitability by Market Segments

            18.1.10.4. Sales Footprint

            18.1.10.5. Strategy Overview

                18.1.10.5.1. Marketing Strategy

19. Assumptions & Acronyms Used

20. Research Methodology

List of Tables

Table 1: Global Market Value (US$ Million) Forecast by Region, 2018 to 2033

Table 2: Global Market Value (US$ Million) Forecast by Component, 2018 to 2033

Table 3: Global Market Value (US$ Million) Forecast by Size, 2018 to 2033

Table 4: Global Market Value (US$ Million) Forecast by Industry, 2018 to 2033

Table 5: North America Market Value (US$ Million) Forecast by Country, 2018 to 2033

Table 6: North America Market Value (US$ Million) Forecast by Component, 2018 to 2033

Table 7: North America Market Value (US$ Million) Forecast by Size, 2018 to 2033

Table 8: North America Market Value (US$ Million) Forecast by Industry, 2018 to 2033

Table 9: Latin America Market Value (US$ Million) Forecast by Country, 2018 to 2033

Table 10: Latin America Market Value (US$ Million) Forecast by Component, 2018 to 2033

Table 11: Latin America Market Value (US$ Million) Forecast by Size, 2018 to 2033

Table 12: Latin America Market Value (US$ Million) Forecast by Industry, 2018 to 2033

Table 13: Europe Market Value (US$ Million) Forecast by Country, 2018 to 2033

Table 14: Europe Market Value (US$ Million) Forecast by Component, 2018 to 2033

Table 15: Europe Market Value (US$ Million) Forecast by Size, 2018 to 2033

Table 16: Europe Market Value (US$ Million) Forecast by Industry, 2018 to 2033

Table 17: South Asia Market Value (US$ Million) Forecast by Country, 2018 to 2033

Table 18: South Asia Market Value (US$ Million) Forecast by Component, 2018 to 2033

Table 19: South Asia Market Value (US$ Million) Forecast by Size, 2018 to 2033

Table 20: South Asia Market Value (US$ Million) Forecast by Industry, 2018 to 2033

Table 21: East Asia Market Value (US$ Million) Forecast by Country, 2018 to 2033

Table 22: East Asia Market Value (US$ Million) Forecast by Component, 2018 to 2033

Table 23: East Asia Market Value (US$ Million) Forecast by Size, 2018 to 2033

Table 24: East Asia Market Value (US$ Million) Forecast by Industry, 2018 to 2033

Table 25: Oceania Market Value (US$ Million) Forecast by Country, 2018 to 2033

Table 26: Oceania Market Value (US$ Million) Forecast by Component, 2018 to 2033

Table 27: Oceania Market Value (US$ Million) Forecast by Size, 2018 to 2033

Table 28: Oceania Market Value (US$ Million) Forecast by Industry, 2018 to 2033

Table 29: MEA Market Value (US$ Million) Forecast by Country, 2018 to 2033

Table 30: MEA Market Value (US$ Million) Forecast by Component, 2018 to 2033

Table 31: MEA Market Value (US$ Million) Forecast by Size, 2018 to 2033

Table 32: MEA Market Value (US$ Million) Forecast by Industry, 2018 to 2033

List of Charts

Figure 1: Global Market Value (US$ Million) by Component, 2023 to 2033

Figure 2: Global Market Value (US$ Million) by Size, 2023 to 2033

Figure 3: Global Market Value (US$ Million) by Industry, 2023 to 2033

Figure 4: Global Market Value (US$ Million) by Region, 2023 to 2033

Figure 5: Global Market Value (US$ Million) Analysis by Region, 2018 to 2033

Figure 6: Global Market Value Share (%) and BPS Analysis by Region, 2023 to 2033

Figure 7: Global Market Y-o-Y Growth (%) Projections by Region, 2023 to 2033

Figure 8: Global Market Value (US$ Million) Analysis by Component, 2018 to 2033

Figure 9: Global Market Value Share (%) and BPS Analysis by Component, 2023 to 2033

Figure 10: Global Market Y-o-Y Growth (%) Projections by Component, 2023 to 2033

Figure 11: Global Market Value (US$ Million) Analysis by Size, 2018 to 2033

Figure 12: Global Market Value Share (%) and BPS Analysis by Size, 2023 to 2033

Figure 13: Global Market Y-o-Y Growth (%) Projections by Size, 2023 to 2033

Figure 14: Global Market Value (US$ Million) Analysis by Industry, 2018 to 2033

Figure 15: Global Market Value Share (%) and BPS Analysis by Industry, 2023 to 2033

Figure 16: Global Market Y-o-Y Growth (%) Projections by Industry, 2023 to 2033

Figure 17: Global Market Attractiveness by Component, 2023 to 2033

Figure 18: Global Market Attractiveness by Size, 2023 to 2033

Figure 19: Global Market Attractiveness by Industry, 2023 to 2033

Figure 20: Global Market Attractiveness by Region, 2023 to 2033

Figure 21: North America Market Value (US$ Million) by Component, 2023 to 2033

Figure 22: North America Market Value (US$ Million) by Size, 2023 to 2033

Figure 23: North America Market Value (US$ Million) by Industry, 2023 to 2033

Figure 24: North America Market Value (US$ Million) by Country, 2023 to 2033

Figure 25: North America Market Value (US$ Million) Analysis by Country, 2018 to 2033

Figure 26: North America Market Value Share (%) and BPS Analysis by Country, 2023 to 2033

Figure 27: North America Market Y-o-Y Growth (%) Projections by Country, 2023 to 2033

Figure 28: North America Market Value (US$ Million) Analysis by Component, 2018 to 2033

Figure 29: North America Market Value Share (%) and BPS Analysis by Component, 2023 to 2033

Figure 30: North America Market Y-o-Y Growth (%) Projections by Component, 2023 to 2033

Figure 31: North America Market Value (US$ Million) Analysis by Size, 2018 to 2033

Figure 32: North America Market Value Share (%) and BPS Analysis by Size, 2023 to 2033

Figure 33: North America Market Y-o-Y Growth (%) Projections by Size, 2023 to 2033

Figure 34: North America Market Value (US$ Million) Analysis by Industry, 2018 to 2033

Figure 35: North America Market Value Share (%) and BPS Analysis by Industry, 2023 to 2033

Figure 36: North America Market Y-o-Y Growth (%) Projections by Industry, 2023 to 2033

Figure 37: North America Market Attractiveness by Component, 2023 to 2033

Figure 38: North America Market Attractiveness by Size, 2023 to 2033

Figure 39: North America Market Attractiveness by Industry, 2023 to 2033

Figure 40: North America Market Attractiveness by Country, 2023 to 2033

Figure 41: Latin America Market Value (US$ Million) by Component, 2023 to 2033

Figure 42: Latin America Market Value (US$ Million) by Size, 2023 to 2033

Figure 43: Latin America Market Value (US$ Million) by Industry, 2023 to 2033

Figure 44: Latin America Market Value (US$ Million) by Country, 2023 to 2033

Figure 45: Latin America Market Value (US$ Million) Analysis by Country, 2018 to 2033

Figure 46: Latin America Market Value Share (%) and BPS Analysis by Country, 2023 to 2033

Figure 47: Latin America Market Y-o-Y Growth (%) Projections by Country, 2023 to 2033

Figure 48: Latin America Market Value (US$ Million) Analysis by Component, 2018 to 2033

Figure 49: Latin America Market Value Share (%) and BPS Analysis by Component, 2023 to 2033

Figure 50: Latin America Market Y-o-Y Growth (%) Projections by Component, 2023 to 2033

Figure 51: Latin America Market Value (US$ Million) Analysis by Size, 2018 to 2033

Figure 52: Latin America Market Value Share (%) and BPS Analysis by Size, 2023 to 2033

Figure 53: Latin America Market Y-o-Y Growth (%) Projections by Size, 2023 to 2033

Figure 54: Latin America Market Value (US$ Million) Analysis by Industry, 2018 to 2033

Figure 55: Latin America Market Value Share (%) and BPS Analysis by Industry, 2023 to 2033

Figure 56: Latin America Market Y-o-Y Growth (%) Projections by Industry, 2023 to 2033

Figure 57: Latin America Market Attractiveness by Component, 2023 to 2033

Figure 58: Latin America Market Attractiveness by Size, 2023 to 2033

Figure 59: Latin America Market Attractiveness by Industry, 2023 to 2033

Figure 60: Latin America Market Attractiveness by Country, 2023 to 2033

Figure 61: Europe Market Value (US$ Million) by Component, 2023 to 2033

Figure 62: Europe Market Value (US$ Million) by Size, 2023 to 2033

Figure 63: Europe Market Value (US$ Million) by Industry, 2023 to 2033

Figure 64: Europe Market Value (US$ Million) by Country, 2023 to 2033

Figure 65: Europe Market Value (US$ Million) Analysis by Country, 2018 to 2033

Figure 66: Europe Market Value Share (%) and BPS Analysis by Country, 2023 to 2033

Figure 67: Europe Market Y-o-Y Growth (%) Projections by Country, 2023 to 2033

Figure 68: Europe Market Value (US$ Million) Analysis by Component, 2018 to 2033

Figure 69: Europe Market Value Share (%) and BPS Analysis by Component, 2023 to 2033

Figure 70: Europe Market Y-o-Y Growth (%) Projections by Component, 2023 to 2033

Figure 71: Europe Market Value (US$ Million) Analysis by Size, 2018 to 2033

Figure 72: Europe Market Value Share (%) and BPS Analysis by Size, 2023 to 2033

Figure 73: Europe Market Y-o-Y Growth (%) Projections by Size, 2023 to 2033

Figure 74: Europe Market Value (US$ Million) Analysis by Industry, 2018 to 2033

Figure 75: Europe Market Value Share (%) and BPS Analysis by Industry, 2023 to 2033

Figure 76: Europe Market Y-o-Y Growth (%) Projections by Industry, 2023 to 2033

Figure 77: Europe Market Attractiveness by Component, 2023 to 2033

Figure 78: Europe Market Attractiveness by Size, 2023 to 2033

Figure 79: Europe Market Attractiveness by Industry, 2023 to 2033

Figure 80: Europe Market Attractiveness by Country, 2023 to 2033

Figure 81: South Asia Market Value (US$ Million) by Component, 2023 to 2033

Figure 82: South Asia Market Value (US$ Million) by Size, 2023 to 2033

Figure 83: South Asia Market Value (US$ Million) by Industry, 2023 to 2033

Figure 84: South Asia Market Value (US$ Million) by Country, 2023 to 2033

Figure 85: South Asia Market Value (US$ Million) Analysis by Country, 2018 to 2033

Figure 86: South Asia Market Value Share (%) and BPS Analysis by Country, 2023 to 2033

Figure 87: South Asia Market Y-o-Y Growth (%) Projections by Country, 2023 to 2033

Figure 88: South Asia Market Value (US$ Million) Analysis by Component, 2018 to 2033

Figure 89: South Asia Market Value Share (%) and BPS Analysis by Component, 2023 to 2033

Figure 90: South Asia Market Y-o-Y Growth (%) Projections by Component, 2023 to 2033

Figure 91: South Asia Market Value (US$ Million) Analysis by Size, 2018 to 2033

Figure 92: South Asia Market Value Share (%) and BPS Analysis by Size, 2023 to 2033

Figure 93: South Asia Market Y-o-Y Growth (%) Projections by Size, 2023 to 2033

Figure 94: South Asia Market Value (US$ Million) Analysis by Industry, 2018 to 2033

Figure 95: South Asia Market Value Share (%) and BPS Analysis by Industry, 2023 to 2033

Figure 96: South Asia Market Y-o-Y Growth (%) Projections by Industry, 2023 to 2033

Figure 97: South Asia Market Attractiveness by Component, 2023 to 2033

Figure 98: South Asia Market Attractiveness by Size, 2023 to 2033

Figure 99: South Asia Market Attractiveness by Industry, 2023 to 2033

Figure 100: South Asia Market Attractiveness by Country, 2023 to 2033

Figure 101: East Asia Market Value (US$ Million) by Component, 2023 to 2033

Figure 102: East Asia Market Value (US$ Million) by Size, 2023 to 2033

Figure 103: East Asia Market Value (US$ Million) by Industry, 2023 to 2033

Figure 104: East Asia Market Value (US$ Million) by Country, 2023 to 2033

Figure 105: East Asia Market Value (US$ Million) Analysis by Country, 2018 to 2033

Figure 106: East Asia Market Value Share (%) and BPS Analysis by Country, 2023 to 2033

Figure 107: East Asia Market Y-o-Y Growth (%) Projections by Country, 2023 to 2033

Figure 108: East Asia Market Value (US$ Million) Analysis by Component, 2018 to 2033

Figure 109: East Asia Market Value Share (%) and BPS Analysis by Component, 2023 to 2033

Figure 110: East Asia Market Y-o-Y Growth (%) Projections by Component, 2023 to 2033

Figure 111: East Asia Market Value (US$ Million) Analysis by Size, 2018 to 2033

Figure 112: East Asia Market Value Share (%) and BPS Analysis by Size, 2023 to 2033

Figure 113: East Asia Market Y-o-Y Growth (%) Projections by Size, 2023 to 2033

Figure 114: East Asia Market Value (US$ Million) Analysis by Industry, 2018 to 2033

Figure 115: East Asia Market Value Share (%) and BPS Analysis by Industry, 2023 to 2033

Figure 116: East Asia Market Y-o-Y Growth (%) Projections by Industry, 2023 to 2033

Figure 117: East Asia Market Attractiveness by Component, 2023 to 2033

Figure 118: East Asia Market Attractiveness by Size, 2023 to 2033

Figure 119: East Asia Market Attractiveness by Industry, 2023 to 2033

Figure 120: East Asia Market Attractiveness by Country, 2023 to 2033

Figure 121: Oceania Market Value (US$ Million) by Component, 2023 to 2033

Figure 122: Oceania Market Value (US$ Million) by Size, 2023 to 2033

Figure 123: Oceania Market Value (US$ Million) by Industry, 2023 to 2033

Figure 124: Oceania Market Value (US$ Million) by Country, 2023 to 2033

Figure 125: Oceania Market Value (US$ Million) Analysis by Country, 2018 to 2033

Figure 126: Oceania Market Value Share (%) and BPS Analysis by Country, 2023 to 2033

Figure 127: Oceania Market Y-o-Y Growth (%) Projections by Country, 2023 to 2033

Figure 128: Oceania Market Value (US$ Million) Analysis by Component, 2018 to 2033

Figure 129: Oceania Market Value Share (%) and BPS Analysis by Component, 2023 to 2033

Figure 130: Oceania Market Y-o-Y Growth (%) Projections by Component, 2023 to 2033

Figure 131: Oceania Market Value (US$ Million) Analysis by Size, 2018 to 2033

Figure 132: Oceania Market Value Share (%) and BPS Analysis by Size, 2023 to 2033

Figure 133: Oceania Market Y-o-Y Growth (%) Projections by Size, 2023 to 2033

Figure 134: Oceania Market Value (US$ Million) Analysis by Industry, 2018 to 2033

Figure 135: Oceania Market Value Share (%) and BPS Analysis by Industry, 2023 to 2033

Figure 136: Oceania Market Y-o-Y Growth (%) Projections by Industry, 2023 to 2033

Figure 137: Oceania Market Attractiveness by Component, 2023 to 2033

Figure 138: Oceania Market Attractiveness by Size, 2023 to 2033

Figure 139: Oceania Market Attractiveness by Industry, 2023 to 2033

Figure 140: Oceania Market Attractiveness by Country, 2023 to 2033

Figure 141: MEA Market Value (US$ Million) by Component, 2023 to 2033

Figure 142: MEA Market Value (US$ Million) by Size, 2023 to 2033

Figure 143: MEA Market Value (US$ Million) by Industry, 2023 to 2033

Figure 144: MEA Market Value (US$ Million) by Country, 2023 to 2033

Figure 145: MEA Market Value (US$ Million) Analysis by Country, 2018 to 2033

Figure 146: MEA Market Value Share (%) and BPS Analysis by Country, 2023 to 2033

Figure 147: MEA Market Y-o-Y Growth (%) Projections by Country, 2023 to 2033

Figure 148: MEA Market Value (US$ Million) Analysis by Component, 2018 to 2033

Figure 149: MEA Market Value Share (%) and BPS Analysis by Component, 2023 to 2033

Figure 150: MEA Market Y-o-Y Growth (%) Projections by Component, 2023 to 2033

Figure 151: MEA Market Value (US$ Million) Analysis by Size, 2018 to 2033

Figure 152: MEA Market Value Share (%) and BPS Analysis by Size, 2023 to 2033

Figure 153: MEA Market Y-o-Y Growth (%) Projections by Size, 2023 to 2033

Figure 154: MEA Market Value (US$ Million) Analysis by Industry, 2018 to 2033

Figure 155: MEA Market Value Share (%) and BPS Analysis by Industry, 2023 to 2033

Figure 156: MEA Market Y-o-Y Growth (%) Projections by Industry, 2023 to 2033

Figure 157: MEA Market Attractiveness by Component, 2023 to 2033

Figure 158: MEA Market Attractiveness by Size, 2023 to 2033

Figure 159: MEA Market Attractiveness by Industry, 2023 to 2033

Figure 160: MEA Market Attractiveness by Country, 2023 to 2033

Explore Technology Insights

View Reports