The Data Centre Colocation Market is estimated to be valued at USD 80.1 billion in 2025 and is projected to reach USD 301.0 billion by 2035, registering a compound annual growth rate (CAGR) of 14.2% over the forecast period.
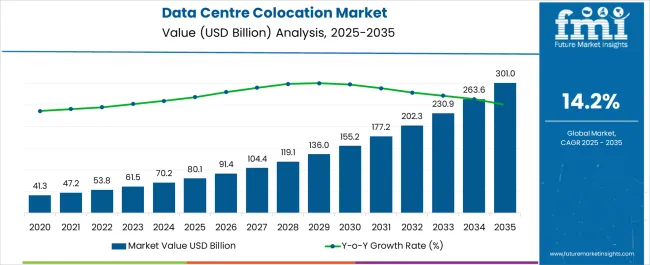
| Metric | Value |
|---|---|
| Data Centre Colocation Market Estimated Value in (2025 E) | USD 80.1 billion |
| Data Centre Colocation Market Forecast Value in (2035 F) | USD 301.0 billion |
| Forecast CAGR (2025 to 2035) | 14.2% |
The data centre colocation market is witnessing robust growth. Rising digital transformation initiatives, increased cloud adoption, and expanding enterprise IT infrastructure requirements are driving demand. Current market dynamics are shaped by the growing need for scalable, secure, and cost-effective data storage solutions.
Regulatory compliance and data sovereignty considerations are influencing deployment strategies, while service providers are investing in energy-efficient and high-performance facilities to enhance reliability. The future outlook is supported by expansion in small and medium enterprises, increasing demand for hybrid IT environments, and advancements in networking technologies that require low-latency connectivity.
Growth rationale is founded on the continued importance of colocation services in reducing capital expenditure for businesses, enabling flexible IT operations, and ensuring high availability and disaster recovery capabilities Strategic investments in connectivity, infrastructure resilience, and modular facility designs are expected to sustain market adoption and drive consistent revenue growth across global regions.
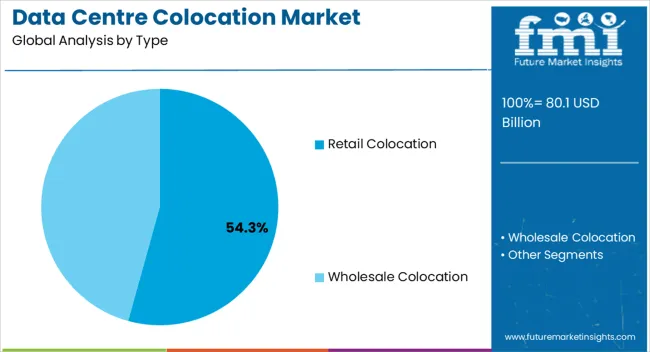
The retail colocation segment, holding 54.30% of the type category, has been leading due to its ability to provide flexible, fully-managed solutions tailored for multiple tenants and enterprise sizes. Demand has been reinforced by the need for secure and resilient infrastructure without the burden of owning physical facilities.
Operational efficiencies, including scalable power and cooling capabilities, have enhanced reliability and service levels. Adoption has been supported by strong service-level agreements and integrated support services that ensure high uptime and rapid issue resolution.
Continued investment in advanced monitoring, automation, and energy optimization technologies has strengthened market confidence The segment’s dominance is expected to persist as enterprises increasingly prefer managed, multi-tenant colocation services for cost efficiency, operational flexibility, and compliance with evolving IT governance requirements.
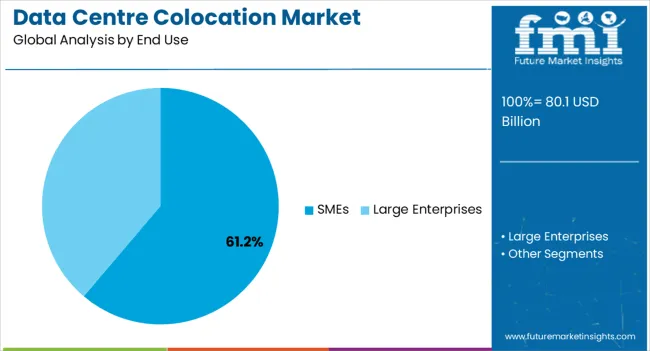
The SMEs segment, representing 61.20% of the end use category, has maintained leadership due to rapid adoption of cloud-based and outsourced IT infrastructure to support business growth. Demand has been driven by cost-sensitive organizations seeking scalable solutions without heavy capital expenditure.
The segment benefits from flexible service packages, predictable operational costs, and enhanced data security provided by colocation providers. SMEs are increasingly leveraging colocation services for disaster recovery, business continuity, and to support digital transformation initiatives.
Continued expansion of small and medium enterprise ecosystems, combined with growing IT literacy and infrastructure needs, is expected to sustain the segment’s market share and reinforce its contribution to overall market growth.
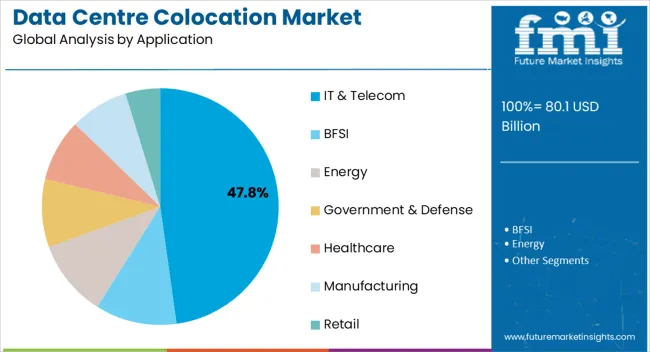
The IT & telecom application segment, accounting for 47.80% of the application category, has been leading due to the critical need for reliable and high-performance infrastructure to support networking, cloud services, and enterprise IT operations. Adoption has been facilitated by increasing data traffic, virtualization, and bandwidth-intensive applications that require low-latency and high-availability facilities.
Investments in redundant systems, robust connectivity, and optimized cooling have enhanced service quality. The segment benefits from strong demand from telecom operators, cloud service providers, and enterprise IT departments seeking resilient colocation solutions.
Continuous technological advancements and expansion of digital services are expected to maintain the segment’s market share and drive incremental growth in the data centre colocation market.
Between 2020 and 2025, global data centre colocation market registered a CAGR of 12.6%. The increasing adoption of data centre colocation in small and large enterprises are expected to drive the market growth during the forecast period.
The growing need for scalable and efficient IT infrastructure are driving the need for data centre colocation. Increasing advancements in technology, such as virtualization, cloud computing, and high-speed connectivity, influenced colocation services.
Adherence to specific regulations regarding data sovereignty and compliance will remain a priority. Colocation providers will offer solutions tailored to meet diverse regulatory requirements across regions. The demand for data centre colocation is projected to rise at a CAGR of 14.9% from 2025 to 2035.
| Market Value 2025 | USD 61.5 billion |
|---|---|
| Market Value in 2035 | USD 69.7 billion |
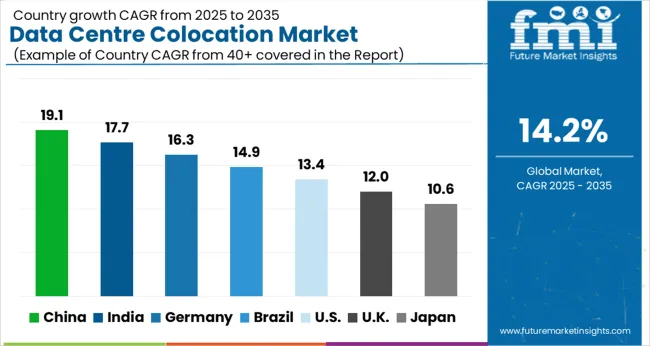
The following table shows the top five countries by revenue, led by Australia and Japan. Colocation facilities complement cloud strategies by providing hosting options, connectivity, and hybrid solutions for businesses leveraging cloud services in Australia. These two countries are predicted to boost their data centre colocation efforts through 2035.
Forecast CAGRs from 2025 to 2035
| Japan | 16.1% |
|---|---|
| The United States | 12.7% |
| China | 15.4% |
| Australia | 18.4% |
| Germany | 14.4% |
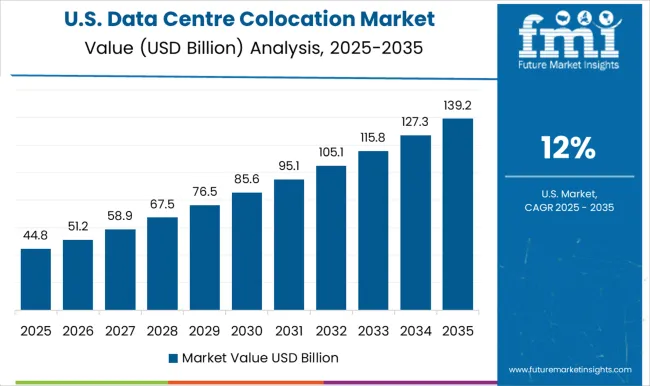
The data centre colocation market in United States is expected to witness a CAGR of 12.7% by 2035.The market size has been growing steadily due to increased digitization across industries, the adoption of cloud services, and the demand for scalable and reliable data infrastructure.
The demand for data centre colocation services in the United States is fueled by factors such as cloud adoption, IoT proliferation, edge computing requirements, content delivery networks (CDNs), and the need for robust connectivity.
The data centre colocation market in United states is continues to evolve, driven by technological advancements, changing business needs, and the growing importance of reliable, scalable, and secure data infrastructure.
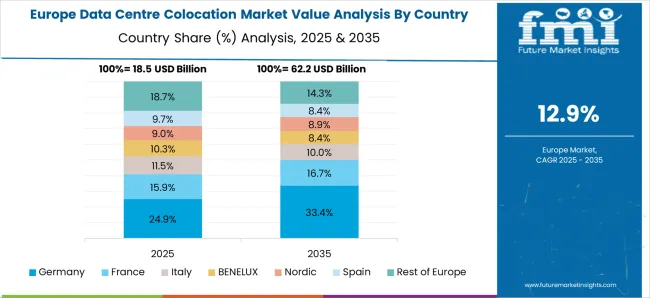
Data centre colocation market in Germany is expected to grow with a CAGR of 14.4% from 2025 to 2035. The rising proliferation of IoT devices, along with the growth of big data and analytics, generates vast amounts of data driving the need for colocation facilities that provide the necessary infrastructure to manage and process this data efficiently.
Germany places emphasis on sustainability and green initiatives. Colocation providers focusing on energy-efficient data centres and renewable energy sources align with the country's environmental goals.
Increasing adoption of cloud services in China necessitates reliable data centres to support cloud infrastructure. Colocation facilities complement cloud strategies, providing connectivity and hosting options for businesses leveraging cloud solutions. The data centre colocation market in China is projected to rise at a CAGR of 15.4% from 2025 to 2035.
China has specific data localization laws requiring certain types of data to be stored within the country's borders driving the demand for colocation services that comply with these regulations attract businesses seeking to adhere to local data sovereignty requirements.
China has a thriving e-commerce ecosystem and a vast digital market are expected to boost the demand for data centre colocation services. Increasing government initiatives supporting technology development and digital innovation drives the demand for advanced data infrastructure.
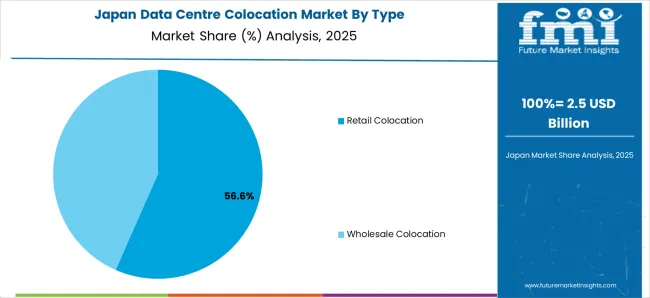
The data centre colocation market in Japan is projected to rise at a CAGR of 16.1% from 2025 to 2035. Japan is embracing IoT and Industry 4.0 technologies across manufacturing and other industries.
Colocation services provide the necessary infrastructure to support IoT deployments and data processing requirements. Colocation centres leverage infrastructure to provide high-speed connectivity and low-latency networks, attracting businesses that require efficient data transmission.
The demand for data centre colocation is expected to rise in Australia. By 2035, the market is expected to expand at a CAGR of 18.4%. Australia has a competitive market with several major colocation providers offering a range of services and solutions, leading to innovation, competitive pricing, and diverse offerings for businesses.
With a growing focus on sustainability, colocation providers in Australia are increasingly adopting renewable energy sources and energy-efficient technologies to reduce their environmental impact.
Government support for technology innovation and digital transformation initiatives further drives the demand for advanced data infrastructure, creating opportunities for colocation providers to support these initiatives.
According to market forecasts, the large enterprises segment will dominate until 2035, with a market share of 63.0%. For large enterprises with extensive IT needs, colocation offers economies of scale, reducing operational costs related to infrastructure maintenance, cooling, power, and staffing. The 3-tier segment is expected to have a share of 45.0%. The 3-tier architecture facilitates easier integration with different technologies or systems.
| Category | Market share |
|---|---|
| Large Enterprises | 63.0% |
| 3-tier | 45.0% |
The large enterprise segment accounted for the maximum share of 63.0% of the overall revenue in 2025. Increasing demand in large business for managing and maintaining data efficiently.
Increasing extensive IT needs, colocation offers economies of scale, reducing operational costs related to infrastructure maintenance, cooling, power, and staffing in large enterprises.
The tier 3 segment accounted for the largest share of around 45% of the overall revenue in 2025 and is projected to continue growing over the forecast period.
The 3-tier architecture facilitates easier integration with different technologies or systems. The modular nature of this architecture often allows for smoother integration of new components or technologies into specific layers. The 3-tier colocation data centres provide some significant benefits such as high availability, scalability, redundant infrastructure and enhanced security.
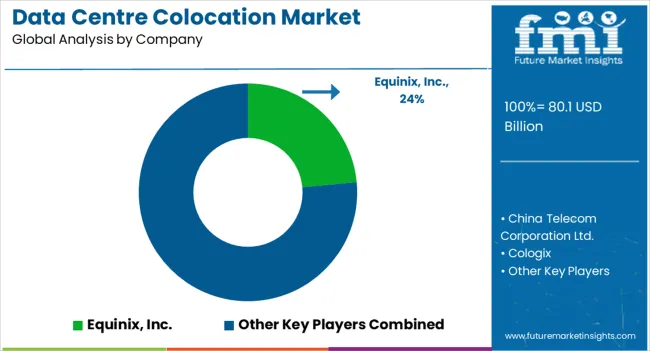
The data centre colocation market is fragmented. Competitive landscape featuring various global and regional players. The market players are using strategies, such as product launches, collaborations, and partnerships, to survive the highly competitive environment and expand their business footprints. Some of the leading players operating in the global data centre colocation market are as follows
Some of the developments in the market are as follows
| Attributes | Details |
|---|---|
| Estimated Market Size in 2025 | USD 80.1 billion |
| Projected Market Valuation in 2035 | USD 301.0 billion |
| Value-based CAGR 2025 to 2035 | 14.2% |
| Forecast Period | 2025 to 2035 |
| Historical Data Available for | 2020 to 2025 |
| Market Analysis | Value in USD billion |
| Key Regions Covered | North America; Latin America; Western Europe; Eastern Europe; South Asia and Pacific; East Asia; Middle East and Africa |
| Key Market Segments Covered | Type, End Use, Application, Region |
| Key Countries Profiled | The United States, Canada, Brazil, Mexico, Germany, The United Kingdom, France, Spain, Italy, Russia, Poland, Czech Republic, Romania, India, Bangladesh, Australia, New Zealand, China, Japan, South Korea, GCC countries, South Africa, Israel |
| Key Companies Profiled | China Telecom Corporation Ltd.; Cologix; Colt Technology Services Group Ltd.; CoreSite; CyrusOne; Cyxtera Technologies, Inc.; Digital Realty Trust; Equinix, Inc.; Iron Mountain Inc.; NTT Ltd.; QTS Realty Trust, LLC; Rackspace Technology; Telehouse; Zayo Group LLC. |
The global data centre colocation market is estimated to be valued at USD 80.1 billion in 2025.
The market size for the data centre colocation market is projected to reach USD 303.1 billion by 2035.
The data centre colocation market is expected to grow at a 14.2% CAGR between 2025 and 2035.
The key product types in data centre colocation market are retail colocation and wholesale colocation.
In terms of end use, smes segment to command 61.2% share in the data centre colocation market in 2025.


Full Research Suite comprises of:
Market outlook & trends analysis
Interviews & case studies
Strategic recommendations
Vendor profiles & capabilities analysis
5-year forecasts
8 regions and 60+ country-level data splits
Market segment data splits
12 months of continuous data updates
DELIVERED AS:
PDF EXCEL ONLINE
Data Center Market Forecast and Outlook 2025 to 2035
DataOps Platform Market Size and Share Forecast Outlook 2025 to 2035
Datacenter Infrastructure Services Market Size and Share Forecast Outlook 2025 to 2035
Data Acquisition Hardware Market Size and Share Forecast Outlook 2025 to 2035
Data Center Automatic Transfer Switches and Switchgears Market Size and Share Forecast Outlook 2025 to 2035
Data Discovery Market Size and Share Forecast Outlook 2025 to 2035
Data Masking Technology Market Size and Share Forecast Outlook 2025 to 2035
Data Center Power Management Industry Analysis in Western Europe Size and Share Forecast Outlook 2025 to 2035
Data Center Power Management Industry Analysis in Korea Size and Share Forecast Outlook 2025 to 2035
Data Center Liquid Cooling Market Size and Share Forecast Outlook 2025 to 2035
Data Business in Oil & Gas Market Size and Share Forecast Outlook 2025 to 2035
Data Lake Market Size and Share Forecast Outlook 2025 to 2035
Data Center RFID Market Size and Share Forecast Outlook 2025 to 2035
Data Center Accelerator Market Size and Share Forecast Outlook 2025 to 2035
Data Lakehouse Market Size and Share Forecast Outlook 2025 to 2035
Data Center Outsourcing Market Size and Share Forecast Outlook 2025 to 2035
Data Center Refrigerant Market Size and Share Forecast Outlook 2025 to 2035
Data Center Fire Detection And Suppression Market Size and Share Forecast Outlook 2025 to 2035
Data Center Security Market Size and Share Forecast Outlook 2025 to 2035
Data Center Construction Market Size and Share Forecast Outlook 2025 to 2035

Thank you!
You will receive an email from our Business Development Manager. Please be sure to check your SPAM/JUNK folder too.
Chat With
MaRIA