Reports

- Global Locations -

Headquarters

Future Market Insights, Inc.

Christiana Corporate, 200
Continental Drive, Suite 401,
Newark, Delaware - 19713,
United States

T: +1-845-579-5705

Americas

Future Market Insights, Inc.

616 Corporate Way, Suite 2-9018,
Valley Cottage, NY 10989, United States

T: +1-347-918-3531

MEA

Future Market Insights

1602-6 Jumeirah Bay X2 Tower, Plot No: JLT-PH2-X2A,
Jumeirah Lakes Towers, Dubai,
United Arab Emirates

Europe

Future Market Insights

3rd Floor, 207 Regent Street,
W1B 3HH London
United Kingdom

T: + 44 (0) 20 8123 9659
D: +44 (0) 20 3287 4268

Asia Pacific

Future Market Insights

IndiaLand Global Tech Park, Unit UG-1, Behind Grand HighStreet, Phase 1, Hinjawadi, MH, Pune – 411057, India

Automated Machine Learning Market Snapshot from 2024 to 2034

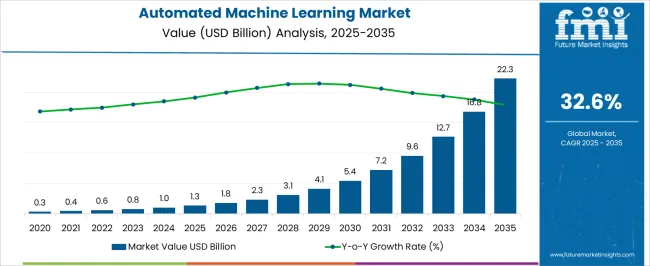
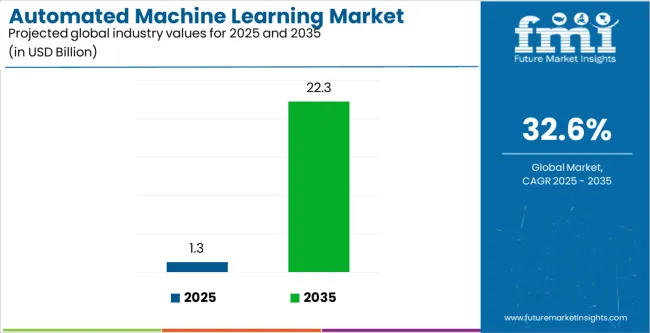
The automated machine learning market had an estimated market share worth US$ 700 million in 2023, and it is predicted to reach a global market valuation of US$ 42.2 billion by 2034, growing at a steady CAGR of 44.9% from 2024 to 2034.

The market for automated machine learning is being driven by rising customer demand for comfort and lavish features in cars. Temperature sensors make it possible for advanced temperature control systems to function, guaranteeing each individual level of comfort and satisfying the increasing consumer demands for high-end driving experiences.

Automated Machine Learning Demand Outlook

  • By streamlining the process of developing models, automated machine learning reduces the amount of time and money spent on activities like feature engineering, data preparation, and hyperparameter tuning.
  • It democratizes AI, allowing non-experts to use resilient machine learning models to make data-driven decisions.
  • These systems facilitate the smooth scaling of AI projects for enterprises by effectively managing different and big datasets.
  • Automated machine learning promotes innovation and maintains an organization's competitiveness in ever-changing markets by enabling quick testing and iteration.
Report Attribute Details
Estimated Market Value for 2023 US$ 700 million
Expected Market Value for 2024 US$ 1 billion
Projected Forecast Value for 2034 US$ 42.2 billion
Anticipated Growth Rate from 2024 to 2034 44.9% CAGR

Don't pay for what you don't need

Customize your report by selecting specific countries or regions and save 30%!

Automated Machine Learning Market Historical Analysis from 2019 to 2023 vs. Forecast Outlook from 2024 to 2034

The global demand for automated machine learning market was estimated to reach a valuation of US$ 0.1 billion in 2019, according to a report from Future Market Insights (FMI). From 2019 to 2023, sales witnessed significant growth in the automated machine learning market, registering a CAGR of 48.2%.

Historical CAGR from 2019 to 2023 48.2%
Forecast CAGR from 2024 to 2034 44.9%

A driving factor is the growing intricacy of datasets, which calls for sophisticated analytics methods. Organizations may effectively extract important insights by using automated machine learning to handle a variety of data types, including unstructured, semi-structured, and structured data. This expertise is essential for being competitive in data-rich contexts across sectors.

Some important factors that will boost the market growth through 2034 are:

  • Continuous advancements in AI algorithms and processing capacity will increase the capabilities and efficiency of automated machine learning.
  • Better access to a wide range of quality datasets will accelerate the creation and uptake of automated machine learning solutions.
  • Automated machine learning technology will be more widely invested in and used when there are clear and supportive regulatory environments.
  • Enhanced cooperation between industries and technology suppliers will result in customized solutions and quicken market expansion.

Key Factors Driving the Automated Machine Learning Market

Shortage of Skilled Data Scientists to Push Companies towards Automated Machine Learning

The need to address the scarcity of qualified data scientists as well as machine learning specialists is a significant factor driving the market for automated machine learning. With the exponential expansion of data, the need for data-driven insights is outpacing the availability of expertise to meet that demand.

Automated machine learning platforms democratize AI by allowing non-experts to successfully design and deploy machine learning models. These platforms enable organizations to exploit AI technology without depending only on expensive and limited knowledge by automating repetitive jobs and simplifying complicated procedures. This accelerates the adoption of machine learning across multiple sectors.

Sudip Saha
Sudip Saha

Principal Consultant

Talk to Analyst

Find your sweet spots for generating winning opportunities in this market.

Increasing Need for Data Driven Processes to Enhance the Global Demand

The growing need for data-driven decision-making across sectors is one of the factors driving the market for automated machine learning. Automated machine learning streamlines the model development process, which helps firms get useful insights from large datasets.

Organizations may gain a competitive advantage and accelerate the deployment of machine learning models by automating processes like feature engineering, data preparation, and model selection. The increased understanding of AI's ability to promote innovation and improve operational efficiency is another factor driving this need.

Factors that can impede the Market Growth

Data Privacy and Decoding Complicated Data to Impede Market Growth

The market for automated machine learning is constrained by issues with data privacy, the difficulty of interpreting complicated models, and the lack of qualified workers who can use AI technology efficiently. Widespread adoption is further hampered by difficulties integrating automated machine learning into current workflows and the requirement for open regulatory frameworks.

To fully realize the potential of automated machine learning across companies, overcoming these obstacles will require resolving ethical issues, improving model interpretability, and funding educational and training programs.

Get the data you need at a Fraction of the cost

Personalize your report by choosing insights you need
and save 40%!

Category-wise Insights

This section focuses on providing detailed analysis of two particular market segments for automated machine learning, the dominant solution type and the significant automation type. The two main segments discussed below are standalone solution and feature engineering type.

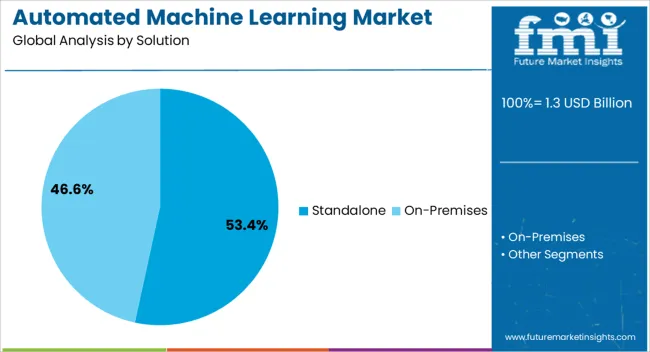
Standalone Automated Machine Learning to Gain Popularity in the Next Decade

Solution Type Standalone
CAGR from 2024 to 2034 44.7%

During the forecast period, the standalone segment is likely to garner a 44.7% CAGR. Standalone automated machine learning will gain popularity as firms seek simplified AI solutions that do not require large infrastructure. With their intuitive interfaces and comprehensive automation, these stand-alone systems let companies quickly implement machine learning models with no technical knowledge.

These technologies, which emphasize the democratization of AI, enable users from all industries to take use of sophisticated analytics, promoting efficiency and creativity. Standalone solutions are flexible and scalable, meeting a range of business requirements and hastening the global adoption of AI technology.

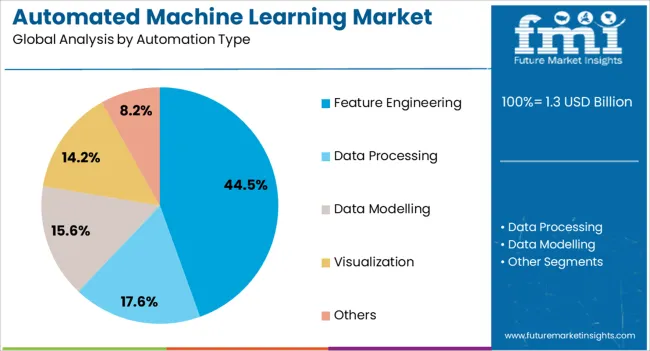
By Automation Type, Feature Engineering to gain Popularity in 2024

Automation Type Feature Engineering
Market Share in 2024 44.5%

In 2024, the feature engineering segment is likely to acquire a 52.4% global market share. Feature engineering will gain popularity in the global automated machine learning market owing to its importance in improving model performance and interpretability. With organizations placing a growing emphasis on gleaning insightful information from intricate datasets, automated feature engineering techniques will become indispensable.

These tools allow speedier model building and deployment by automating the process of choosing, manipulating, and producing features. This helps firms stay competitive in a data-driven environment and extract actionable insights more quickly.

Comparative View of Adjacent Markets

In this section, analysis will be drawn among three relevant markets. These are the automated machine learning market, robotic process automation market and artificial intelligence (AI) in automotive market.

The goal of operational efficiency, cost reduction, and innovation are the same driving forces for all these markets. Companies in all of these areas want to use modern technology to improve decision-making, expedite procedures, and maintain their competitiveness in the quickly changing digital market.

Automated Machine Learning Market:

Market Name Automated Machine Learning Market
CAGR from 2024 to 2034 44.9%
Growth Factor One factor propelling the global market for automated machine learning is the growing need from various sectors for effective data analysis and decision-making.
Future Opportunities Future developments in natural language processing might lead to more natural and seamless human-computer interactions in a range of applications, which presents an opportunity for automated machine learning.

Robotic Process Automation Market:

Market Name Robotic Process Automation Market
CAGR from 2024 to 2034 22.8%
Growth Factor The need for robotic process automation (RPA) technology is being driven by the growing need for cutting-edge technologies like artificial intelligence, cloud computing, and machine learning to manage complicated data and information and automate business operations.
Future Opportunities In the near future, robotic process automation technologies will find a prosperous environment thanks to the increasing integration of cutting-edge technology like cloud, artificial intelligence (AI), machine learning, and cognitive technologies for business automation.

Artificial Intelligence (AI) in Automotive Market:

Market Name Artificial Intelligence (AI) in Automotive Market
CAGR from 2024 to 2034 55%
Growth Factor The need for AI-integrated automotive systems is being driven by the rise in smart and autonomous vehicles as well as the increased use of smartphones.
Future Opportunities Opportunities for AI providers are created by robust and sophisticated software support for the transmission and other automotive components.

Region-wise Analysis

The markets for automated machine learning in a few significant countries, including the United States, the United Kingdom, China, Japan, and South Korea, will be covered in detail in this section. The section will focus on the primary reasons driving up demand for automated machine learning in these countries.

Countries CAGR from 2024 to 2034
The United States 45%
The United Kingdom 46.1%
China 45.4%
Japan 46%
South Korea 47.2%

Government Funding in the United States to Enhance Demand for Automated Machine Learning Solutions

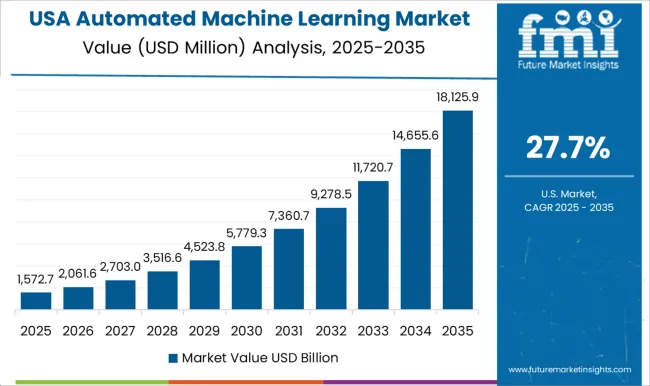
The United States automated machine learning is anticipated to gain a CAGR of 45% through 2034. Factors that are bolstering the growth are:

  • As a center of the world's technology, the United States significantly advances AI research and development by promoting the application of automated machine learning in sectors such as Silicon Valley.
  • American businesses boost efficiency and competitiveness in a changing market by incorporating automated machine learning within their operations for supply chain optimization, customer analytics, and predictive maintenance.
  • In an effort to strengthen national security and enhance citizen services, the United States also utilizes automated machine learning applications in public services, healthcare, and military with government funding and assistance.

Prevalence of a Robust Financial Sector in the United Kingdom to encourage Automated Machine Learning Uptake

The market in the United Kingdom is expected to expand with a 46.1% CAGR through 2034. The factors pushing the growth are:

  • The financial services sector in the United Kingdom uses automated machine learning to improve operational efficiency and regulatory compliance through fraud detection, risk management, and algorithmic trading.
  • In order to improve healthcare outcomes and efficiency while alleviating demand on healthcare systems, the United Kingdom is adopting automated machine learning to assist with patient evaluation, therapy optimization, and resource allocation.
  • From retail to energy, the various sectors of the country use automated machine learning for predictive analytics, consumer segmentation, and process optimization to boost productivity and competitiveness.

A Robust Digital Economy to Spur Industry Growth in China

The automated machine learning ecosystem in China is anticipated to develop with a 45.4% CAGR from 2024 to 2034. The drivers behind this growth are:

  • China's enormous population and digital economy create massive amounts of data on a daily basis. In order to effectively analyze this data and derive insights for company improvement and innovation, automated machine learning is essential.
  • The government actively encourages the development of AI, creating an atmosphere that is favorable to the adoption of automated machine learning. Companies are encouraged to use AI technology for competitiveness and economic growth through investments and policies.
  • The rapidly expanding e-commerce industry in China mostly relies on data-driven decision-making. E-commerce systems may customize suggestions, improve user experiences, and optimize marketing campaigns with automated machine learning, which increases revenue and establishes a dominant market position.

Precision and Efficiency in Manufacturing in Japan to bolster Demand

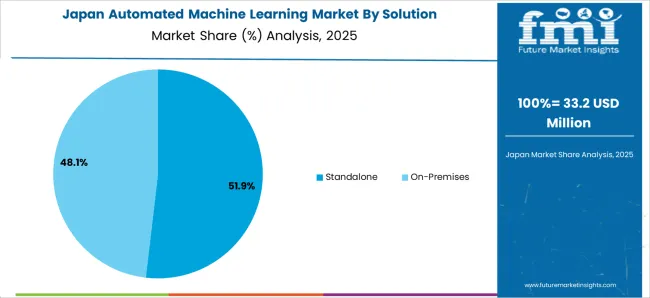
The automated machine learning industry in Japan is anticipated to reach a 46% CAGR from 2024 to 2034. The drivers propelling growth forward are:
  • Precision and efficiency are highly valued in the manufacturing industry in Japan, which fuels the need for automated machine learning to streamline workflows, improve product quality, and save expenses.
  • Japan is looking for automated machine learning solutions for analyzing healthcare data more effectively due to its aging population. These solutions would help with illness prediction, individualized therapies, and better healthcare outcomes.
  • Japan is a robotics pioneer that uses automated machine learning to improve robotic capabilities. This allows robots to make intelligent decisions and adapt to changing settings in both the industrial and service sectors.

Increasing Amount of Complicated Data in South Korea to Enhance Demand

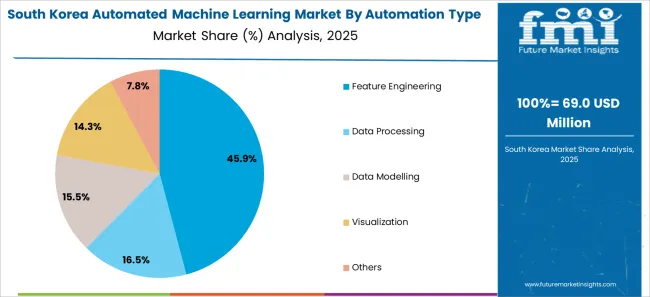
The automated machine learning ecosystem in South Korea is likely to attain a 47.2% CAGR during the forecast period. The factors bolstering the growth are:
  • The various sectors in South Korea are dealing with growing amounts of complicated data, which calls for automated machine learning to effectively manage processes like model selection, data pretreatment, and optimization to produce insights that can be put to use.
  • Due to the lack of qualified data scientists in the nation, there is a demand for automated machine learning systems that let non-experts use AI for creativity and decision-making.
  • South Korean businesses look for effective ways to use their data in order to stay competitive. With expedited procedures provided by automated machine learning, businesses may swiftly use predictive models and obtain a competitive advantage.

Market Competition

Companies are concentrating on creating platforms and solutions to democratize and simplify the machine learning process in the global automated machine learning market. Their goal is to enable companies with less data science experience to take full advantage of artificial intelligence (AI). These companies provide tools for automating a range of processes, including as feature engineering, model selection, hyperparameter tweaking, and data preparation.

They provide services to a range of sectors, including manufacturing, healthcare, retail, and finance, allowing them to effectively gather insights and make data-driven choices. These companies offer adaptable solutions designed to meet particular company requirements, placing a strong emphasis on user-friendly interfaces and reliable performance to increase accessibility and adoption. The key players in this market include:

  • Datarobot Inc.
  • Amazon web services Inc.
  • dotData Inc.
  • IBM Corporation
  • Dataiku
  • SAS Institute Inc.
  • Microsoft Corporation
  • Google LLC
  • H2O.ai
  • Aible Inc.

Significant advancements in the automated machine learning sector are being made by key market participants, and these include:

  • In 2023, the pioneer of value-driven artificial intelligence, DataRobot, unveiled new end-to-end capabilities meant to reduce the uncertainty gap in generative AI, speed the development of AI solutions, and increase their practical use. The DataRobot AI Platform has been enhanced to enable enterprises to govern with complete transparency, operate with accuracy and control, and grow quickly and optionally.
  • In 2023, DotData, an innovation leader and top supplier of feature discovery platforms, made dotData Feature Factory available to the general public. With the help of reusable feature discovery assets that were previously unavailable, the recently released platform offers data scientists expanded capability that enables them to approach feature engineering from a data-centric perspective. DotData Py, a Python-based data science automation engine that was initially released in 2018, will be replaced by dotData Feature Factory, which allows a paradigm change in business data solutions.

Report Scope

Report Attribute Details
Growth Rate CAGR of 44.9% from 2024 to 2034
Market value in 2024 US$ 1 billion
Market value in 2034 US$ 42.2 billion
Base Year for Estimation 2023
Historical Data 2019 to 2023
Forecast Period 2024 to 2034
Quantitative Units US$ billion for value
Report Coverage Revenue Forecast, Company Ranking, Competitive Landscape, Growth Factors, Trends, and Pricing Analysis
Segments Covered
  • Solution
  • Automation Type
  • End User
  • Region
Regions Covered
  • North America
  • Latin America
  • Western Europe
  • Eastern Europe
  • South Asia and Pacific
  • East Asia
  • The Middle East & Africa
Countries Profiled
  • The United States
  • Canada
  • Brazil
  • Mexico
  • Germany
  • The United Kingdom
  • France
  • Spain
  • Italy
  • Poland
  • Russia
  • Czech Republic
  • Romania
  • India
  • Bangladesh
  • Australia
  • New Zealand
  • China
  • Japan
  • South Korea
  • GCC Countries
  • South Africa
  • Israel
Key Companies Profiled
  • Datarobot Inc.
  • Amazon Web Services Inc.
  • dotData Inc.
  • IBM Corporation
  • Dataiku
  • SAS Institute Inc.
  • Microsoft Corporation
  • Google LLC
  • H2O.ai
  • Aible Inc.
Customization Scope Available on Request

Key Segments Profiled in the Automated Machine Learning Market

By Solution:

  • Standalone
  • On-Premises

By Automation Type:

  • Feature Engineering
  • Data Processing
  • Data Modelling
  • Visualization
  • Others

By End User:

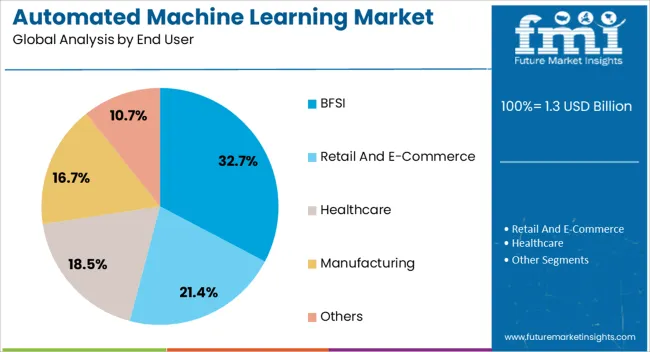
  • BFSI
  • Retail and E-Commerce
  • Healthcare
  • Manufacturing
  • Others

By Region:

  • North America
  • Latin America
  • Western Europe
  • Eastern Europe
  • South Asia and Pacific
  • East Asia
  • Middle East & Africa

Frequently Asked Questions

What is the anticipated growth of the automated machine learning market from 2024 to 2034?

The automated machine learning market is expected to garner a 44.9% CAGR from 2024 to 2034.

What will be the global market outlook for automated machine learning through 2024?

By 2024, the global automated machine learning market is likely to gain US$ 1 billion.

What is the expected global market valuation for automated machine learning by 2034?

By 2034, the automated machine learning market valuation is likely to reach a sum of US$ 42.2 billion.

How will the demand for automated machine learning unfold in the United States?

The automated machine learning industry in the United States is likely to garner a 45.0% CAGR during the forecast period.

Which category can be the top solution for automated machine learning?

The standalone automated machine learning solution will gain significance with a 44.7% CAGR through 2034.

By automation type, which kind is likely to gain popularity?

By 2034, the feature engineering segment is anticipated to gain traction with a 44.5% CAGR from 2024 to 2034.

Table of Content

1. Executive Summary

    1.1. Global Market Outlook

    1.2. Demand-side Trends

    1.3. Supply-side Trends

    1.4. Technology Roadmap Analysis

    1.5. Analysis and Recommendations

2. Market Overview

    2.1. Market Coverage / Taxonomy

    2.2. Market Definition / Scope / Limitations

3. Market Background

    3.1. Market Dynamics

        3.1.1. Drivers

        3.1.2. Restraints

        3.1.3. Opportunity

        3.1.4. Trends

    3.2. Scenario Forecast

        3.2.1. Demand in Optimistic Scenario

        3.2.2. Demand in Likely Scenario

        3.2.3. Demand in Conservative Scenario

    3.3. Opportunity Map Analysis

    3.4. Investment Feasibility Matrix

    3.5. PESTLE and Porter’s Analysis

    3.6. Regulatory Landscape

        3.6.1. By Key Regions

        3.6.2. By Key Countries

    3.7. Regional Parent Market Outlook

4. Global Market Analysis 2019 to 2023 and Forecast, 2024 to 2034

    4.1. Historical Market Size Value (US$ Million) Analysis, 2019 to 2023

    4.2. Current and Future Market Size Value (US$ Million) Projections, 2024 to 2034

        4.2.1. Y-o-Y Growth Trend Analysis

        4.2.2. Absolute $ Opportunity Analysis

5. Global Market Analysis 2019 to 2023 and Forecast 2024 to 2034, By Solution

    5.1. Introduction / Key Findings

    5.2. Historical Market Size Value (US$ Million) Analysis By Solution, 2019 to 2023

    5.3. Current and Future Market Size Value (US$ Million) Analysis and Forecast By Solution, 2024 to 2034

        5.3.1. Standalone

        5.3.2. On-Premises

    5.4. Y-o-Y Growth Trend Analysis By Solution, 2019 to 2023

    5.5. Absolute $ Opportunity Analysis By Solution, 2024 to 2034

6. Global Market Analysis 2019 to 2023 and Forecast 2024 to 2034, By Automation Type

    6.1. Introduction / Key Findings

    6.2. Historical Market Size Value (US$ Million) Analysis By Automation Type, 2019 to 2023

    6.3. Current and Future Market Size Value (US$ Million) Analysis and Forecast By Automation Type, 2024 to 2034

        6.3.1. Feature Engineering

        6.3.2. Data Processing

        6.3.3. Data Modelling

        6.3.4. Visualization

        6.3.5. Others

    6.4. Y-o-Y Growth Trend Analysis By Automation Type, 2019 to 2023

    6.5. Absolute $ Opportunity Analysis By Automation Type, 2024 to 2034

7. Global Market Analysis 2019 to 2023 and Forecast 2024 to 2034, By End-User

    7.1. Introduction / Key Findings

    7.2. Historical Market Size Value (US$ Million) Analysis By End-User, 2019 to 2023

    7.3. Current and Future Market Size Value (US$ Million) Analysis and Forecast By End-User, 2024 to 2034

        7.3.1. BFSI

        7.3.2. Retail and E-Commerce

        7.3.3. Healthcare

        7.3.4. Manufacturing

        7.3.5. Others

    7.4. Y-o-Y Growth Trend Analysis By End-User, 2019 to 2023

    7.5. Absolute $ Opportunity Analysis By End-User, 2024 to 2034

8. Global Market Analysis 2019 to 2023 and Forecast 2024 to 2034, By Region

    8.1. Introduction

    8.2. Historical Market Size Value (US$ Million) Analysis By Region, 2019 to 2023

    8.3. Current Market Size Value (US$ Million) Analysis and Forecast By Region, 2024 to 2034

        8.3.1. North America

        8.3.2. Latin America

        8.3.3. Western Europe

        8.3.4. Eastern Europe

        8.3.5. South Asia and Pacific

        8.3.6. East Asia

        8.3.7. Middle East and Africa

    8.4. Market Attractiveness Analysis By Region

9. North America Market Analysis 2019 to 2023 and Forecast 2024 to 2034, By Country

    9.1. Historical Market Size Value (US$ Million) Trend Analysis By Market Taxonomy, 2019 to 2023

    9.2. Market Size Value (US$ Million) Forecast By Market Taxonomy, 2024 to 2034

        9.2.1. By Country

            9.2.1.1. USA

            9.2.1.2. Canada

        9.2.2. By Solution

        9.2.3. By Automation Type

        9.2.4. By End-User

    9.3. Market Attractiveness Analysis

        9.3.1. By Country

        9.3.2. By Solution

        9.3.3. By Automation Type

        9.3.4. By End-User

    9.4. Key Takeaways

10. Latin America Market Analysis 2019 to 2023 and Forecast 2024 to 2034, By Country

    10.1. Historical Market Size Value (US$ Million) Trend Analysis By Market Taxonomy, 2019 to 2023

    10.2. Market Size Value (US$ Million) Forecast By Market Taxonomy, 2024 to 2034

        10.2.1. By Country

            10.2.1.1. Brazil

            10.2.1.2. Mexico

            10.2.1.3. Rest of Latin America

        10.2.2. By Solution

        10.2.3. By Automation Type

        10.2.4. By End-User

    10.3. Market Attractiveness Analysis

        10.3.1. By Country

        10.3.2. By Solution

        10.3.3. By Automation Type

        10.3.4. By End-User

    10.4. Key Takeaways

11. Western Europe Market Analysis 2019 to 2023 and Forecast 2024 to 2034, By Country

    11.1. Historical Market Size Value (US$ Million) Trend Analysis By Market Taxonomy, 2019 to 2023

    11.2. Market Size Value (US$ Million) Forecast By Market Taxonomy, 2024 to 2034

        11.2.1. By Country

            11.2.1.1. Germany

            11.2.1.2. UK

            11.2.1.3. France

            11.2.1.4. Spain

            11.2.1.5. Italy

            11.2.1.6. Rest of Western Europe

        11.2.2. By Solution

        11.2.3. By Automation Type

        11.2.4. By End-User

    11.3. Market Attractiveness Analysis

        11.3.1. By Country

        11.3.2. By Solution

        11.3.3. By Automation Type

        11.3.4. By End-User

    11.4. Key Takeaways

12. Eastern Europe Market Analysis 2019 to 2023 and Forecast 2024 to 2034, By Country

    12.1. Historical Market Size Value (US$ Million) Trend Analysis By Market Taxonomy, 2019 to 2023

    12.2. Market Size Value (US$ Million) Forecast By Market Taxonomy, 2024 to 2034

        12.2.1. By Country

            12.2.1.1. Poland

            12.2.1.2. Russia

            12.2.1.3. Czech Republic

            12.2.1.4. Romania

            12.2.1.5. Rest of Eastern Europe

        12.2.2. By Solution

        12.2.3. By Automation Type

        12.2.4. By End-User

    12.3. Market Attractiveness Analysis

        12.3.1. By Country

        12.3.2. By Solution

        12.3.3. By Automation Type

        12.3.4. By End-User

    12.4. Key Takeaways

13. South Asia and Pacific Market Analysis 2019 to 2023 and Forecast 2024 to 2034, By Country

    13.1. Historical Market Size Value (US$ Million) Trend Analysis By Market Taxonomy, 2019 to 2023

    13.2. Market Size Value (US$ Million) Forecast By Market Taxonomy, 2024 to 2034

        13.2.1. By Country

            13.2.1.1. India

            13.2.1.2. Bangladesh

            13.2.1.3. Australia

            13.2.1.4. New Zealand

            13.2.1.5. Rest of South Asia and Pacific

        13.2.2. By Solution

        13.2.3. By Automation Type

        13.2.4. By End-User

    13.3. Market Attractiveness Analysis

        13.3.1. By Country

        13.3.2. By Solution

        13.3.3. By Automation Type

        13.3.4. By End-User

    13.4. Key Takeaways

14. East Asia Market Analysis 2019 to 2023 and Forecast 2024 to 2034, By Country

    14.1. Historical Market Size Value (US$ Million) Trend Analysis By Market Taxonomy, 2019 to 2023

    14.2. Market Size Value (US$ Million) Forecast By Market Taxonomy, 2024 to 2034

        14.2.1. By Country

            14.2.1.1. China

            14.2.1.2. Japan

            14.2.1.3. South Korea

        14.2.2. By Solution

        14.2.3. By Automation Type

        14.2.4. By End-User

    14.3. Market Attractiveness Analysis

        14.3.1. By Country

        14.3.2. By Solution

        14.3.3. By Automation Type

        14.3.4. By End-User

    14.4. Key Takeaways

15. Middle East and Africa Market Analysis 2019 to 2023 and Forecast 2024 to 2034, By Country

    15.1. Historical Market Size Value (US$ Million) Trend Analysis By Market Taxonomy, 2019 to 2023

    15.2. Market Size Value (US$ Million) Forecast By Market Taxonomy, 2024 to 2034

        15.2.1. By Country

            15.2.1.1. GCC Countries

            15.2.1.2. South Africa

            15.2.1.3. Israel

            15.2.1.4. Rest of MEA

        15.2.2. By Solution

        15.2.3. By Automation Type

        15.2.4. By End-User

    15.3. Market Attractiveness Analysis

        15.3.1. By Country

        15.3.2. By Solution

        15.3.3. By Automation Type

        15.3.4. By End-User

    15.4. Key Takeaways

16. Key Countries Market Analysis

    16.1. USA

        16.1.1. Pricing Analysis

        16.1.2. Market Share Analysis, 2023

            16.1.2.1. By Solution

            16.1.2.2. By Automation Type

            16.1.2.3. By End-User

    16.2. Canada

        16.2.1. Pricing Analysis

        16.2.2. Market Share Analysis, 2023

            16.2.2.1. By Solution

            16.2.2.2. By Automation Type

            16.2.2.3. By End-User

    16.3. Brazil

        16.3.1. Pricing Analysis

        16.3.2. Market Share Analysis, 2023

            16.3.2.1. By Solution

            16.3.2.2. By Automation Type

            16.3.2.3. By End-User

    16.4. Mexico

        16.4.1. Pricing Analysis

        16.4.2. Market Share Analysis, 2023

            16.4.2.1. By Solution

            16.4.2.2. By Automation Type

            16.4.2.3. By End-User

    16.5. Germany

        16.5.1. Pricing Analysis

        16.5.2. Market Share Analysis, 2023

            16.5.2.1. By Solution

            16.5.2.2. By Automation Type

            16.5.2.3. By End-User

    16.6. UK

        16.6.1. Pricing Analysis

        16.6.2. Market Share Analysis, 2023

            16.6.2.1. By Solution

            16.6.2.2. By Automation Type

            16.6.2.3. By End-User

    16.7. France

        16.7.1. Pricing Analysis

        16.7.2. Market Share Analysis, 2023

            16.7.2.1. By Solution

            16.7.2.2. By Automation Type

            16.7.2.3. By End-User

    16.8. Spain

        16.8.1. Pricing Analysis

        16.8.2. Market Share Analysis, 2023

            16.8.2.1. By Solution

            16.8.2.2. By Automation Type

            16.8.2.3. By End-User

    16.9. Italy

        16.9.1. Pricing Analysis

        16.9.2. Market Share Analysis, 2023

            16.9.2.1. By Solution

            16.9.2.2. By Automation Type

            16.9.2.3. By End-User

    16.10. Poland

        16.10.1. Pricing Analysis

        16.10.2. Market Share Analysis, 2023

            16.10.2.1. By Solution

            16.10.2.2. By Automation Type

            16.10.2.3. By End-User

    16.11. Russia

        16.11.1. Pricing Analysis

        16.11.2. Market Share Analysis, 2023

            16.11.2.1. By Solution

            16.11.2.2. By Automation Type

            16.11.2.3. By End-User

    16.12. Czech Republic

        16.12.1. Pricing Analysis

        16.12.2. Market Share Analysis, 2023

            16.12.2.1. By Solution

            16.12.2.2. By Automation Type

            16.12.2.3. By End-User

    16.13. Romania

        16.13.1. Pricing Analysis

        16.13.2. Market Share Analysis, 2023

            16.13.2.1. By Solution

            16.13.2.2. By Automation Type

            16.13.2.3. By End-User

    16.14. India

        16.14.1. Pricing Analysis

        16.14.2. Market Share Analysis, 2023

            16.14.2.1. By Solution

            16.14.2.2. By Automation Type

            16.14.2.3. By End-User

    16.15. Bangladesh

        16.15.1. Pricing Analysis

        16.15.2. Market Share Analysis, 2023

            16.15.2.1. By Solution

            16.15.2.2. By Automation Type

            16.15.2.3. By End-User

    16.16. Australia

        16.16.1. Pricing Analysis

        16.16.2. Market Share Analysis, 2023

            16.16.2.1. By Solution

            16.16.2.2. By Automation Type

            16.16.2.3. By End-User

    16.17. New Zealand

        16.17.1. Pricing Analysis

        16.17.2. Market Share Analysis, 2023

            16.17.2.1. By Solution

            16.17.2.2. By Automation Type

            16.17.2.3. By End-User

    16.18. China

        16.18.1. Pricing Analysis

        16.18.2. Market Share Analysis, 2023

            16.18.2.1. By Solution

            16.18.2.2. By Automation Type

            16.18.2.3. By End-User

    16.19. Japan

        16.19.1. Pricing Analysis

        16.19.2. Market Share Analysis, 2023

            16.19.2.1. By Solution

            16.19.2.2. By Automation Type

            16.19.2.3. By End-User

    16.20. South Korea

        16.20.1. Pricing Analysis

        16.20.2. Market Share Analysis, 2023

            16.20.2.1. By Solution

            16.20.2.2. By Automation Type

            16.20.2.3. By End-User

    16.21. GCC Countries

        16.21.1. Pricing Analysis

        16.21.2. Market Share Analysis, 2023

            16.21.2.1. By Solution

            16.21.2.2. By Automation Type

            16.21.2.3. By End-User

    16.22. South Africa

        16.22.1. Pricing Analysis

        16.22.2. Market Share Analysis, 2023

            16.22.2.1. By Solution

            16.22.2.2. By Automation Type

            16.22.2.3. By End-User

    16.23. Israel

        16.23.1. Pricing Analysis

        16.23.2. Market Share Analysis, 2023

            16.23.2.1. By Solution

            16.23.2.2. By Automation Type

            16.23.2.3. By End-User

17. Market Structure Analysis

    17.1. Competition Dashboard

    17.2. Competition Benchmarking

    17.3. Market Share Analysis of Top Players

        17.3.1. By Regional

        17.3.2. By Solution

        17.3.3. By Automation Type

        17.3.4. By End-User

18. Competition Analysis

    18.1. Competition Deep Dive

        18.1.1. Datarobot inc.

            18.1.1.1. Overview

            18.1.1.2. Product Portfolio

            18.1.1.3. Profitability by Market Segments

            18.1.1.4. Sales Footprint

            18.1.1.5. Strategy Overview

                18.1.1.5.1. Marketing Strategy

        18.1.2. Amazon web services Inc.

            18.1.2.1. Overview

            18.1.2.2. Product Portfolio

            18.1.2.3. Profitability by Market Segments

            18.1.2.4. Sales Footprint

            18.1.2.5. Strategy Overview

                18.1.2.5.1. Marketing Strategy

        18.1.3. dotData Inc.

            18.1.3.1. Overview

            18.1.3.2. Product Portfolio

            18.1.3.3. Profitability by Market Segments

            18.1.3.4. Sales Footprint

            18.1.3.5. Strategy Overview

                18.1.3.5.1. Marketing Strategy

        18.1.4. IBM Corporation

            18.1.4.1. Overview

            18.1.4.2. Product Portfolio

            18.1.4.3. Profitability by Market Segments

            18.1.4.4. Sales Footprint

            18.1.4.5. Strategy Overview

                18.1.4.5.1. Marketing Strategy

        18.1.5. Dataiku

            18.1.5.1. Overview

            18.1.5.2. Product Portfolio

            18.1.5.3. Profitability by Market Segments

            18.1.5.4. Sales Footprint

            18.1.5.5. Strategy Overview

                18.1.5.5.1. Marketing Strategy

        18.1.6. SAS Institute Inc.

            18.1.6.1. Overview

            18.1.6.2. Product Portfolio

            18.1.6.3. Profitability by Market Segments

            18.1.6.4. Sales Footprint

            18.1.6.5. Strategy Overview

                18.1.6.5.1. Marketing Strategy

        18.1.7. Microsoft Corporation

            18.1.7.1. Overview

            18.1.7.2. Product Portfolio

            18.1.7.3. Profitability by Market Segments

            18.1.7.4. Sales Footprint

            18.1.7.5. Strategy Overview

                18.1.7.5.1. Marketing Strategy

        18.1.8. Google LLC

            18.1.8.1. Overview

            18.1.8.2. Product Portfolio

            18.1.8.3. Profitability by Market Segments

            18.1.8.4. Sales Footprint

            18.1.8.5. Strategy Overview

                18.1.8.5.1. Marketing Strategy

        18.1.9. H2O.ai

            18.1.9.1. Overview

            18.1.9.2. Product Portfolio

            18.1.9.3. Profitability by Market Segments

            18.1.9.4. Sales Footprint

            18.1.9.5. Strategy Overview

                18.1.9.5.1. Marketing Strategy

        18.1.10. Aible Inc.

            18.1.10.1. Overview

            18.1.10.2. Product Portfolio

            18.1.10.3. Profitability by Market Segments

            18.1.10.4. Sales Footprint

            18.1.10.5. Strategy Overview

                18.1.10.5.1. Marketing Strategy

19. Assumptions & Acronyms Used

20. Research Methodology

List of Tables

Table 1: Global Market Value (US$ Million) Forecast by Region, 2019 to 2034

Table 2: Global Market Value (US$ Million) Forecast by Solution, 2019 to 2034

Table 3: Global Market Value (US$ Million) Forecast by Automation Type, 2019 to 2034

Table 4: Global Market Value (US$ Million) Forecast by End-User, 2019 to 2034

Table 5: North America Market Value (US$ Million) Forecast by Country, 2019 to 2034

Table 6: North America Market Value (US$ Million) Forecast by Solution, 2019 to 2034

Table 7: North America Market Value (US$ Million) Forecast by Automation Type, 2019 to 2034

Table 8: North America Market Value (US$ Million) Forecast by End-User, 2019 to 2034

Table 9: Latin America Market Value (US$ Million) Forecast by Country, 2019 to 2034

Table 10: Latin America Market Value (US$ Million) Forecast by Solution, 2019 to 2034

Table 11: Latin America Market Value (US$ Million) Forecast by Automation Type, 2019 to 2034

Table 12: Latin America Market Value (US$ Million) Forecast by End-User, 2019 to 2034

Table 13: Western Europe Market Value (US$ Million) Forecast by Country, 2019 to 2034

Table 14: Western Europe Market Value (US$ Million) Forecast by Solution, 2019 to 2034

Table 15: Western Europe Market Value (US$ Million) Forecast by Automation Type, 2019 to 2034

Table 16: Western Europe Market Value (US$ Million) Forecast by End-User, 2019 to 2034

Table 17: Eastern Europe Market Value (US$ Million) Forecast by Country, 2019 to 2034

Table 18: Eastern Europe Market Value (US$ Million) Forecast by Solution, 2019 to 2034

Table 19: Eastern Europe Market Value (US$ Million) Forecast by Automation Type, 2019 to 2034

Table 20: Eastern Europe Market Value (US$ Million) Forecast by End-User, 2019 to 2034

Table 21: South Asia and Pacific Market Value (US$ Million) Forecast by Country, 2019 to 2034

Table 22: South Asia and Pacific Market Value (US$ Million) Forecast by Solution, 2019 to 2034

Table 23: South Asia and Pacific Market Value (US$ Million) Forecast by Automation Type, 2019 to 2034

Table 24: South Asia and Pacific Market Value (US$ Million) Forecast by End-User, 2019 to 2034

Table 25: East Asia Market Value (US$ Million) Forecast by Country, 2019 to 2034

Table 26: East Asia Market Value (US$ Million) Forecast by Solution, 2019 to 2034

Table 27: East Asia Market Value (US$ Million) Forecast by Automation Type, 2019 to 2034

Table 28: East Asia Market Value (US$ Million) Forecast by End-User, 2019 to 2034

Table 29: Middle East and Africa Market Value (US$ Million) Forecast by Country, 2019 to 2034

Table 30: Middle East and Africa Market Value (US$ Million) Forecast by Solution, 2019 to 2034

Table 31: Middle East and Africa Market Value (US$ Million) Forecast by Automation Type, 2019 to 2034

Table 32: Middle East and Africa Market Value (US$ Million) Forecast by End-User, 2019 to 2034

List of Charts

Figure 1: Global Market Value (US$ Million) by Solution, 2024 to 2034

Figure 2: Global Market Value (US$ Million) by Automation Type, 2024 to 2034

Figure 3: Global Market Value (US$ Million) by End-User, 2024 to 2034

Figure 4: Global Market Value (US$ Million) by Region, 2024 to 2034

Figure 5: Global Market Value (US$ Million) Analysis by Region, 2019 to 2034

Figure 6: Global Market Value Share (%) and BPS Analysis by Region, 2024 to 2034

Figure 7: Global Market Y-o-Y Growth (%) Projections by Region, 2024 to 2034

Figure 8: Global Market Value (US$ Million) Analysis by Solution, 2019 to 2034

Figure 9: Global Market Value Share (%) and BPS Analysis by Solution, 2024 to 2034

Figure 10: Global Market Y-o-Y Growth (%) Projections by Solution, 2024 to 2034

Figure 11: Global Market Value (US$ Million) Analysis by Automation Type, 2019 to 2034

Figure 12: Global Market Value Share (%) and BPS Analysis by Automation Type, 2024 to 2034

Figure 13: Global Market Y-o-Y Growth (%) Projections by Automation Type, 2024 to 2034

Figure 14: Global Market Value (US$ Million) Analysis by End-User, 2019 to 2034

Figure 15: Global Market Value Share (%) and BPS Analysis by End-User, 2024 to 2034

Figure 16: Global Market Y-o-Y Growth (%) Projections by End-User, 2024 to 2034

Figure 17: Global Market Attractiveness by Solution, 2024 to 2034

Figure 18: Global Market Attractiveness by Automation Type, 2024 to 2034

Figure 19: Global Market Attractiveness by End-User, 2024 to 2034

Figure 20: Global Market Attractiveness by Region, 2024 to 2034

Figure 21: North America Market Value (US$ Million) by Solution, 2024 to 2034

Figure 22: North America Market Value (US$ Million) by Automation Type, 2024 to 2034

Figure 23: North America Market Value (US$ Million) by End-User, 2024 to 2034

Figure 24: North America Market Value (US$ Million) by Country, 2024 to 2034

Figure 25: North America Market Value (US$ Million) Analysis by Country, 2019 to 2034

Figure 26: North America Market Value Share (%) and BPS Analysis by Country, 2024 to 2034

Figure 27: North America Market Y-o-Y Growth (%) Projections by Country, 2024 to 2034

Figure 28: North America Market Value (US$ Million) Analysis by Solution, 2019 to 2034

Figure 29: North America Market Value Share (%) and BPS Analysis by Solution, 2024 to 2034

Figure 30: North America Market Y-o-Y Growth (%) Projections by Solution, 2024 to 2034

Figure 31: North America Market Value (US$ Million) Analysis by Automation Type, 2019 to 2034

Figure 32: North America Market Value Share (%) and BPS Analysis by Automation Type, 2024 to 2034

Figure 33: North America Market Y-o-Y Growth (%) Projections by Automation Type, 2024 to 2034

Figure 34: North America Market Value (US$ Million) Analysis by End-User, 2019 to 2034

Figure 35: North America Market Value Share (%) and BPS Analysis by End-User, 2024 to 2034

Figure 36: North America Market Y-o-Y Growth (%) Projections by End-User, 2024 to 2034

Figure 37: North America Market Attractiveness by Solution, 2024 to 2034

Figure 38: North America Market Attractiveness by Automation Type, 2024 to 2034

Figure 39: North America Market Attractiveness by End-User, 2024 to 2034

Figure 40: North America Market Attractiveness by Country, 2024 to 2034

Figure 41: Latin America Market Value (US$ Million) by Solution, 2024 to 2034

Figure 42: Latin America Market Value (US$ Million) by Automation Type, 2024 to 2034

Figure 43: Latin America Market Value (US$ Million) by End-User, 2024 to 2034

Figure 44: Latin America Market Value (US$ Million) by Country, 2024 to 2034

Figure 45: Latin America Market Value (US$ Million) Analysis by Country, 2019 to 2034

Figure 46: Latin America Market Value Share (%) and BPS Analysis by Country, 2024 to 2034

Figure 47: Latin America Market Y-o-Y Growth (%) Projections by Country, 2024 to 2034

Figure 48: Latin America Market Value (US$ Million) Analysis by Solution, 2019 to 2034

Figure 49: Latin America Market Value Share (%) and BPS Analysis by Solution, 2024 to 2034

Figure 50: Latin America Market Y-o-Y Growth (%) Projections by Solution, 2024 to 2034

Figure 51: Latin America Market Value (US$ Million) Analysis by Automation Type, 2019 to 2034

Figure 52: Latin America Market Value Share (%) and BPS Analysis by Automation Type, 2024 to 2034

Figure 53: Latin America Market Y-o-Y Growth (%) Projections by Automation Type, 2024 to 2034

Figure 54: Latin America Market Value (US$ Million) Analysis by End-User, 2019 to 2034

Figure 55: Latin America Market Value Share (%) and BPS Analysis by End-User, 2024 to 2034

Figure 56: Latin America Market Y-o-Y Growth (%) Projections by End-User, 2024 to 2034

Figure 57: Latin America Market Attractiveness by Solution, 2024 to 2034

Figure 58: Latin America Market Attractiveness by Automation Type, 2024 to 2034

Figure 59: Latin America Market Attractiveness by End-User, 2024 to 2034

Figure 60: Latin America Market Attractiveness by Country, 2024 to 2034

Figure 61: Western Europe Market Value (US$ Million) by Solution, 2024 to 2034

Figure 62: Western Europe Market Value (US$ Million) by Automation Type, 2024 to 2034

Figure 63: Western Europe Market Value (US$ Million) by End-User, 2024 to 2034

Figure 64: Western Europe Market Value (US$ Million) by Country, 2024 to 2034

Figure 65: Western Europe Market Value (US$ Million) Analysis by Country, 2019 to 2034

Figure 66: Western Europe Market Value Share (%) and BPS Analysis by Country, 2024 to 2034

Figure 67: Western Europe Market Y-o-Y Growth (%) Projections by Country, 2024 to 2034

Figure 68: Western Europe Market Value (US$ Million) Analysis by Solution, 2019 to 2034

Figure 69: Western Europe Market Value Share (%) and BPS Analysis by Solution, 2024 to 2034

Figure 70: Western Europe Market Y-o-Y Growth (%) Projections by Solution, 2024 to 2034

Figure 71: Western Europe Market Value (US$ Million) Analysis by Automation Type, 2019 to 2034

Figure 72: Western Europe Market Value Share (%) and BPS Analysis by Automation Type, 2024 to 2034

Figure 73: Western Europe Market Y-o-Y Growth (%) Projections by Automation Type, 2024 to 2034

Figure 74: Western Europe Market Value (US$ Million) Analysis by End-User, 2019 to 2034

Figure 75: Western Europe Market Value Share (%) and BPS Analysis by End-User, 2024 to 2034

Figure 76: Western Europe Market Y-o-Y Growth (%) Projections by End-User, 2024 to 2034

Figure 77: Western Europe Market Attractiveness by Solution, 2024 to 2034

Figure 78: Western Europe Market Attractiveness by Automation Type, 2024 to 2034

Figure 79: Western Europe Market Attractiveness by End-User, 2024 to 2034

Figure 80: Western Europe Market Attractiveness by Country, 2024 to 2034

Figure 81: Eastern Europe Market Value (US$ Million) by Solution, 2024 to 2034

Figure 82: Eastern Europe Market Value (US$ Million) by Automation Type, 2024 to 2034

Figure 83: Eastern Europe Market Value (US$ Million) by End-User, 2024 to 2034

Figure 84: Eastern Europe Market Value (US$ Million) by Country, 2024 to 2034

Figure 85: Eastern Europe Market Value (US$ Million) Analysis by Country, 2019 to 2034

Figure 86: Eastern Europe Market Value Share (%) and BPS Analysis by Country, 2024 to 2034

Figure 87: Eastern Europe Market Y-o-Y Growth (%) Projections by Country, 2024 to 2034

Figure 88: Eastern Europe Market Value (US$ Million) Analysis by Solution, 2019 to 2034

Figure 89: Eastern Europe Market Value Share (%) and BPS Analysis by Solution, 2024 to 2034

Figure 90: Eastern Europe Market Y-o-Y Growth (%) Projections by Solution, 2024 to 2034

Figure 91: Eastern Europe Market Value (US$ Million) Analysis by Automation Type, 2019 to 2034

Figure 92: Eastern Europe Market Value Share (%) and BPS Analysis by Automation Type, 2024 to 2034

Figure 93: Eastern Europe Market Y-o-Y Growth (%) Projections by Automation Type, 2024 to 2034

Figure 94: Eastern Europe Market Value (US$ Million) Analysis by End-User, 2019 to 2034

Figure 95: Eastern Europe Market Value Share (%) and BPS Analysis by End-User, 2024 to 2034

Figure 96: Eastern Europe Market Y-o-Y Growth (%) Projections by End-User, 2024 to 2034

Figure 97: Eastern Europe Market Attractiveness by Solution, 2024 to 2034

Figure 98: Eastern Europe Market Attractiveness by Automation Type, 2024 to 2034

Figure 99: Eastern Europe Market Attractiveness by End-User, 2024 to 2034

Figure 100: Eastern Europe Market Attractiveness by Country, 2024 to 2034

Figure 101: South Asia and Pacific Market Value (US$ Million) by Solution, 2024 to 2034

Figure 102: South Asia and Pacific Market Value (US$ Million) by Automation Type, 2024 to 2034

Figure 103: South Asia and Pacific Market Value (US$ Million) by End-User, 2024 to 2034

Figure 104: South Asia and Pacific Market Value (US$ Million) by Country, 2024 to 2034

Figure 105: South Asia and Pacific Market Value (US$ Million) Analysis by Country, 2019 to 2034

Figure 106: South Asia and Pacific Market Value Share (%) and BPS Analysis by Country, 2024 to 2034

Figure 107: South Asia and Pacific Market Y-o-Y Growth (%) Projections by Country, 2024 to 2034

Figure 108: South Asia and Pacific Market Value (US$ Million) Analysis by Solution, 2019 to 2034

Figure 109: South Asia and Pacific Market Value Share (%) and BPS Analysis by Solution, 2024 to 2034

Figure 110: South Asia and Pacific Market Y-o-Y Growth (%) Projections by Solution, 2024 to 2034

Figure 111: South Asia and Pacific Market Value (US$ Million) Analysis by Automation Type, 2019 to 2034

Figure 112: South Asia and Pacific Market Value Share (%) and BPS Analysis by Automation Type, 2024 to 2034

Figure 113: South Asia and Pacific Market Y-o-Y Growth (%) Projections by Automation Type, 2024 to 2034

Figure 114: South Asia and Pacific Market Value (US$ Million) Analysis by End-User, 2019 to 2034

Figure 115: South Asia and Pacific Market Value Share (%) and BPS Analysis by End-User, 2024 to 2034

Figure 116: South Asia and Pacific Market Y-o-Y Growth (%) Projections by End-User, 2024 to 2034

Figure 117: South Asia and Pacific Market Attractiveness by Solution, 2024 to 2034

Figure 118: South Asia and Pacific Market Attractiveness by Automation Type, 2024 to 2034

Figure 119: South Asia and Pacific Market Attractiveness by End-User, 2024 to 2034

Figure 120: South Asia and Pacific Market Attractiveness by Country, 2024 to 2034

Figure 121: East Asia Market Value (US$ Million) by Solution, 2024 to 2034

Figure 122: East Asia Market Value (US$ Million) by Automation Type, 2024 to 2034

Figure 123: East Asia Market Value (US$ Million) by End-User, 2024 to 2034

Figure 124: East Asia Market Value (US$ Million) by Country, 2024 to 2034

Figure 125: East Asia Market Value (US$ Million) Analysis by Country, 2019 to 2034

Figure 126: East Asia Market Value Share (%) and BPS Analysis by Country, 2024 to 2034

Figure 127: East Asia Market Y-o-Y Growth (%) Projections by Country, 2024 to 2034

Figure 128: East Asia Market Value (US$ Million) Analysis by Solution, 2019 to 2034

Figure 129: East Asia Market Value Share (%) and BPS Analysis by Solution, 2024 to 2034

Figure 130: East Asia Market Y-o-Y Growth (%) Projections by Solution, 2024 to 2034

Figure 131: East Asia Market Value (US$ Million) Analysis by Automation Type, 2019 to 2034

Figure 132: East Asia Market Value Share (%) and BPS Analysis by Automation Type, 2024 to 2034

Figure 133: East Asia Market Y-o-Y Growth (%) Projections by Automation Type, 2024 to 2034

Figure 134: East Asia Market Value (US$ Million) Analysis by End-User, 2019 to 2034

Figure 135: East Asia Market Value Share (%) and BPS Analysis by End-User, 2024 to 2034

Figure 136: East Asia Market Y-o-Y Growth (%) Projections by End-User, 2024 to 2034

Figure 137: East Asia Market Attractiveness by Solution, 2024 to 2034

Figure 138: East Asia Market Attractiveness by Automation Type, 2024 to 2034

Figure 139: East Asia Market Attractiveness by End-User, 2024 to 2034

Figure 140: East Asia Market Attractiveness by Country, 2024 to 2034

Figure 141: Middle East and Africa Market Value (US$ Million) by Solution, 2024 to 2034

Figure 142: Middle East and Africa Market Value (US$ Million) by Automation Type, 2024 to 2034

Figure 143: Middle East and Africa Market Value (US$ Million) by End-User, 2024 to 2034

Figure 144: Middle East and Africa Market Value (US$ Million) by Country, 2024 to 2034

Figure 145: Middle East and Africa Market Value (US$ Million) Analysis by Country, 2019 to 2034

Figure 146: Middle East and Africa Market Value Share (%) and BPS Analysis by Country, 2024 to 2034

Figure 147: Middle East and Africa Market Y-o-Y Growth (%) Projections by Country, 2024 to 2034

Figure 148: Middle East and Africa Market Value (US$ Million) Analysis by Solution, 2019 to 2034

Figure 149: Middle East and Africa Market Value Share (%) and BPS Analysis by Solution, 2024 to 2034

Figure 150: Middle East and Africa Market Y-o-Y Growth (%) Projections by Solution, 2024 to 2034

Figure 151: Middle East and Africa Market Value (US$ Million) Analysis by Automation Type, 2019 to 2034

Figure 152: Middle East and Africa Market Value Share (%) and BPS Analysis by Automation Type, 2024 to 2034

Figure 153: Middle East and Africa Market Y-o-Y Growth (%) Projections by Automation Type, 2024 to 2034

Figure 154: Middle East and Africa Market Value (US$ Million) Analysis by End-User, 2019 to 2034

Figure 155: Middle East and Africa Market Value Share (%) and BPS Analysis by End-User, 2024 to 2034

Figure 156: Middle East and Africa Market Y-o-Y Growth (%) Projections by End-User, 2024 to 2034

Figure 157: Middle East and Africa Market Attractiveness by Solution, 2024 to 2034

Figure 158: Middle East and Africa Market Attractiveness by Automation Type, 2024 to 2034

Figure 159: Middle East and Africa Market Attractiveness by End-User, 2024 to 2034

Figure 160: Middle East and Africa Market Attractiveness by Country, 2024 to 2034

Recommendations

Technology

Artificial Intelligence (AI) in Automotive Market

Published : February 2023

Technology

Learning Analytics Solution Market

Published : January 2023

Technology

Robotic Process Automation Market

Published : January 2023

Technology

Automation Testing Market

Published : October 2022

Explore Technology Insights

View Reports

Automated Machine Learning Market