Automated Centrifuge System Market Size, Share, and Forecast Outlook 2025 to 2035

The automated centrifuge system market is expected to expand from USD 1.3 billion in 2025 to approximately USD 2.3 billion by 2035, at a CAGR of 5.7%. The market expanded steadily, driven by increased adoption in clinical diagnostics, molecular biology, and pharmaceutical R&D.
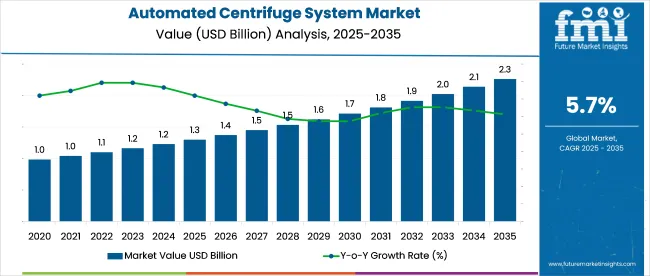
Quick Stats in Automated Centrifuge System Market

  • Market Size (2025): USD 1.3 billion
  • Market Forecast (2035): USD 2.3 billion
  • CAGR (2025 to 2035): 5.7%
  • Top Product Segment: Floor-standing Automated Centrifuges (41.5% share in 2025)
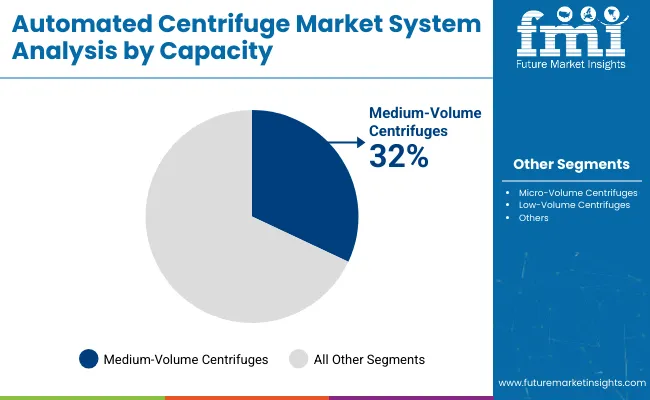
  • Leading Capacity Segment: Medium-volume Centrifuges (32% share in 2025)
  • Top Growing Country: Japan (8.6% CAGR)

Automated Centrifuge System Market

Metric Value
Market Size in 2025 USD 1.3 billion
Projected Market Size in 2035 USD 2.3 billion
CAGR (2025 to 2035) 5.7%

By 2025, demand is expected to remain robust across hospital laboratories and biotechnology firms, as the need for high-throughput and reproducible processing becomes integral to modern lab automation. Integration of centrifuge units with broader laboratory information systems (LIS) and robotics platforms is enhancing operational efficiency and reducing manual errors. Innovations in rotor design, closed-system safety, and programmability are positioning automated centrifuges as a critical component in standardized sample workflows.

The automated centrifuge system market plays a precision-driven role across several high-value sectors. In the USD 8 billion global laboratory automation industry, automated centrifuges account for 4–6%, supported by growing needs for efficiency in diagnostics and research labs. Within the clinical diagnostics equipment market, valued at over USD 60 billion, 5-7% of instrumentation demand is attributed to automated separation systems that enhance sample throughput.

In pharmaceutical R&D and QA labs, which form part of the USD 90 billion drug development tools sector, automated centrifuges represent about 3-5% of capital spending. Biotechnology tools, a USD 80 billion market, allocate around 4-6% to high-speed centrifuges. Even in bioprocessing, 6-8% of equipment budgets are directed to continuous, automated separation systems.

Analyzing Automated Centrifuge System Market by Top Investment Segments

The market is gaining traction due to increasing clinical testing volumes, rising demand for high-throughput diagnostics, and the shift toward fully automated laboratory workflows. Key investment areas include floor-standing units, fully automated systems, and hospital lab applications.
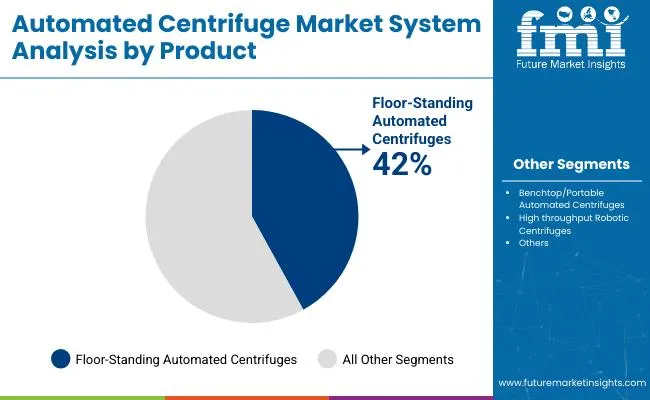
Floor-standing Systems Lead Product Segment with 41.5% Share

Automated Centrifuge System Market Analysis By Product

Floor-standing automated centrifuges are projected to secure 41.5% of the market by 2025. These units offer high-speed operation and larger capacity, making them suitable for centralized labs and high-volume testing facilities.
  • Ideal for hospitals and diagnostic centers requiring continuous sample processing.
  • Floor designs offer stability for high-speed cycles and longer runtimes.
  • Widely used in clinical chemistry and molecular biology laboratories for routine testing.

Medium-volume Capacity Gains Ground with 32% Share

Automated Centrifuge System Market Analysis By Capacity

Medium-volume centrifuges are expected to account for 32% of the total market by 2025. These systems balance processing speed and cost-efficiency, making them ideal for mid-sized labs and regional diagnostic centers.

  • Favored by labs transitioning from manual to semi-automated workflows.
  • Scalable solutions serve both clinical and pharmaceutical research settings.
  • Reliable performance with reduced operational complexity increases adoption.

Fully Automated Systems Dominate with 63% Market Share

Fully automated centrifuges are forecasted to lead the market with 63% share by 2025. These systems streamline sample handling, loading, and unloading, enhancing accuracy and reducing manual labor.
  • Integration with laboratory information systems supports seamless data tracking.
  • Strong adoption in clinical and biotech labs seeking minimal human intervention.
  • Enhanced safety, contamination control, and turnaround time drive global demand.

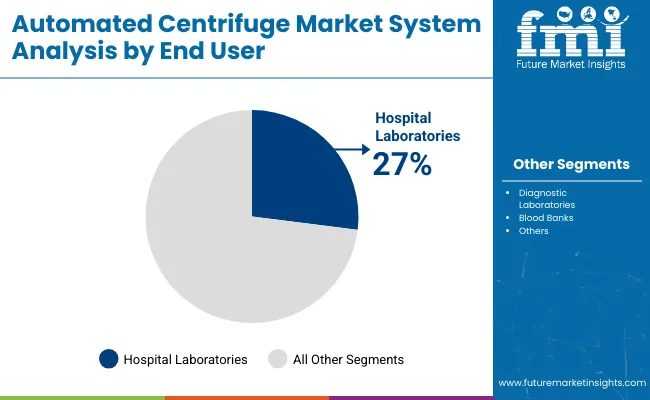
Hospital Laboratories Drive End User Segment with 27% Share

Automated Centrifuge System Market Analysis By End User

Hospital laboratories are projected to hold 27% share of the market by 2025. Growing test volumes, rapid diagnostic needs, and round-the-clock operations are fueling demand in this segment.

  • Hospital labs require high-throughput systems for efficient patient diagnostics.
  • Automated centrifuges reduce sample handling time in urgent care settings.
  • Expanding hospital infrastructure in developing regions supports market growth.

Top Automated Centrifuge System Market Dynamics

Adoption of automated centrifuge systems is accelerating due to rising throughput demands and tighter quality validation in bioprocessing and diagnostics. Advances in rotor programming and sample balancing have cut cycle variability, while demand for compact, high-capacity systems is reshaping procurement in clinical labs and biomanufacturing environments.

High-Throughput Labs Drive Rapid Configuration Adoption

Automated centrifuge systems with programmable rotor switching and pre-set cycle libraries saw a 39% increase in adoption across clinical labs and contract testing centers. Labs processing over 5,000 samples/day reduced setup time by 44% using systems with self-balancing modules. High-speed models (≥18,000 rpm) enabled plasma separation in under 8 minutes, boosting sample clearance by 31% per shift.

Integration with barcode-based tube recognition cut loading errors by 23%, while smart-lid diagnostics trimmed maintenance downtime by 17%. Vendors offering customizable batch protocols gained traction, especially among blood banks and genomic labs prioritizing speed and traceability. These upgrades pushed Cap Ex justification under 15 months in 2025.

Biomanufacturing Demands Precision and Contamination Control

Biopharma firms expanded use of automated centrifuge systems for cell harvesting and virus clarification, with GMP-compliant units accounting for 52% of new installs in 2025. Closed-bowl configurations reduced contamination risk, cutting batch rejection rates by 28% in upstream operations. Inline automation with liquid handlers enabled continuous feed processing, shrinking manual intervention cycles by 34%.

High-volume biologics facilities scaled rotor capacity to 12 L+, raising yield per run by 22% without increasing footprint. Embedded temperature control systems achieved ±0.5°C stability, essential for enzyme and protein preservation. These performance metrics are now central to equipment selection, particularly in mRNA and viral vector production.
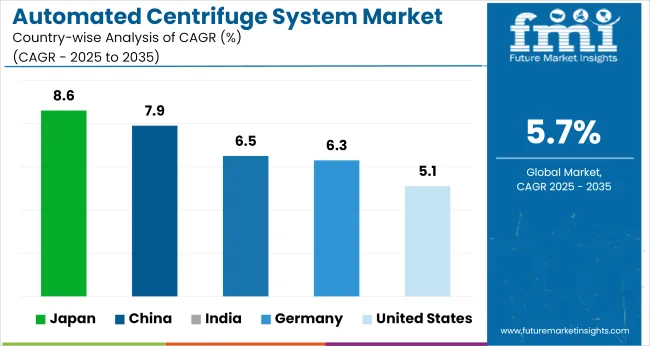
Top Countries Engineering, Deploying, Distributing, and Scaling Automated Centrifuge Systems

Country Wise Analysis Of Automated Centrifuge System Market

Countries CAGR (2025 to 2035)
Japan 8.6%
China 7.9%
India 6.5%
Germany 6.3%
United States 5.1%

The global market is forecast to expand at a global CAGR of 5.7% between 2025 and 2035. Japan shows the highest momentum among the five profiled countries, reaching 8.6%, reflecting rising demand for automation in pharmaceutical manufacturing and diagnostics. China, as a leading BRICS nation, follows closely at 7.9%, propelled by capacity additions in biotech hubs and supportive state investments in laboratory automation.

India also maintains a strong trajectory with a CAGR of 6.5%, outperforming the global baseline by 14%, driven by a growing presence of diagnostic labs and R&D units in Tier 1 and Tier 2 cities. Among OECD members, Germany shows moderate acceleration at 6.3%, driven by upgrades in hospital automation protocols. In contrast, the USA trails at 5.1%, 11% below the global average, influenced by slower adoption cycles in public healthcare institutions and mature demand saturation across key industrial applications.

The report provides insights across 40+ countries. The five below are highlighted for their strategic influence and growth trajectory.

Rising Focus on Biomedical Labs Drives Growth in Japan

The market in Japan is projected to grow at a CAGR of 8.6% between 2025 and 2035. From 2020 to 2024, demand remained largely tied to hospital-based diagnostic labs and university research centers. The new decade is witnessing wider deployment in pharmaceutical QC labs, life sciences R&D, and regenerative medicine facilities. Government funding for cell and gene therapy infrastructure is supporting automation in sample preparation processes, including high-throughput centrifugation.

  • Over 40% of major research institutions plan to upgrade to automated centrifuges by 2028
  • PMDA standards now emphasize full automation in clinical sample handling
  • Demand for closed-loop systems rising in precision oncology labs

China Prioritizes Lab Automation Across Biotech and Academia

China is forecast to expand at a CAGR of 7.9% through 2035. During 2020 to 2024, uptake was primarily seen in national testing centers and COVID-era genomic surveillance labs. Moving forward, automation in centrifuge operations is being adopted across over 600 university biology departments and 100+ biotech parks in Tier 1 and Tier 2 cities. Government-backed modernization of life sciences capabilities is fueling the transition from manual centrifuges to programmable, integrated systems.

  • 72% of biopharma startups surveyed plan to automate centrifugation workflows
  • National Lab Equipment Program subsidizing automated systems through 2030
  • Market penetration rates growing by 15% year-over-year post 2025

India Scales Automation in Diagnostic Chains and CRO Facilities

India is expected to grow at a CAGR of 6.5% from 2025 to 2035. From 2020 to 2024, demand was concentrated in tier-1 diagnostic labs and large hospital networks. The post-2025 period is seeing rapid scale-up across contract research organizations (CROs) and mid-sized pathology labs as automation becomes a key differentiator. AI-integrated centrifuges that enable remote monitoring and batch diagnostics are gaining traction, especially in oncology and molecular biology labs.

  • 300+ new diagnostic labs to be set up under Ayushman Bharat by 2028
  • Automated systems now make up 28% of centrifuge purchases in urban hospitals
  • Growing outsourcing of sample processing to CROs fueling multi-unit deployments

Germany Strengthens Biotech Infrastructure with Automation Initiatives

Germany is projected to grow at a CAGR of 6.3% during the forecast period. Between 2020 and 2024, demand remained focused on university labs and pharmaceutical validation setups. As of 2025, lab automation has become a national priority under the High-Tech Strategy 2025. Automated centrifuges are now integral to modernization efforts in more than 120 publicly funded biotech hubs, especially in Baden-Württemberg, Bavaria, and North Rhine-Westphalia.

  • Federal grants supporting automation in over 400 clinical and R&D labs
  • Compliance with EU MDR boosting adoption in medical device quality testing
  • Manufacturers offering IoT-based centrifuge systems for GMP-certified facilities

USA Market Moves Toward High-Throughput Sample Automation

The United States market is poised to grow at a CAGR of 5.1% from 2025 to 2035. From 2020 to 2024, usage was dominated by hospital labs, CDC testing centers, and pharma manufacturing QC units. Post-pandemic restructuring is accelerating lab automation across commercial labs, with high-throughput automated centrifuges being deployed to process large specimen volumes quickly. Investments in biosample storage, biobanking, and clinical diagnostics are boosting system demand.
  • NIH and BARDA funding automated systems for pandemic preparedness labs
  • Over 2,500 mid-sized labs integrating automated centrifuges with LIMS platforms
  • Growing need for traceability and process control in clinical trials labs

Leading Automated Centrifuge System Suppliers

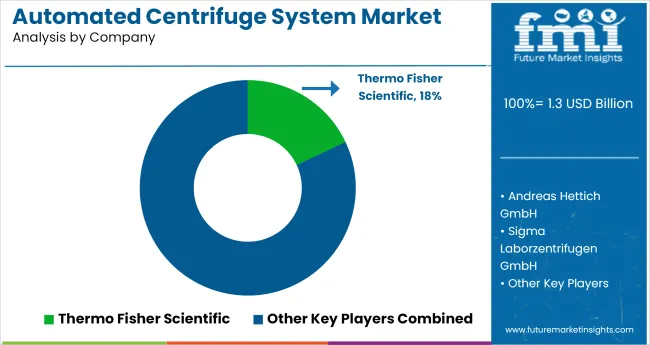
Automated Centrifuge System Market Analysis By Company

The automated centrifuge system market is characterized by strong competition between analytical instrument giants and niche lab automation providers. Thermo Fisher Scientific and Beckman Coulter dominate the market with robust robotic centrifugation platforms integrated into high-throughput clinical and biopharma workflows. Thermo’s CW3 series and Beckman’s Allegra X-30R have widespread adoption in genomics and sample prep due to their integration with LIMS and cloud diagnostics.

Eppendorf SE and Haier Biomedical maintain strong presence in academic and small-lab settings, offering compact, programmable units with safety-lock features and intuitive UIs. Agilent Technologies and HighRes Biosolutions are scaling modular systems designed for drug discovery pipelines, while Sigma Laborzentrifugen and Biosan target the diagnostics segment in Central Europe and the Baltics. Innovation centers on rotor adaptability, automated tube recognition, and HEPA-filtered enclosed chambers to ensure contamination-free operation.

Recent Automated Centrifuge System Industry News

  • In February 2024, Thermo Fisher announced a collaboration with Multiply Labs to automate and integrate cell therapy processes using its CTS Rotea Counterflow Centrifugation System. This initiative boosts efficiency and standardization in automated cell-processing workflows.
  • In January 2024, GEA launched its X Control system an AI-ready control platform for centrifuges. The offering enhances connectivity, cloud integration, and SCADA compatibility, setting the stage for future self‑learning and optimization in separation equipment.

Leading Players in Automated Centrifuge System Market

  • Thermo Fisher Scientific
  • Andreas Hettich GmbH
  • Sigma Laborzentrifugen GmbH
  • HighRes Biosolutions
  • Agilent Technologies
  • BioNex Solutions, Inc.
  • Core Laboratories
  • Beckman Coulter, Inc.
  • Biosan
  • Haier Biomedical
  • Eppendorf SE
  • Tharmac
  • Corning Incorporated

Report Coverage and Scope Summary

Report Attributes Details
Market Size (2025) USD 1.3 billion
Projected Market Size (2035) USD 2.3 billion
CAGR (2025 to 2035) 5.7%
Base Year for Estimation 2024
Historical Period 2020 to 2024
Projections Period 2025 to 2035
Quantitative Units USD billion for market value
Product Types Analyzed (Segment 1) Benchtop/Portable Automated Centrifuges, Floor-Standing Automated Centrifuges, High-Throughput Robotic Centrifuges
Capacities Analyzed (Segment 2) Micro-Volume, Low-Volume, Medium-Volume, Large-Volume
Automation Levels Analyzed (Segment 3) Semi-Automated, Fully Automated
End Users Analyzed (Segment 4) Hospital Laboratories, Diagnostic Laboratories, Blood Banks, Academic & Research Organizations, Biopharmaceutical Companies, Contract Research Organizations, Other Specialized Facilities
Regions Covered North America, Latin America, Western Europe, Eastern Europe, East Asia, South Asia & Pacific, Middle East & Africa
Countries Covered United States, Canada, Germany, United Kingdom, France, Italy, Spain, China, India, Japan, South Korea, Australia, Brazil, Mexico, Argentina, Saudi Arabia, UAE, South Africa
Key Players Thermo Fisher Scientific, Andreas Hettich GmbH, Sigma Laborzentrifugen GmbH, HighRes Biosolutions, Agilent Technologies, BioNex Solutions, Inc., Core Laboratories, Beckman Coulter, Inc., Biosan, Haier Biomedical, Eppendorf SE, Tharmac, Corning Incorporated
Additional Attributes Dollar sales by automation and capacity type, rising demand in high-throughput diagnostics, growing adoption in biopharma research workflows, and increasing shift toward fully integrated lab automation platforms.

Key Segments

By Product:

The market is categorized into benchtop/portable automated centrifuges, floor-standing automated centrifuges, and high-throughput robotic centrifuges. Each type addresses different space, capacity, and automation requirements across laboratory settings.

By Capacity:

Based on sample volume handling, the market includes micro-volume, low-volume, medium-volume, and large-volume centrifuges. This segmentation caters to diverse application needs, from small-scale diagnostics to large-volume bioprocessing.

By Automation:

Automation levels define the market into semi-automated and fully automated centrifuges, with increasing adoption of fully automated systems to reduce human intervention and enhance process consistency.

By End User:

End-use segments comprise hospital laboratories, diagnostic laboratories, blood banks, academic and research organizations, biopharmaceutical companies, contract research organizations, and other specialized facilities requiring automated sample separation.

By Region:

Regional analysis includes North America, Latin America, Western Europe, Eastern Europe, East Asia, South Asia & Pacific, and Middle East & Africa.

Table of Content

  1. Executive Summary
    • Global Market Outlook
    • Demand-side Trends
    • Supply-side Trends
    • Technology Roadmap Analysis
    • Analysis and Recommendations
  2. Market Overview
    • Market Coverage / Taxonomy
    • Market Definition / Scope / Limitations
  3. Market Background
    • Market Dynamics
      • Drivers
      • Restraints
      • Opportunity
      • Trends
    • Scenario Forecast
      • Demand in Optimistic Scenario
      • Demand in Likely Scenario
      • Demand in Conservative Scenario
    • Opportunity Map Analysis
    • Product Life Cycle Analysis
    • Supply Chain Analysis
      • Supply Side Participants and their Roles
        • Producers
        • Mid-Level Participants (Traders/ Agents/ Brokers)
        • Wholesalers and Distributors
      • Value Added and Value Created at Node in the Supply Chain
      • List of Raw Material Suppliers
      • List of Existing and Potential Buyer’s
    • Investment Feasibility Matrix
    • Value Chain Analysis
      • Profit Margin Analysis
      • Wholesalers and Distributors
      • Retailers
    • PESTLE and Porter’s Analysis
    • Regulatory Landscape
      • By Key Regions
      • By Key Countries
    • Regional Parent Market Outlook
    • Production and Consumption Statistics
    • Import and Export Statistics
  4. Global Market Analysis 2020 to 2024 and Forecast, 2025 to 2035
    • Historical Market Size Value (USD Billion) & Volume (Units) Analysis, 2020 to 2024
    • Current and Future Market Size Value (USD Billion) & Volume (Units) Projections, 2025 to 2035
      • Y-o-Y Growth Trend Analysis
      • Absolute $ Opportunity Analysis
  5. Global Market Pricing Analysis 2020 to 2024 and Forecast 2025 to 2035
  6. Global Market Analysis 2020 to 2024 and Forecast 2025 to 2035, By Product
    • Introduction / Key Findings
    • Historical Market Size Value (USD Billion) & Volume (Units) Analysis By Product, 2020 to 2024
    • Current and Future Market Size Value (USD Billion) & Volume (Units) Analysis and Forecast By Product, 2025 to 2035
      • Benchtop/Portable Automated Centrifuges
      • Floor-standing Automated Centrifuges
      • High-throughput Robotic Centrifuges
    • Y-o-Y Growth Trend Analysis By Product, 2020 to 2024
    • Absolute $ Opportunity Analysis By Product, 2025 to 2035
  7. Global Market Analysis 2020 to 2024 and Forecast 2025 to 2035, By Capacity
    • Introduction / Key Findings
    • Historical Market Size Value (USD Billion) & Volume (Units) Analysis By Capacity, 2020 to 2024
    • Current and Future Market Size Value (USD Billion) & Volume (Units) Analysis and Forecast By Capacity, 2025 to 2035
      • Micro-volume Centrifuges
      • Low-volume Centrifuges
      • Medium-volume Centrifuges
      • Large-volume Centrifuges
    • Y-o-Y Growth Trend Analysis By Capacity, 2020 to 2024
    • Absolute $ Opportunity Analysis By Capacity, 2025 to 2035
  8. Global Market Analysis 2020 to 2024 and Forecast 2025 to 2035, By Automation
    • Introduction / Key Findings
    • Historical Market Size Value (USD Billion) & Volume (Units) Analysis By Automation, 2020 to 2024
    • Current and Future Market Size Value (USD Billion) & Volume (Units) Analysis and Forecast By Automation, 2025 to 2035
      • Semi-automated Centrifuges
      • Fully Automated Centrifuges
    • Y-o-Y Growth Trend Analysis By Automation, 2020 to 2024
    • Absolute $ Opportunity Analysis By Automation, 2025 to 2035
  9. Global Market Analysis 2020 to 2024 and Forecast 2025 to 2035, By End User
    • Introduction / Key Findings
    • Historical Market Size Value (USD Billion) & Volume (Units) Analysis By End User, 2020 to 2024
    • Current and Future Market Size Value (USD Billion) & Volume (Units) Analysis and Forecast By End User, 2025 to 2035
      • Hospital Laboratories
      • Diagnostic Laboratories
      • Blood Banks
      • Academic and Rearch Organizations
      • Biopharmaceuticals Companies
      • Contract Research Organization
      • Others
    • Y-o-Y Growth Trend Analysis By End User, 2020 to 2024
    • Absolute $ Opportunity Analysis By End User, 2025 to 2035
  10. Global Market Analysis 2020 to 2024 and Forecast 2025 to 2035, By Region
    • Introduction
    • Historical Market Size Value (USD Billion) & Volume (Units) Analysis By Region, 2020 to 2024
    • Current Market Size Value (USD Billion) & Volume (Units) Analysis and Forecast By Region, 2025 to 2035
      • North America
      • Latin America
      • Western Europe
      • Eastern Europe
      • East Asia
      • South Asia & Pacific
      • Middle East and Africa
    • Market Attractiveness Analysis By Region
  11. North America Market Analysis 2020 to 2024 and Forecast 2025 to 2035, By Country
    • Historical Market Size Value (USD Billion) & Volume (Units) Trend Analysis By Market Taxonomy, 2020 to 2024
    • Market Size Value (USD Billion) & Volume (Units) Forecast By Market Taxonomy, 2025 to 2035
      • By Country
        • USA
        • Canada
        • Mexico
      • By Product
      • By Capacity
      • By Automation
      • By End User
    • Market Attractiveness Analysis
      • By Country
      • By Product
      • By Capacity
      • By Automation
      • By End User
    • Key Takeaways
  12. Latin America Market Analysis 2020 to 2024 and Forecast 2025 to 2035, By Country
    • Historical Market Size Value (USD Billion) & Volume (Units) Trend Analysis By Market Taxonomy, 2020 to 2024
    • Market Size Value (USD Billion) & Volume (Units) Forecast By Market Taxonomy, 2025 to 2035
      • By Country
        • Brazil
        • Argentina
        • Rest of LATAM
      • By Product
      • By Capacity
      • By Automation
      • By End User
    • Market Attractiveness Analysis
      • By Country
      • By Product
      • By Capacity
      • By Automation
      • By End User
    • Key Takeaways
  13. Western Europe Market Analysis 2020 to 2024 and Forecast 2025 to 2035, By Country
    • Historical Market Size Value (USD Billion) & Volume (Units) Trend Analysis By Market Taxonomy, 2020 to 2024
    • Market Size Value (USD Billion) & Volume (Units) Forecast By Market Taxonomy, 2025 to 2035
      • By Country
        • Germany
        • Italy
        • France
        • UK
        • Spain
        • BENELUX
        • Nordic
        • Rest of W.Europe
      • By Product
      • By Capacity
      • By Automation
      • By End User
    • Market Attractiveness Analysis
      • By Country
      • By Product
      • By Capacity
      • By Automation
      • By End User
    • Key Takeaways
  14. Eastern Europe Market Analysis 2020 to 2024 and Forecast 2025 to 2035, By Country
    • Historical Market Size Value (USD Billion) & Volume (Units) Trend Analysis By Market Taxonomy, 2020 to 2024
    • Market Size Value (USD Billion) & Volume (Units) Forecast By Market Taxonomy, 2025 to 2035
      • By Country
        • Russia
        • Hungary
        • Poland
        • Balkan & Baltics
        • Rest of E. Europe
      • By Product
      • By Capacity
      • By Automation
      • By End User
    • Market Attractiveness Analysis
      • By Country
      • By Product
      • By Capacity
      • By Automation
      • By End User
    • Key Takeaways
  15. East Asia Market Analysis 2020 to 2024 and Forecast 2025 to 2035, By Country
    • Historical Market Size Value (USD Billion) & Volume (Units) Trend Analysis By Market Taxonomy, 2020 to 2024
    • Market Size Value (USD Billion) & Volume (Units) Forecast By Market Taxonomy, 2025 to 2035
      • By Country
        • China
        • Japan
        • South Korea
      • By Product
      • By Capacity
      • By Automation
      • By End User
    • Market Attractiveness Analysis
      • By Country
      • By Product
      • By Capacity
      • By Automation
      • By End User
    • Key Takeaways
  16. South Asia & Pacific Market Analysis 2020 to 2024 and Forecast 2025 to 2035, By Country
    • Historical Market Size Value (USD Billion) & Volume (Units) Trend Analysis By Market Taxonomy, 2020 to 2024
    • Market Size Value (USD Billion) & Volume (Units) Forecast By Market Taxonomy, 2025 to 2035
      • By Country
        • India
        • Australia & New Zealand
        • ASEAN
        • Rest of SAP
      • By Product
      • By Capacity
      • By Automation
      • By End User
    • Market Attractiveness Analysis
      • By Country
      • By Product
      • By Capacity
      • By Automation
      • By End User
    • Key Takeaways
  17. Middle East and Africa Market Analysis 2020 to 2024 and Forecast 2025 to 2035, By Country
    • Historical Market Size Value (USD Billion) & Volume (Units) Trend Analysis By Market Taxonomy, 2020 to 2024
    • Market Size Value (USD Billion) & Volume (Units) Forecast By Market Taxonomy, 2025 to 2035
      • By Country
        • GCC Countries
        • Northern Africa
        • South Africa
        • Turkiye
        • Rest of MEA
      • By Product
      • By Capacity
      • By Automation
      • By End User
    • Market Attractiveness Analysis
      • By Country
      • By Product
      • By Capacity
      • By Automation
      • By End User
    • Key Takeaways
  18. Key Countries Market Analysis
    • USA
      • Pricing Analysis
      • Market Share Analysis, 2024
        • By Product
        • By Capacity
        • By Automation
        • By End User
    • Canada
      • Pricing Analysis
      • Market Share Analysis, 2024
        • By Product
        • By Capacity
        • By Automation
        • By End User
    • Brazil
      • Pricing Analysis
      • Market Share Analysis, 2024
        • By Product
        • By Capacity
        • By Automation
        • By End User
    • Mexico
      • Pricing Analysis
      • Market Share Analysis, 2024
        • By Product
        • By Capacity
        • By Automation
        • By End User
    • Argentina
      • Pricing Analysis
      • Market Share Analysis, 2024
        • By Product
        • By Capacity
        • By Automation
        • By End User
  19. Market Structure Analysis
    • Competition Dashboard
    • Competition Benchmarking
    • Market Share Analysis of Top Players
      • By Regional
      • By Product
      • By Capacity
      • By Automation
      • By End User
  20. Competition Analysis
    • Competition Deep Dive
      • Thermo Fisher Scientific
        • Overview
        • Product Portfolio
        • Profitability by Market Segments (Product/Age /Sales Channel/Region)
        • Sales Footprint
        • Strategy Overview
          • Marketing Strategy
          • Product Strategy
          • Channel Strategy
      • Andreas Hettich GmbH
        • Overview
        • Product Portfolio
        • Profitability by Market Segments (Product/Age /Sales Channel/Region)
        • Sales Footprint
        • Strategy Overview
          • Marketing Strategy
          • Product Strategy
          • Channel Strategy
      • Sigma Laborzentrifugen GmbH
        • Overview
        • Product Portfolio
        • Profitability by Market Segments (Product/Age /Sales Channel/Region)
        • Sales Footprint
        • Strategy Overview
          • Marketing Strategy
          • Product Strategy
          • Channel Strategy
      • HighRes Biosolutions
        • Overview
        • Product Portfolio
        • Profitability by Market Segments (Product/Age /Sales Channel/Region)
        • Sales Footprint
        • Strategy Overview
          • Marketing Strategy
          • Product Strategy
          • Channel Strategy
      • Agilent Technologies
        • Overview
        • Product Portfolio
        • Profitability by Market Segments (Product/Age /Sales Channel/Region)
        • Sales Footprint
        • Strategy Overview
          • Marketing Strategy
          • Product Strategy
          • Channel Strategy
      • BioNex Solutions, Inc.
        • Overview
        • Product Portfolio
        • Profitability by Market Segments (Product/Age /Sales Channel/Region)
        • Sales Footprint
        • Strategy Overview
          • Marketing Strategy
          • Product Strategy
          • Channel Strategy
      • Core Laboratories
        • Overview
        • Product Portfolio
        • Profitability by Market Segments (Product/Age /Sales Channel/Region)
        • Sales Footprint
        • Strategy Overview
          • Marketing Strategy
          • Product Strategy
          • Channel Strategy
      • Beckman Coulter, Inc.
        • Overview
        • Product Portfolio
        • Profitability by Market Segments (Product/Age /Sales Channel/Region)
        • Sales Footprint
        • Strategy Overview
          • Marketing Strategy
          • Product Strategy
          • Channel Strategy
      • Biosan
        • Overview
        • Product Portfolio
        • Profitability by Market Segments (Product/Age /Sales Channel/Region)
        • Sales Footprint
        • Strategy Overview
          • Marketing Strategy
          • Product Strategy
          • Channel Strategy
      • Haier Biomedical
        • Overview
        • Product Portfolio
        • Profitability by Market Segments (Product/Age /Sales Channel/Region)
        • Sales Footprint
        • Strategy Overview
          • Marketing Strategy
          • Product Strategy
          • Channel Strategy
      • Eppendorf SE
        • Overview
        • Product Portfolio
        • Profitability by Market Segments (Product/Age /Sales Channel/Region)
        • Sales Footprint
        • Strategy Overview
          • Marketing Strategy
          • Product Strategy
          • Channel Strategy
      • Tharmac
        • Overview
        • Product Portfolio
        • Profitability by Market Segments (Product/Age /Sales Channel/Region)
        • Sales Footprint
        • Strategy Overview
          • Marketing Strategy
          • Product Strategy
          • Channel Strategy
      • Corning Incorporated
        • Overview
        • Product Portfolio
        • Profitability by Market Segments (Product/Age /Sales Channel/Region)
        • Sales Footprint
        • Strategy Overview
          • Marketing Strategy
          • Product Strategy
          • Channel Strategy
  21. Assumptions & Acronyms Used
  22. Research Methodology

List of Tables

  • Table 1: Global Market Value (USD Billion) Forecast by Region, 2020-2035
  • Table 2: Global Market Volume (Units) Forecast by Region, 2020-2035
  • Table 3: Global Market Value (USD Billion) Forecast By Product, 2020-2035
  • Table 4: Global Market Volume (Units) Forecast By Product, 2020-2035
  • Table 5: Global Market Value (USD Billion) Forecast By Capacity, 2020-2035
  • Table 6: Global Market Volume (Units) Forecast By Capacity, 2020-2035
  • Table 7: Global Market Value (USD Billion) Forecast By Automation, 2020-2035
  • Table 8: Global Market Volume (Units) Forecast By Automation, 2020-2035
  • Table 9: Global Market Value (USD Billion) Forecast By End User, 2020-2035
  • Table 10: Global Market Volume (Units) Forecast By End User, 2020-2035
  • Table 11: North America Market Value (USD Billion) Forecast by Country, 2020-2035
  • Table 12: North America Market Volume (Units) Forecast by Country, 2020-2035
  • Table 13: North America Market Value (USD Billion) Forecast By Product, 2020-2035
  • Table 14: North America Market Volume (Units) Forecast By Product, 2020-2035
  • Table 15: North America Market Value (USD Billion) Forecast By Capacity, 2020-2035
  • Table 16: North America Market Volume (Units) Forecast By Capacity, 2020-2035
  • Table 17: North America Market Value (USD Billion) Forecast By Automation, 2020-2035
  • Table 18: North America Market Volume (Units) Forecast By Automation, 2020-2035
  • Table 19: North America Market Value (USD Billion) Forecast By End User, 2020-2035
  • Table 20: North America Market Volume (Units) Forecast By End User, 2020-2035
  • Table 21: Latin America Market Value (USD Billion) Forecast by Country, 2020-2035
  • Table 22: Latin America Market Volume (Units) Forecast by Country, 2020-2035
  • Table 23: Latin America Market Value (USD Billion) Forecast By Product, 2020-2035
  • Table 24: Latin America Market Volume (Units) Forecast By Product, 2020-2035
  • Table 25: Latin America Market Value (USD Billion) Forecast By Capacity, 2020-2035
  • Table 26: Latin America Market Volume (Units) Forecast By Capacity, 2020-2035
  • Table 27: Latin America Market Value (USD Billion) Forecast By Automation, 2020-2035
  • Table 28: Latin America Market Volume (Units) Forecast By Automation, 2020-2035
  • Table 29: Latin America Market Value (USD Billion) Forecast By End User, 2020-2035
  • Table 30: Latin America Market Volume (Units) Forecast By End User, 2020-2035
  • Table 31: Western Europe Market Value (USD Billion) Forecast by Country, 2020-2035
  • Table 32: Western Europe Market Volume (Units) Forecast by Country, 2020-2035
  • Table 33: Western Europe Market Value (USD Billion) Forecast By Product, 2020-2035
  • Table 34: Western Europe Market Volume (Units) Forecast By Product, 2020-2035
  • Table 35: Western Europe Market Value (USD Billion) Forecast By Capacity, 2020-2035
  • Table 36: Western Europe Market Volume (Units) Forecast By Capacity, 2020-2035
  • Table 37: Western Europe Market Value (USD Billion) Forecast By Automation, 2020-2035
  • Table 38: Western Europe Market Volume (Units) Forecast By Automation, 2020-2035
  • Table 39: Western Europe Market Value (USD Billion) Forecast By End User, 2020-2035
  • Table 40: Western Europe Market Volume (Units) Forecast By End User, 2020-2035
  • Table 41: Eastern Europe Market Value (USD Billion) Forecast by Country, 2020-2035
  • Table 42: Eastern Europe Market Volume (Units) Forecast by Country, 2020-2035
  • Table 43: Eastern Europe Market Value (USD Billion) Forecast By Product, 2020-2035
  • Table 44: Eastern Europe Market Volume (Units) Forecast By Product, 2020-2035
  • Table 45: Eastern Europe Market Value (USD Billion) Forecast By Capacity, 2020-2035
  • Table 46: Eastern Europe Market Volume (Units) Forecast By Capacity, 2020-2035
  • Table 47: Eastern Europe Market Value (USD Billion) Forecast By Automation, 2020-2035
  • Table 48: Eastern Europe Market Volume (Units) Forecast By Automation, 2020-2035
  • Table 49: Eastern Europe Market Value (USD Billion) Forecast By End User, 2020-2035
  • Table 50: Eastern Europe Market Volume (Units) Forecast By End User, 2020-2035
  • Table 51: East Asia Market Value (USD Billion) Forecast by Country, 2020-2035
  • Table 52: East Asia Market Volume (Units) Forecast by Country, 2020-2035
  • Table 53: East Asia Market Value (USD Billion) Forecast By Product, 2020-2035
  • Table 54: East Asia Market Volume (Units) Forecast By Product, 2020-2035
  • Table 55: East Asia Market Value (USD Billion) Forecast By Capacity, 2020-2035
  • Table 56: East Asia Market Volume (Units) Forecast By Capacity, 2020-2035
  • Table 57: East Asia Market Value (USD Billion) Forecast By Automation, 2020-2035
  • Table 58: East Asia Market Volume (Units) Forecast By Automation, 2020-2035
  • Table 59: East Asia Market Value (USD Billion) Forecast By End User, 2020-2035
  • Table 60: East Asia Market Volume (Units) Forecast By End User, 2020-2035
  • Table 61: South Asia & Pacific Market Value (USD Billion) Forecast by Country, 2020-2035
  • Table 62: South Asia & Pacific Market Volume (Units) Forecast by Country, 2020-2035
  • Table 63: South Asia & Pacific Market Value (USD Billion) Forecast By Product, 2020-2035
  • Table 64: South Asia & Pacific Market Volume (Units) Forecast By Product, 2020-2035
  • Table 65: South Asia & Pacific Market Value (USD Billion) Forecast By Capacity, 2020-2035
  • Table 66: South Asia & Pacific Market Volume (Units) Forecast By Capacity, 2020-2035
  • Table 67: South Asia & Pacific Market Value (USD Billion) Forecast By Automation, 2020-2035
  • Table 68: South Asia & Pacific Market Volume (Units) Forecast By Automation, 2020-2035
  • Table 69: South Asia & Pacific Market Value (USD Billion) Forecast By End User, 2020-2035
  • Table 70: South Asia & Pacific Market Volume (Units) Forecast By End User, 2020-2035
  • Table 71: Middle East and Africa Market Value (USD Billion) Forecast by Country, 2020-2035
  • Table 72: Middle East and Africa Market Volume (Units) Forecast by Country, 2020-2035
  • Table 73: Middle East and Africa Market Value (USD Billion) Forecast By Product, 2020-2035
  • Table 74: Middle East and Africa Market Volume (Units) Forecast By Product, 2020-2035
  • Table 75: Middle East and Africa Market Value (USD Billion) Forecast By Capacity, 2020-2035
  • Table 76: Middle East and Africa Market Volume (Units) Forecast By Capacity, 2020-2035
  • Table 77: Middle East and Africa Market Value (USD Billion) Forecast By Automation, 2020-2035
  • Table 78: Middle East and Africa Market Volume (Units) Forecast By Automation, 2020-2035
  • Table 79: Middle East and Africa Market Value (USD Billion) Forecast By End User, 2020-2035
  • Table 80: Middle East and Africa Market Volume (Units) Forecast By End User, 2020-2035

List of Figures

  • Figure 1: Global Market Volume (Units) Forecast 2020-2035
  • Figure 2: Global Market Pricing Analysis
  • Figure 3: Global Market Value (USD Billion) Forecast 2020-2035
  • Figure 4: Global Market Value Share and BPS Analysis by By Product, 2025 and 2035
  • Figure 5: Global Market Y-o-Y Growth Comparison by By Product, 2025-2035
  • Figure 6: Global Market Attractiveness Analysis by By Product
  • Figure 7: Global Market Value Share and BPS Analysis by By Capacity, 2025 and 2035
  • Figure 8: Global Market Y-o-Y Growth Comparison by By Capacity, 2025-2035
  • Figure 9: Global Market Attractiveness Analysis by By Capacity
  • Figure 10: Global Market Value Share and BPS Analysis by By Automation, 2025 and 2035
  • Figure 11: Global Market Y-o-Y Growth Comparison by By Automation, 2025-2035
  • Figure 12: Global Market Attractiveness Analysis by By Automation
  • Figure 13: Global Market Value Share and BPS Analysis by By End User, 2025 and 2035
  • Figure 14: Global Market Y-o-Y Growth Comparison by By End User, 2025-2035
  • Figure 15: Global Market Attractiveness Analysis by By End User
  • Figure 16: Global Market Value (USD Billion) Share and BPS Analysis by Region, 2025 and 2035
  • Figure 17: Global Market Y-o-Y Growth Comparison by Region, 2025-2035
  • Figure 18: Global Market Attractiveness Analysis by Region
  • Figure 19: North America Market Incremental $ Opportunity, 2025-2035
  • Figure 20: Latin America Market Incremental $ Opportunity, 2025-2035
  • Figure 21: Western Europe Market Incremental $ Opportunity, 2025-2035
  • Figure 22: Eastern Europe Market Incremental $ Opportunity, 2025-2035
  • Figure 23: East Asia Market Incremental $ Opportunity, 2025-2035
  • Figure 24: South Asia & Pacific Market Incremental $ Opportunity, 2025-2035
  • Figure 25: Middle East and Africa Market Incremental $ Opportunity, 2025-2035
  • Figure 26: North America Market Value Share and BPS Analysis by Country, 2025 and 2035
  • Figure 27: North America Market Value Share and BPS Analysis by By Product, 2025 and 2035
  • Figure 28: North America Market Y-o-Y Growth Comparison by By Product, 2025-2035
  • Figure 29: North America Market Attractiveness Analysis by By Product
  • Figure 30: North America Market Value Share and BPS Analysis by By Capacity, 2025 and 2035
  • Figure 31: North America Market Y-o-Y Growth Comparison by By Capacity, 2025-2035
  • Figure 32: North America Market Attractiveness Analysis by By Capacity
  • Figure 33: North America Market Value Share and BPS Analysis by By Automation, 2025 and 2035
  • Figure 34: North America Market Y-o-Y Growth Comparison by By Automation, 2025-2035
  • Figure 35: North America Market Attractiveness Analysis by By Automation
  • Figure 36: North America Market Value Share and BPS Analysis by By End User, 2025 and 2035
  • Figure 37: North America Market Y-o-Y Growth Comparison by By End User, 2025-2035
  • Figure 38: North America Market Attractiveness Analysis by By End User
  • Figure 39: Latin America Market Value Share and BPS Analysis by Country, 2025 and 2035
  • Figure 40: Latin America Market Value Share and BPS Analysis by By Product, 2025 and 2035
  • Figure 41: Latin America Market Y-o-Y Growth Comparison by By Product, 2025-2035
  • Figure 42: Latin America Market Attractiveness Analysis by By Product
  • Figure 43: Latin America Market Value Share and BPS Analysis by By Capacity, 2025 and 2035
  • Figure 44: Latin America Market Y-o-Y Growth Comparison by By Capacity, 2025-2035
  • Figure 45: Latin America Market Attractiveness Analysis by By Capacity
  • Figure 46: Latin America Market Value Share and BPS Analysis by By Automation, 2025 and 2035
  • Figure 47: Latin America Market Y-o-Y Growth Comparison by By Automation, 2025-2035
  • Figure 48: Latin America Market Attractiveness Analysis by By Automation
  • Figure 49: Latin America Market Value Share and BPS Analysis by By End User, 2025 and 2035
  • Figure 50: Latin America Market Y-o-Y Growth Comparison by By End User, 2025-2035
  • Figure 51: Latin America Market Attractiveness Analysis by By End User
  • Figure 52: Western Europe Market Value Share and BPS Analysis by Country, 2025 and 2035
  • Figure 53: Western Europe Market Value Share and BPS Analysis by By Product, 2025 and 2035
  • Figure 54: Western Europe Market Y-o-Y Growth Comparison by By Product, 2025-2035
  • Figure 55: Western Europe Market Attractiveness Analysis by By Product
  • Figure 56: Western Europe Market Value Share and BPS Analysis by By Capacity, 2025 and 2035
  • Figure 57: Western Europe Market Y-o-Y Growth Comparison by By Capacity, 2025-2035
  • Figure 58: Western Europe Market Attractiveness Analysis by By Capacity
  • Figure 59: Western Europe Market Value Share and BPS Analysis by By Automation, 2025 and 2035
  • Figure 60: Western Europe Market Y-o-Y Growth Comparison by By Automation, 2025-2035
  • Figure 61: Western Europe Market Attractiveness Analysis by By Automation
  • Figure 62: Western Europe Market Value Share and BPS Analysis by By End User, 2025 and 2035
  • Figure 63: Western Europe Market Y-o-Y Growth Comparison by By End User, 2025-2035
  • Figure 64: Western Europe Market Attractiveness Analysis by By End User
  • Figure 65: Eastern Europe Market Value Share and BPS Analysis by Country, 2025 and 2035
  • Figure 66: Eastern Europe Market Value Share and BPS Analysis by By Product, 2025 and 2035
  • Figure 67: Eastern Europe Market Y-o-Y Growth Comparison by By Product, 2025-2035
  • Figure 68: Eastern Europe Market Attractiveness Analysis by By Product
  • Figure 69: Eastern Europe Market Value Share and BPS Analysis by By Capacity, 2025 and 2035
  • Figure 70: Eastern Europe Market Y-o-Y Growth Comparison by By Capacity, 2025-2035
  • Figure 71: Eastern Europe Market Attractiveness Analysis by By Capacity
  • Figure 72: Eastern Europe Market Value Share and BPS Analysis by By Automation, 2025 and 2035
  • Figure 73: Eastern Europe Market Y-o-Y Growth Comparison by By Automation, 2025-2035
  • Figure 74: Eastern Europe Market Attractiveness Analysis by By Automation
  • Figure 75: Eastern Europe Market Value Share and BPS Analysis by By End User, 2025 and 2035
  • Figure 76: Eastern Europe Market Y-o-Y Growth Comparison by By End User, 2025-2035
  • Figure 77: Eastern Europe Market Attractiveness Analysis by By End User
  • Figure 78: East Asia Market Value Share and BPS Analysis by Country, 2025 and 2035
  • Figure 79: East Asia Market Value Share and BPS Analysis by By Product, 2025 and 2035
  • Figure 80: East Asia Market Y-o-Y Growth Comparison by By Product, 2025-2035
  • Figure 81: East Asia Market Attractiveness Analysis by By Product
  • Figure 82: East Asia Market Value Share and BPS Analysis by By Capacity, 2025 and 2035
  • Figure 83: East Asia Market Y-o-Y Growth Comparison by By Capacity, 2025-2035
  • Figure 84: East Asia Market Attractiveness Analysis by By Capacity
  • Figure 85: East Asia Market Value Share and BPS Analysis by By Automation, 2025 and 2035
  • Figure 86: East Asia Market Y-o-Y Growth Comparison by By Automation, 2025-2035
  • Figure 87: East Asia Market Attractiveness Analysis by By Automation
  • Figure 88: East Asia Market Value Share and BPS Analysis by By End User, 2025 and 2035
  • Figure 89: East Asia Market Y-o-Y Growth Comparison by By End User, 2025-2035
  • Figure 90: East Asia Market Attractiveness Analysis by By End User
  • Figure 91: South Asia & Pacific Market Value Share and BPS Analysis by Country, 2025 and 2035
  • Figure 92: South Asia & Pacific Market Value Share and BPS Analysis by By Product, 2025 and 2035
  • Figure 93: South Asia & Pacific Market Y-o-Y Growth Comparison by By Product, 2025-2035
  • Figure 94: South Asia & Pacific Market Attractiveness Analysis by By Product
  • Figure 95: South Asia & Pacific Market Value Share and BPS Analysis by By Capacity, 2025 and 2035
  • Figure 96: South Asia & Pacific Market Y-o-Y Growth Comparison by By Capacity, 2025-2035
  • Figure 97: South Asia & Pacific Market Attractiveness Analysis by By Capacity
  • Figure 98: South Asia & Pacific Market Value Share and BPS Analysis by By Automation, 2025 and 2035
  • Figure 99: South Asia & Pacific Market Y-o-Y Growth Comparison by By Automation, 2025-2035
  • Figure 100: South Asia & Pacific Market Attractiveness Analysis by By Automation
  • Figure 101: South Asia & Pacific Market Value Share and BPS Analysis by By End User, 2025 and 2035
  • Figure 102: South Asia & Pacific Market Y-o-Y Growth Comparison by By End User, 2025-2035
  • Figure 103: South Asia & Pacific Market Attractiveness Analysis by By End User
  • Figure 104: Middle East and Africa Market Value Share and BPS Analysis by Country, 2025 and 2035
  • Figure 105: Middle East and Africa Market Value Share and BPS Analysis by By Product, 2025 and 2035
  • Figure 106: Middle East and Africa Market Y-o-Y Growth Comparison by By Product, 2025-2035
  • Figure 107: Middle East and Africa Market Attractiveness Analysis by By Product
  • Figure 108: Middle East and Africa Market Value Share and BPS Analysis by By Capacity, 2025 and 2035
  • Figure 109: Middle East and Africa Market Y-o-Y Growth Comparison by By Capacity, 2025-2035
  • Figure 110: Middle East and Africa Market Attractiveness Analysis by By Capacity
  • Figure 111: Middle East and Africa Market Value Share and BPS Analysis by By Automation, 2025 and 2035
  • Figure 112: Middle East and Africa Market Y-o-Y Growth Comparison by By Automation, 2025-2035
  • Figure 113: Middle East and Africa Market Attractiveness Analysis by By Automation
  • Figure 114: Middle East and Africa Market Value Share and BPS Analysis by By End User, 2025 and 2035
  • Figure 115: Middle East and Africa Market Y-o-Y Growth Comparison by By End User, 2025-2035
  • Figure 116: Middle East and Africa Market Attractiveness Analysis by By End User
  • Figure 117: Global Market - Tier Structure Analysis
  • Figure 118: Global Market - Company Share Analysis

Frequently Asked Questions

What is the market size of the automated centrifuge system market in 2025?

The market is estimated to be worth USD 1.3 billion in 2025.

What is the projected size of the automated centrifuge system market by 2035?

The market is forecasted to reach USD 2.3 billion by 2035.

What is the CAGR of the automated centrifuge system market from 2025 to 2035?

The market is set to expand at a CAGR of 5.7% over the forecast period.

Which product segment leads the automated centrifuge system market?

Floor-standing automated centrifuges hold the largest share at 41.5% in 2025.

Which country is the fastest growing in the automated centrifuge system market?

Japan is the top-growing country, projected to grow at a CAGR of 8.6% from 2025 to 2035.

Explore Similar Insights

Future Market Insights

Automated Centrifuge System Market