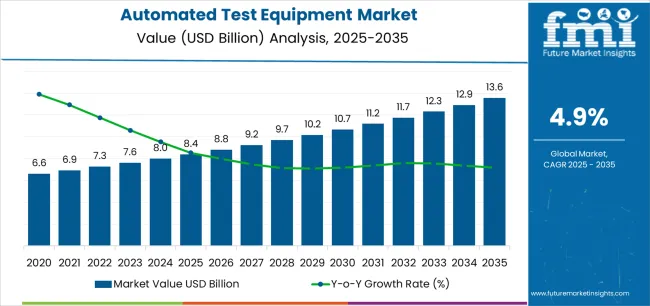
The automated test equipment market stands at the threshold of a decade-long expansion trajectory that promises to reshape electronics testing technology and quality assurance solutions. The market's journey from USD 8.4 billion in 2025 to USD 13.6 billion by 2035 represents substantial growth, demonstrating the accelerating adoption of advanced testing technology and production quality optimization across semiconductor manufacturing, electronics assembly, and telecommunications sectors.
The first half of the decade (2025-2030) will witness the market climbing from USD 8.4 billion to approximately USD 10.7 billion, adding USD 2.3 billion in value, which constitutes 44% of the total forecast growth period. This phase will be characterized by the rapid adoption of semiconductor test systems, driven by increasing chip complexity and the growing need for advanced validation solutions worldwide. Enhanced automation capabilities and AI-powered defect detection will become standard expectations rather than premium options.
The latter half (2030-2035) will witness continued growth from USD 10.7 billion to USD 13.6 billion, representing an addition of USD 2.9 billion or 56% of the decade's expansion. This period will be defined by mass market penetration of intelligent test technologies, integration with comprehensive manufacturing execution platforms, and seamless compatibility with existing production infrastructure. The market trajectory signals fundamental shifts in how electronics manufacturers approach quality control and production validation, with participants positioned to benefit from growing demand across multiple equipment types and industry segments.
Supply chain vulnerabilities affect automated test equipment more severely than standard manufacturing tools due to specialized components and proprietary software licensing requirements. Lead times for high-performance test systems often exceed six months, forcing procurement teams to maintain expensive inventory buffers while managing obsolescence risks for rapidly evolving semiconductor technologies. Maintenance contracts typically represent 15-20% of initial equipment costs annually, creating budget pressures that conflict with operational reliability requirements.
Operator training represents a persistent challenge as automated test equipment becomes increasingly sophisticated. Experienced technicians familiar with manual testing procedures often resist automated systems that obscure traditional diagnostic techniques, while newer employees lack foundational knowledge to troubleshoot automated failures effectively. Facilities struggle to maintain expertise across multiple equipment generations as vendors discontinue support for older platforms while introducing incompatible newer systems.
Integration with existing manufacturing execution systems frequently reveals software compatibility issues that automated test equipment vendors underestimate during sales processes. Data format mismatches, communication protocol conflicts, and database synchronization delays create operational disruptions that force facilities to maintain manual workarounds alongside automated solutions, negating expected efficiency gains and increasing operational complexity.
| Period | Primary Revenue Buckets | Share | Notes |
|---|---|---|---|
| Today | New equipment sales (semiconductor, PCB, system-level) | 52% | Capex-driven, technology node transitions |
| Service & calibration contracts | 24% | Preventive maintenance, software updates | |
| Upgrades & retrofits | 14% | Technology refresh, capacity expansion | |
| Consumables & test fixtures | 10% | Test sockets, probe cards, interface boards | |
| Future (3-5 yrs) | Advanced semiconductor test systems | 45-50% | 5nm and below, chiplet testing, AI chips |
| AI-powered test analytics | 18-22% | Predictive maintenance, yield optimization | |
| Service-as-a-subscription | 15-20% | Performance guarantees, utilization-based pricing | |
| 5G & RF test solutions | 10-15% | mmWave testing, antenna validation | |
| System upgrades & modernization | 8-12% | Legacy equipment enhancement, software licenses | |
| Data analytics services | 4-6% | Test data correlation, quality insights |
| Metric | Value |
|---|---|
| Market Value (2025) | USD 8.4 billion |
| Market Forecast (2035) | USD 13.6 billion |
| Growth Rate | 4.9% CAGR |
| Leading Technology | Semiconductor ATE |
| Primary Application | Semiconductor Segment |
The market demonstrates strong fundamentals with semiconductor ATE systems capturing a dominant share through advanced testing capabilities and chip validation optimization. Semiconductor applications drive primary demand, supported by increasing chip complexity and production volume requirements. Geographic expansion remains concentrated in developed markets with established electronics manufacturing infrastructure, while emerging economies show accelerating adoption rates driven by semiconductor fabrication initiatives and rising quality standards.
Primary Classification: The market segments by type into semiconductor ATE, PCB test equipment, system-level test equipment, and RF & wireless ATE, representing the evolution from basic testing equipment to sophisticated validation solutions for comprehensive electronics quality optimization.
Secondary Classification: Application segmentation divides the market into semiconductor, telecommunications, industrial automation, and telecommunications sectors, reflecting distinct requirements for test complexity, throughput, and accuracy standards.
Tertiary Classification: End-use segmentation covers consumer electronics, automotive, aerospace & defense, industrial automation, and telecommunications, while regional distribution spans North America, Latin America, Western Europe, Eastern Europe, East Asia, South Asia Pacific, and Middle East & Africa.
The segmentation structure reveals technology progression from standard testing equipment toward sophisticated automated systems with enhanced intelligence and connectivity capabilities, while application diversity spans from high-volume semiconductor manufacturing to precision aerospace electronics testing operations requiring specialized validation solutions.
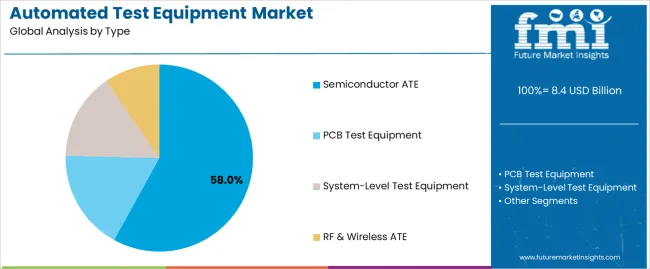
Market Position: Semiconductor ATE systems command the leading position in the automated test equipment market with 58% market share through advanced testing features, including high-speed digital testing, mixed-signal validation, and comprehensive chip characterization that enable semiconductor manufacturers to achieve optimal quality assurance across diverse foundry and fabless environments.
Value Drivers: The segment benefits from semiconductor manufacturer preference for proven test platforms that provide consistent validation performance, reduced test time, and quality optimization without requiring significant process modifications. Advanced design features enable multi-site parallel testing, high-frequency measurement, and integration with existing fab equipment, where throughput and accuracy represent critical production requirements.
Competitive Advantages: Semiconductor ATE systems differentiate through proven reliability, consistent measurement characteristics, and integration with automated wafer handling systems that enhance production effectiveness while maintaining optimal yield standards suitable for diverse logic, memory, and analog semiconductor applications.
Key market characteristics:
PCB Test Equipment maintains a 24% market position in the automated test equipment market due to widespread electronics assembly requirements and quality assurance advantages. These systems appeal to electronics manufacturers requiring comprehensive board-level validation with cost-effective testing for diverse product applications. Market growth is driven by electronics production expansion, emphasizing reliable testing solutions and defect detection through automated inspection designs.
System-Level Test Equipment captures 12% market share through complete product validation requirements in final assembly operations, functional testing, and finished goods quality assurance applications. These facilities demand comprehensive test coverage capable of validating complete system functionality while providing effective diagnostics capabilities and operational verification.
RF & Wireless ATE accounts for 6% market share through specialized testing requirements in wireless device production, telecommunications equipment manufacturing, and 5G technology validation requiring high-frequency measurement capabilities for communication optimization and standard compliance.
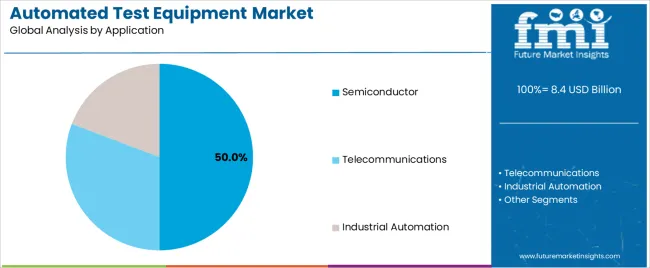
Market Context: Semiconductor applications exhibit the highest growth rate in the automated test equipment market, commanding a 50% share. This is driven by the widespread adoption of advanced chip architectures and a growing focus on validation complexity, production yield optimization, and quality assurance to maximize chip reliability while maintaining production efficiency.
Appeal Factors: Semiconductor manufacturers prioritize test accuracy, throughput capability, and integration with existing fab infrastructure that enables coordinated validation operations across multiple production stages. The segment benefits from substantial capital investment and technology node transitions that emphasize the acquisition of advanced ATE for chip validation and yield improvement applications.
Growth Drivers: Advanced node manufacturing programs incorporate next-generation ATE as essential equipment for chip validation operations, while AI chip production increases demand for complex test capabilities that comply with performance standards and minimize validation complexity.
Market Challenges: Varying chip architectures and test coverage requirements may limit equipment standardization across different semiconductor types or technology nodes.
Application dynamics include:
Telecommunications applications capture 22% market share through network equipment validation requirements in 5G infrastructure, optical communication systems, and wireless device production. These facilities demand high-frequency test systems capable of validating RF performance while providing protocol compliance and signal quality verification capabilities.
Industrial Automation applications account for 18% market share, including motor drives, controllers, and industrial electronics requiring functional validation and reliability testing for operational performance optimization and quality assurance.
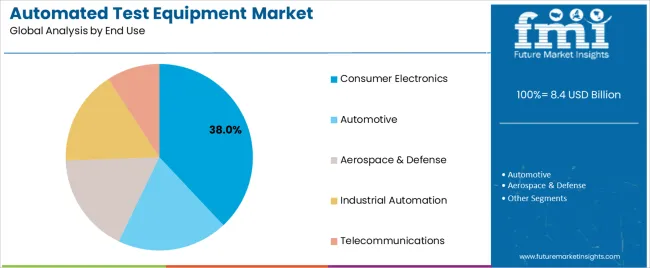
Market Position: Consumer Electronics command significant market presence with 38% share through high-volume production requirements that demand efficient automated testing for smartphones, tablets, wearables, and home electronics.
Value Drivers: This end-use category prioritizes cost-effective testing, rapid throughput, and comprehensive coverage that meets requirements for mass production while maintaining quality standards without excessive test times.
Growth Characteristics: The segment benefits from continuous product innovation, short product lifecycles, and global consumer demand that support sustained test equipment investment and validation technology advancement.
Automotive end-use captures 28% market share through safety-critical electronics validation in ADAS systems, powertrains, infotainment, and electric vehicle components requiring rigorous testing and long-term reliability assurance.
Aerospace & Defense applications account for 16% market share, including avionics, satellite systems, and defense electronics requiring highest reliability testing with comprehensive environmental validation and mission-critical performance assurance.
Industrial Automation maintains 12% market share through industrial control systems, robotics electronics, and factory automation equipment requiring functional validation and durability testing for industrial environment applications.
Telecommunications applications capture remaining market share through base station equipment, optical transceivers, and network infrastructure requiring specialized testing for communication performance and standard compliance verification.
| Category | Factor | Impact | Why It Matters |
|---|---|---|---|
| Driver | Semiconductor complexity & advanced nodes (5nm and below, chiplet architectures, AI chips) | ★★★★★ | Smaller geometries increase defect sensitivity; complex chips require sophisticated multi-site testing with higher capital investment in advanced ATE platforms. |
| Driver | 5G deployment & wireless infrastructure expansion (mmWave testing, massive MIMO validation) | ★★★★★ | 5G network rollout drives RF test equipment demand; high-frequency testing requirements and antenna validation create new ATE market opportunities. |
| Driver | Automotive electronics & ADAS growth (safety-critical systems, autonomous driving sensors) | ★★★★☆ | Stringent automotive reliability standards mandate comprehensive testing; electric vehicle electronics and ADAS validation require specialized test capabilities. |
| Restraint | High capital investment & long payback periods (especially for advanced semiconductor ATE) | ★★★★☆ | Equipment costs exceeding millions limit adoption; small manufacturers and IDMs face budget constraints, slowing advanced ATE penetration. |
| Restraint | Test complexity & skilled operator shortage | ★★★☆☆ | Advanced equipment requires specialized expertise; shortage of qualified test engineers limits effective ATE utilization and operational efficiency. |
| Trend | AI & machine learning in test analytics (predictive maintenance, yield correlation, adaptive testing) | ★★★★★ | AI-powered analytics transform test operations; pattern recognition and predictive algorithms enable proactive quality management and cost reduction. |
| Trend | Cloud-based test data management & analytics (centralized monitoring, multi-site correlation) | ★★★★☆ | Cloud platforms enable global test data visibility; centralized analytics and benchmarking drive continuous improvement and faster issue resolution. |
The automated test equipment market demonstrates varied regional dynamics with Growth Leaders including China (6.6% growth rate) and India (6.1% growth rate) driving expansion through semiconductor manufacturing initiatives and electronics production development. Steady Performers encompass Germany (5.6% growth rate), United States (4.7% growth rate), and developed regions, benefiting from established semiconductor industries and advanced electronics manufacturing. Emerging Markets feature developing regions where technology fabrication initiatives and quality modernization support consistent growth patterns.
Regional synthesis reveals East Asian markets leading adoption through semiconductor capacity expansion and electronics manufacturing development, while European countries maintain strong expansion supported by automotive electronics advancement and industrial automation requirements. North American markets show moderate growth driven by semiconductor innovation and defense electronics applications.
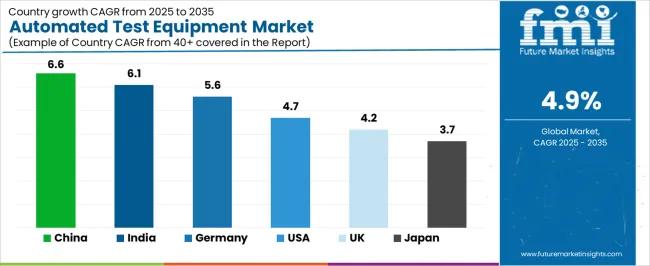
| Region/Country | 2025-2035 Growth | How to win | What to watch out |
|---|---|---|---|
| China | 6.6% | Focus on semiconductor test solutions; competitive pricing | Technology export restrictions; local competition |
| India | 6.1% | Lead with cost-effective systems; technical training | Infrastructure limitations; skilled labor gaps |
| Germany | 5.6% | Emphasize automotive electronics testing; precision systems | Over-engineering; complex qualification processes |
| United States | 4.7% | Push advanced semiconductor ATE; AI integration | Geopolitical tensions; supply chain complexities |
| UK | 4.2% | Offer aerospace & defense solutions; service excellence | Brexit impacts; manufacturing uncertainty |
| Japan | 3.7% | Premium quality; miniaturization testing capabilities | Conservative adoption; aging demographics |
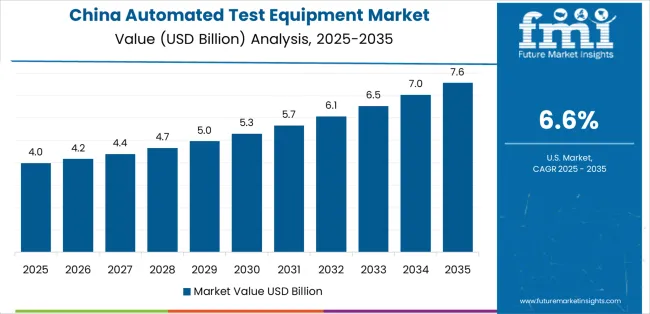
China establishes fastest market growth through aggressive semiconductor manufacturing programs and comprehensive electronics production development, integrating advanced automated test equipment as standard components in fab installations and assembly operations. The country's 6.6% growth rate reflects government initiatives promoting semiconductor self-sufficiency and Made in China 2025 programs that mandate the use of advanced testing systems in semiconductor and electronics facilities. Growth concentrates in major manufacturing hubs, including Shanghai, Shenzhen, and Xi'an, where semiconductor fab development showcases integrated ATE systems that appeal to manufacturers seeking advanced validation capabilities and production optimization applications.
Chinese electronics manufacturers are adopting ATE solutions that combine imported technology with domestic integration capabilities, including customized test programs and localized technical support. Distribution channels through equipment agents and technology trading companies expand market access, while government semiconductor investment programs support adoption across diverse foundry and assembly segments.
Strategic Market Indicators:
In Bangalore, Hyderabad, and Chennai, electronics manufacturing facilities and semiconductor assembly operations are implementing automated test equipment as standard infrastructure for quality assurance and production validation applications, driven by increasing electronics manufacturing investment and government semiconductor programs that emphasize the importance of testing capabilities. The market holds a 6.1% growth rate, supported by government Make in India initiatives and electronics production incentive schemes that promote ATE deployment for electronics and semiconductor facilities. Indian manufacturers are adopting test equipment that provides cost-effective validation and operational reliability, particularly appealing in electronics clusters where quality standards and production efficiency represent critical competitive requirements.
Market expansion benefits from growing electronics contract manufacturing and semiconductor assembly infrastructure that enable widespread deployment of testing solutions for production and quality applications. Technology adoption follows patterns established in manufacturing automation, where ROI and quality improvement drive equipment procurement and facility deployment.
Market Intelligence Brief:
Germany establishes market leadership through comprehensive automotive electronics programs and advanced industrial manufacturing infrastructure development, integrating automated test equipment across automotive and industrial electronics applications. The country's 5.6% growth rate reflects established electronics industry relationships and mature quality assurance adoption that supports widespread use of advanced testing systems in automotive and industrial facilities. Growth concentrates in major industrial regions, including Baden-Württemberg, Bavaria, and Saxony, where automotive technology advancement showcases mature ATE deployment that appeals to manufacturers seeking proven validation capabilities and automotive quality applications.
German equipment providers leverage established distribution networks and comprehensive application engineering capabilities, including automotive qualification programs and technical training services that create customer relationships and operational advantages. The market benefits from mature automotive standards and aerospace requirements that mandate testing equipment use while supporting technology advancement and quality optimization.
Market Intelligence Brief:
United States demonstrates strong automated test equipment adoption with 4.7% growth rate, driven by semiconductor innovation leadership and defense electronics requirements. Major semiconductor centers including Silicon Valley, Austin, and Arizona showcase advanced fab facilities where next-generation ATE validates cutting-edge chip designs and emerging architectures to ensure product quality and performance verification. The market benefits from leading semiconductor companies, substantial R&D investment, and defense industry requirements for high-reliability electronics testing. American manufacturers prioritize test accuracy, software flexibility, and technical support for advanced validation challenges.
Distribution patterns favor direct relationships with equipment manufacturers, while technical partnerships serve semiconductor companies through co-development programs and custom test solutions. Market growth concentrates in advanced logic and AI chip segments where validation complexity justifies premium ATE investments.
Market Intelligence Brief:
United Kingdom's electronics market demonstrates moderate automated test equipment adoption with 4.2% growth rate, supported by aerospace manufacturing excellence and defense electronics concentration. Major technology areas including Southeast England, Midlands, and Scotland showcase specialized electronics facilities where ATE provides critical validation for aerospace systems and defense equipment production. The market benefits from established aerospace supply chains, Formula 1 electronics innovation, and defense industry requirements for mission-critical electronics testing.
British manufacturers prioritize test reliability, technical support, and proven performance in demanding aerospace applications. Distribution channels through specialized equipment suppliers and technical representatives expand market access for both aerospace suppliers and defense contractors.
Strategic Market Considerations:
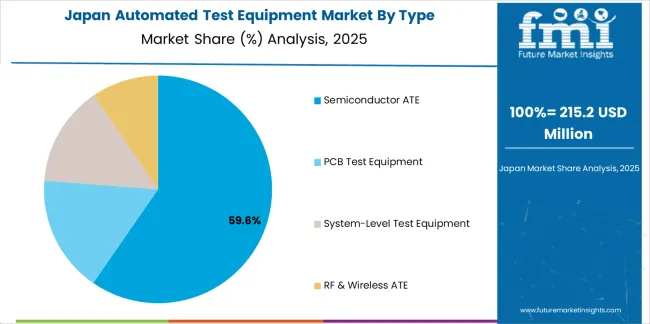
Japan's market expansion benefits from diverse electronics demand, including consumer electronics in Tokyo and Osaka, automotive electronics manufacturing, and industrial automation programs that increasingly incorporate ATE solutions for quality assurance applications. The country maintains a 3.7% growth rate, driven by quality consciousness and recognition of validation benefits, including defect detection and production optimization.
Market dynamics focus on precision test equipment that balances advanced measurement performance with compact designs important to Japanese manufacturing standards. Growing automotive electronics content creates continued demand for specialized test systems in production infrastructure and electronics manufacturing projects.
Strategic Market Considerations:
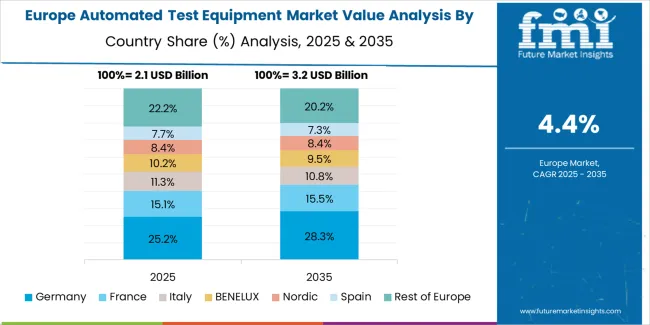
The automated test equipment market in Europe is projected to grow from USD 3.1 billion in 2025 to USD 5.2 billion by 2035, registering a CAGR of 5.2% over the forecast period. Germany is expected to maintain its leadership position with a 39.6% market share in 2025, supported by its advanced automotive electronics infrastructure and major semiconductor facilities in Dresden, Munich, and Stuttgart regions.
United Kingdom follows with a 19.8% share in 2025, driven by comprehensive aerospace electronics programs and defense systems validation requirements. France holds a 17.4% share through specialized telecommunications applications and automotive electronics production. Italy commands a 12.7% share, while Spain accounts for 10.5% in 2025. The rest of Europe region is anticipated to gain momentum, expanding its collective share from 6.4% to 7.8% by 2035, attributed to increasing ATE adoption in Nordic countries and emerging Eastern European semiconductor assembly facilities implementing quality assurance programs.
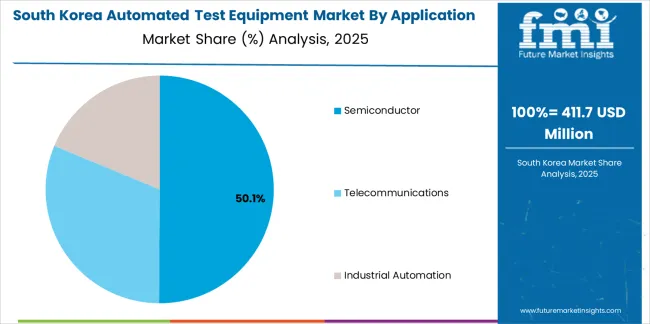
South Korea demonstrates advanced automated test equipment adoption with 5.4% growth rate, driven by semiconductor manufacturing dominance and memory chip production leadership. Major semiconductor centers including Hwaseong, Pyeongtaek, and Cheongju showcase world-class fab facilities where high-volume ATE systems validate memory chips and advanced logic devices to optimize production yield and quality performance. The market benefits from leading memory manufacturers, substantial fab investments, and advanced packaging technology development requiring sophisticated testing capabilities.
Korean semiconductor manufacturers prioritize test throughput, measurement accuracy, and integration with automated fab systems. Market growth reflects both memory chip production expansion and emerging logic foundry investments requiring advanced validation infrastructure. Distribution channels through equipment agents and semiconductor equipment suppliers serve major manufacturers, while growing display electronics and automotive electronics sectors create adjacent ATE demand. Technology partnerships between Korean semiconductor companies and global ATE manufacturers drive customized test solutions optimized for high-volume production requirements and advanced packaging validation including chiplet and 3D integration testing needs.
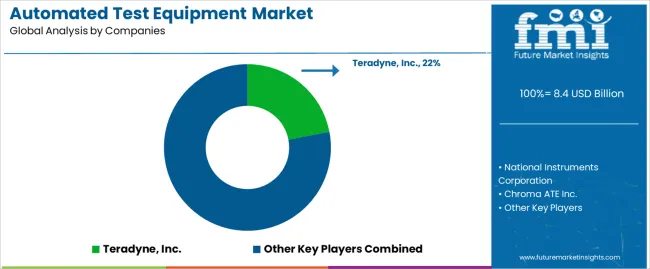
The Automated Test Equipment (ATE) Market is expanding as semiconductor manufacturers, electronics OEMs, and system integrators require faster, more accurate testing to support complex chip architectures and high-volume production. Growth in automotive electronics, 5G communication hardware, data center processors, and consumer devices is increasing demand for test platforms that can validate functionality, reliability, and signal integrity at scale. As chip geometries shrink and packaging becomes more advanced, ATE systems are incorporating higher parallelism, improved measurement sensitivity, and software-driven test automation.
Teradyne, Inc. and Advantest Corporation remain at the forefront, supplying semiconductor test platforms used in wafer, package, and final device testing for advanced logic and memory fabrication. Cohu, Inc. and Chroma ATE Inc. offer cost-efficient handlers, testers, and system-level testing solutions suited for mid-volume and diversified electronics production environments.
Keysight Technologies and NI (Emerson) focus on modular, software-configurable test systems that support RF, mixed-signal, and high-speed digital validation across R&D and manufacturing lines. Astronics Corporation and Roos Instruments, Inc. are important in aerospace, defense, and wireless communication testing, where custom configurations and rugged reliability are required. Tesec Corporation and Star Technologies, Inc. support power device and reliability testing, addressing the rising demand for wide-bandgap semiconductor qualification. As semiconductor complexity continues to increase, ATE is becoming more tightly integrated with analytics, adaptive test sequencing, and factory automation.
| Stakeholder | What they actually control | Typical strengths | Typical blind spots |
|---|---|---|---|
| Semiconductor ATE leaders | Advanced test technology, fab relationships, high-volume platforms | Latest node capability, proven throughput, technology roadmaps | System-level testing; emerging applications; cost-sensitive segments |
| Diversified test equipment makers | Broad product portfolios, multiple segments, modular platforms | Application flexibility, cross-segment solutions, software integration | Leading-edge semiconductor; specialized RF; highest throughput |
| RF & wireless specialists | 5G test expertise, mmWave capability, protocol coverage | Latest wireless standards, antenna testing, communication validation | Semiconductor scale; automotive qualification; mass production |
| Automotive test innovators | Safety qualification, reliability testing, automotive standards | ADAS validation, powertrain testing, automotive relationships | Semiconductor complexity; cost optimization; non-automotive segments |
| Service & software providers | Data analytics platforms, predictive maintenance, test optimization | Software differentiation, cloud platforms, AI algorithms | Hardware manufacturing; equipment scale; semiconductor partnerships |
Market competition intensifies around AI-powered analytics integration, advanced semiconductor node support, and comprehensive test data management. Companies investing in machine learning-enabled test optimization, cloud-based analytics platforms, and 5G validation capabilities position themselves advantageously for sustained market share gains. Success increasingly depends on balancing hardware technology innovation with software platform development and service excellence that drive total cost of ownership advantages across diverse electronics manufacturing segments.
| Item | Value |
|---|---|
| Quantitative Units | USD 8.4 billion |
| Type | Semiconductor ATE, PCB Test Equipment, System-Level Test Equipment, RF & Wireless ATE |
| Application | Semiconductor, Telecommunications, Industrial Automation, Telecommunications |
| End Use | Consumer Electronics, Automotive, Aerospace & Defense, Industrial Automation, Telecommunications |
| Regions Covered | North America, Latin America, Western Europe, Eastern Europe, East Asia, South Asia Pacific, Middle East & Africa |
| Countries Covered | China, India, Germany, United States, United Kingdom, Japan, South Korea, France, Taiwan, Singapore, and 25+ additional countries |
| Key Companies Profiled | Teradyne, Inc., Advantest Corporation, Cohu, Inc., Chroma ATE Inc., Keysight Technologies, NI (Emerson), Astronics Corporation, Roos Instruments, Inc., Tesec Corporation, and Star Technologies, Inc. |
| Additional Attributes | Dollar sales by equipment type and application categories, regional adoption trends across East Asia, North America, and Western Europe, competitive landscape with semiconductor test equipment manufacturers and electronics validation suppliers, manufacturer preferences for test accuracy control and system throughput, integration with fab automation platforms and MES systems, innovations in test technology and AI-powered analytics, and development of automated validation solutions with enhanced performance and semiconductor quality optimization capabilities. |
The global automated test equipment market is estimated to be valued at USD 8.4 billion in 2025.
The market size for the automated test equipment market is projected to reach USD 13.6 billion by 2035.
The automated test equipment market is expected to grow at a 4.9% CAGR between 2025 and 2035.
The key product types in automated test equipment market are semiconductor ate , pcb test equipment, system-level test equipment and rf & wireless ate.
In terms of application, semiconductor segment to command 50.0% share in the automated test equipment market in 2025.


Our Research Products

The "Full Research Suite" delivers actionable market intel, deep dives on markets or technologies, so clients act faster, cut risk, and unlock growth.

The Leaderboard benchmarks and ranks top vendors, classifying them as Established Leaders, Leading Challengers, or Disruptors & Challengers.

Locates where complements amplify value and substitutes erode it, forecasting net impact by horizon

We deliver granular, decision-grade intel: market sizing, 5-year forecasts, pricing, adoption, usage, revenue, and operational KPIs—plus competitor tracking, regulation, and value chains—across 60 countries broadly.

Spot the shifts before they hit your P&L. We track inflection points, adoption curves, pricing moves, and ecosystem plays to show where demand is heading, why it is changing, and what to do next across high-growth markets and disruptive tech

Real-time reads of user behavior. We track shifting priorities, perceptions of today’s and next-gen services, and provider experience, then pace how fast tech moves from trial to adoption, blending buyer, consumer, and channel inputs with social signals (#WhySwitch, #UX).

Partner with our analyst team to build a custom report designed around your business priorities. From analysing market trends to assessing competitors or crafting bespoke datasets, we tailor insights to your needs.
Supplier Intelligence
Discovery & Profiling
Capacity & Footprint
Performance & Risk
Compliance & Governance
Commercial Readiness
Who Supplies Whom
Scorecards & Shortlists
Playbooks & Docs
Category Intelligence
Definition & Scope
Demand & Use Cases
Cost Drivers
Market Structure
Supply Chain Map
Trade & Policy
Operating Norms
Deliverables
Buyer Intelligence
Account Basics
Spend & Scope
Procurement Model
Vendor Requirements
Terms & Policies
Entry Strategy
Pain Points & Triggers
Outputs
Pricing Analysis
Benchmarks
Trends
Should-Cost
Indexation
Landed Cost
Commercial Terms
Deliverables
Brand Analysis
Positioning & Value Prop
Share & Presence
Customer Evidence
Go-to-Market
Digital & Reputation
Compliance & Trust
KPIs & Gaps
Outputs
Full Research Suite comprises of:
Market outlook & trends analysis
Interviews & case studies
Strategic recommendations
Vendor profiles & capabilities analysis
5-year forecasts
8 regions and 60+ country-level data splits
Market segment data splits
12 months of continuous data updates
DELIVERED AS:
PDF EXCEL ONLINE
Automated Radionuclide Dispenser Market Size and Share Forecast Outlook 2025 to 2035
Automated Tool Grinding Systems Market Size and Share Forecast Outlook 2025 to 2035
Automated Machine Learning Market Forecast Outlook 2025 to 2035
Automated CPR Device Market Size and Share Forecast Outlook 2025 to 2035
Automated Compound Storage and Retrieval (ACSR) Market Size and Share Forecast Outlook 2025 to 2035
Automated People Mover Market Size and Share Forecast Outlook 2025 to 2035
Automated Colony Picking Systems Market Size and Share Forecast Outlook 2025 to 2035
Automated Truck Loading System Market Size and Share Forecast Outlook 2025 to 2035
Automated Microplate Handling Systems Market Size and Share Forecast Outlook 2025 to 2035
Automated Solid Phase Extraction Systems Market Size and Share Forecast Outlook 2025 to 2035
Automated Infrastructure Management Solution Market Size and Share Forecast Outlook 2025 to 2035
Automated Mineralogy Solution Market Size and Share Forecast Outlook 2025 to 2035
Automated Feeding Systems Market Size and Share Forecast Outlook 2025 to 2035
Automated Labeling Machines Market Size and Share Forecast Outlook 2025 to 2035
Automated Solar Panel Cleaning Market Size and Share Forecast Outlook 2025 to 2035
Automated Infrastructure Management (AIM) Solutions Market Size and Share Forecast Outlook 2025 to 2035
Automated Window Blinds Market Size and Share Forecast Outlook 2025 to 2035
Automated Cell Culture Systems Market Analysis - Size, Share & Forecast 2025-2035
Automated Cell Biology Systems Market Size and Share Forecast Outlook 2025 to 2035
Automated Fingerprint Identification System (AFIS) Market Size and Share Forecast Outlook 2025 to 2035

Thank you!
You will receive an email from our Business Development Manager. Please be sure to check your SPAM/JUNK folder too.
Chat With
MaRIA