The automated cell culture systems market is estimated to reach USD 18.1 billion in 2025. By 2035, the market is projected to grow to USD 43.2 billion, expanding at a 9.1% CAGR during the study period.Increasing demand for high-throughput and consistent cell culturing processes has fueled the adoption of automation in laboratories and bioproduction facilities.
Automation helps maintain standardized conditions while reducing manual labor and variability, which has become essential for biologics manufacturing and therapeutic research. Companies across the pharmaceutical and biotechnology sectors are increasingly turning to these systems to streamline their workflows and improve operational reliability.
The market growth can also be credited to advancements in cell therapy, regenerative medicine, and ongoing innovation in automated systems. The growing interest in stem cell therapies and personalized treatments is compelling institutions to scale up production in a controlled, reproducible manner.
As the focus on large-scale biologics and precision medicine expands, manufacturers are investing in systems that can deliver efficiency at scale without compromising product integrity or regulatory compliance.One of the primary forces behind this growth is the integration of artificial intelligence and machine learning.
These technologies allow automated systems to optimize culture conditions, detect deviations in real time, and automate key decisions such as feeding schedules and harvesting. This level of intelligence is transforming traditional cell culture into a data-driven process that can support faster, more predictable drug development timelines.
Government regulations play a crucial role in shaping the market, particularly in regions with strong biopharmaceutical sectors like the United States, Japan, and the European Union. Agencies such as the FDA and EMA require strict adherence to quality control, traceability, and Good Manufacturing Practice standards when it comes to biologics and cell-based therapies.
These regulatory frameworks mandate consistency, reproducibility, and contamination control, which automated systems are well-equipped to deliver. As the demand for cell therapies grows, regulatory bodies are also streamlining approval pathways for regenerative treatments and advanced manufacturing technologies, encouraging further investment in automation.
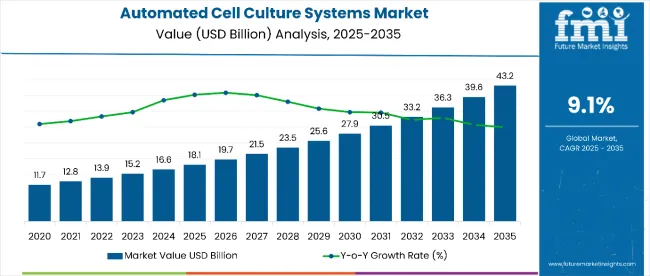
| Metric | Value |
|---|---|
| Industry Size (2025E) | USD 18.1 billion |
| Industry Value (2035F) | USD 43.2 billion |
| CAGR (2025 to 2035) | 9.1% |
AI is running the core of the automated cell culture systems market in 2025. Machines are not just moving fluids or monitoring growth. AI models now make decisions across bioreactors, storage units, and feeding cycles.
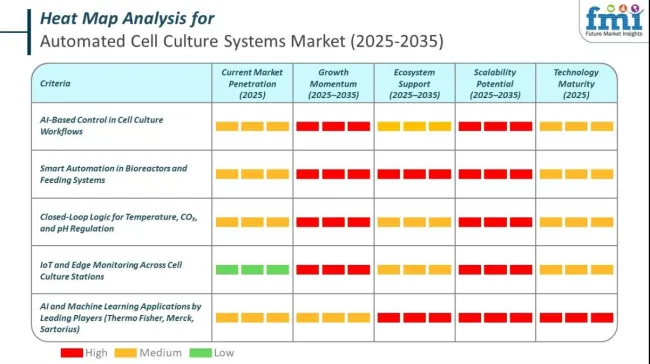
In 2025, the automated cell culture systems landscape sees the full convergence of smart automation, robotics, and IoT, transforming how cultures are monitored, maintained, and optimized. Equipment is now intelligent, interactive, and adaptive. Systems no longer wait for operator commands. They predict, decide, and act. Sensors are embedded across every workflow layer. Each device reports data across secure digital pipelines. Real-time integration of mechanical functions, cell growth metrics, and environmental parameters is a core capability.
In the automated cell culture systems market, leading companies are leveraging AI to improve cell growth monitoring, automate quality control, and predict optimal culture conditions. AI enhances the consistency and scalability of cell production, which is critical for regenerative medicine, biologics, and vaccine manufacturing. These systems integrate AI with robotics and machine vision to reduce manual errors and ensure reproducibility.
The market is segmented by product, including cell culture process automatization instruments or robots (multiple function), automated bioreactors (single or multiple function), automated cell culture media exchange systems (single function), automated culture media analyzers (single function), automated cell wash-and-concentrate systems (single function), automated cell counters (single function), automated fill and finish systems (single function), automated cell storage equipment (single function), and management software.
By cell culture type, the market is categorized into finite cell line cultures and infinite cell line cultures. Based on application, it is divided into cell therapy, drug development, stem cell research, and regenerative medicine. By end user, the market includes mega pharmaceutical companies, biopharmaceutical companies, CDMOs/CMOs, research organizations, academic institutes, and hospitals providing cell therapy or regenerative medicine.
Regionally, the market is analyzed across North America, Latin America, East Asia, South Asia, and the Pacific, Western Europe, Eastern Europe, the Middle East, and Africa.
The product landscape of the market is diverse, supporting various stages of the cell culture process. Cell culture process automatization instruments or robots are expected to register the fastest growth, with a projected CAGR of 11.2% from 2025 to 2035, which leads in growth rate, and are favored for their multifunctional capabilities.
These systems can automate several tasks like media change, cell passaging, and monitoring within one integrated unit, making them valuable for both research and commercial production environments. Their increasing adoption is fueled by the rising need for throughput, consistency, and operational efficiency in cell-based manufacturing workflows.
Automated bioreactors, available in both single and multiple function models, remain a staple in bioproduction due to their ability to maintain controlled environments for large-scale cell growth.
These systems support the cultivation of suspension and adherent cell lines under precise conditions. Automated media exchange systems, though single-function, help maintain cell viability by ensuring timely nutrient replenishment. Culture media analyzers and cell counters offer critical quality control functions. They enable researchers to monitor nutrient composition and cell density with high accuracy, which is essential for consistency across batches.
Other key segments include automated fill and finish systems, which are essential in final formulation and packaging, especially for biologics, where contamination risk must be minimized. Automated wash-and-concentrate systems improve cell recovery and viability by gently processing cell suspensions.
Cell storage equipment automates freezing and thawing processes, reducing viability loss during storage. Finally, management software integrates all hardware components into a unified digital interface. It enables real-time data tracking, ensures compliance, and provides predictive insights for process optimization. These systems are critical as regulatory oversight becomes more data-focused and outcome-oriented.
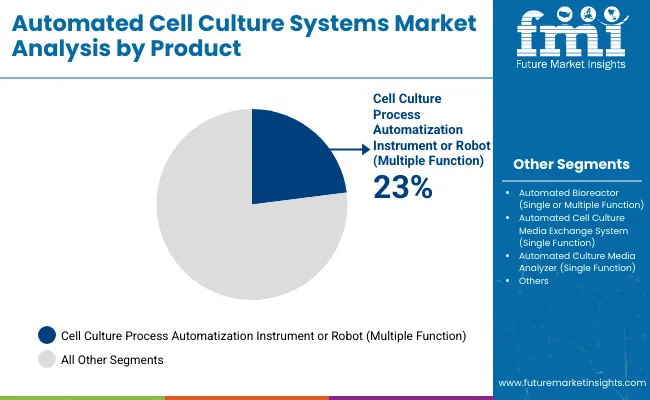
| Product | CAGR (2025-2035) |
|---|---|
| Cell Culture Process Automatization Instrument or Robot (Multiple Function) | 11.2% |
Infinite cell line cultures are projected to be the fastest-growing segment, expanding at a CAGR of 10.3% from 2025 to 2035.
This growth is largely attributed to their ability to proliferate indefinitely, making them ideal for high-throughput drug screening, biologics manufacturing, and advanced cancer research. These cell lines offer genetic stability, reproducibility, and scalability, which are essential for long-term studies and commercial production.
On the other hand, finite cell line cultures are still widely used in applications where a limited number of passages is sufficient or biologically preferable, such as primary research or certain diagnostic studies.
These cultures have a defined lifespan and better mimic normal cellular behavior, making them valuable in toxicology testing and short-term physiological studies. However, their limited scalability and higher risk of variability reduce their appeal for industrial-scale applications. Despite this, both culture types are expected to coexist in the market, fulfilling distinct roles across research and production environments.
| Cell Culture Type | CAGR (2025-2035) |
|---|---|
| Infinite cell line cultures | 10.3% |
Cell therapy is expected to be the fastest-growing application segment, with a projected CAGR of 11.5% from 2025 to 2035. The increasing number of clinical trials involving allogeneic T-cell therapies, CAR-T treatments, and autologous cell-based products has intensified demand for automated systems that can deliver consistent cell yields under strict compliance standards. These systems are vital for scaling up production and ensuring uniformity across patient-specific batches.
Drug development remains a core application area, driven by the pharmaceutical industry's push for high-throughput screening and reproducible experimental models.
Automated systems enable continuous monitoring, environmental control, and efficient compound testing, helping reduce time-to-market for new therapies. Stem cell research also contributes significantly to market demand, as the need to culture, differentiate, and expand stem cells in a reliable and contamination-free environment continues to grow. These cells are foundational in developmental biology and disease modeling.
Meanwhile, regenerative medicine applications are advancing rapidly, supported by breakthroughs in tissue engineering and repair technologies. Automated culture systems play a critical role in maintaining the viability and functionality of therapeutic cells, enabling innovations in personalized and restorative treatments.
| Application | CAGR (2025-2035) |
|---|---|
| Cell Therapy | 11.5% |
Hospitals providing cell therapy and regenerative medicine are projected to be the fastest-growing end-user segment, with a CAGR of 12.1% from 2025 to 2035. This growth is being fueled by increasing clinical adoption of cell-based therapies for conditions such as cancers, degenerative diseases, and immune disorders.
These institutions require automated systems to scale production, minimize contamination risk, and meet stringent regulatory requirements in patient-specific treatment workflows.
Mega pharmaceutical companies continue to dominate the market in terms of scale and investment. Their demand for automation is driven by the need to streamline biologics manufacturing and support global supply chains.
Biopharmaceutical firms rely heavily on automated systems for process consistency and accelerated development timelines, especially in monoclonal antibody and vaccine production. CDMOs and CMOs play a crucial role by offering flexible, large-batch manufacturing services to multiple clients, using automation to reduce turnaround time and improve quality assurance.
Research organizations use these systems to conduct preclinical studies and high-throughput screening, while academic institutes benefit from automation in training, basic research, and collaborative innovation. Each segment contributes to the market by addressing unique scalability, precision, and compliance challenges.
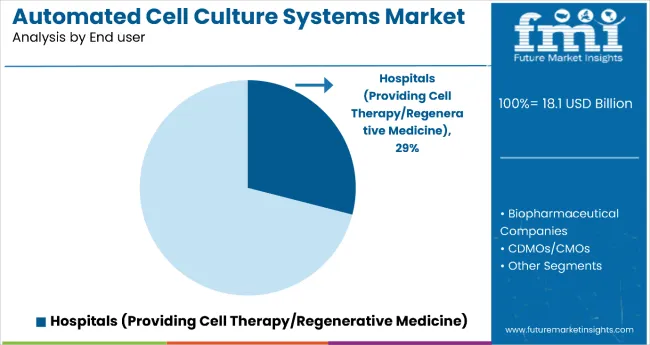
| End User | CAGR (2025-2035) |
|---|---|
| Hospitals (Providing Cell Therapy/Regenerative Medicine) | 12.1% |
The surge in biologics manufacturing and increasing clinical applications of regenerative medicine are central to the growth of automated cell culture systems. Biopharmaceutical companies are scaling up production of monoclonal antibodies, vaccines, and cell-based therapies, all of which demand standardized, high-throughput processes.
Automation supports this scalability while ensuring consistency and quality. Moreover, advancements in stem cell research and personalized therapies require reliable and contamination-free cell handling environments. Automated systems offer reproducibility and precision, reducing manual error and increasing laboratory productivity. The growing adoption of 3D cell culture technologies for cancer research and organoid development further propels market demand.
Additionally, global health trends pushing for more efficient clinical workflows are making automation a necessity, especially in large-scale research and clinical environments.
Despite its promising trajectory, the market faces critical restraints. Operating complex automation equipment requires cross-disciplinary expertise in biology, data analysis, and system engineering, which is still in short supply.
Educational institutions have yet to fully adapt curricula to match evolving industry needs, leading to a persistent skills gap. Small and mid-sized facilities often find it difficult to train personnel or recruit specialists proficient in automation, software analytics, and AI integration.
These challenges delay system implementation and increase dependency on vendor support. Furthermore, the upfront investment in hardware, software integration, and infrastructure modifications adds significant financial strain. This can deter smaller players or academic labs from adopting automation solutions, particularly in price-sensitive regions or underfunded sectors.
Rapid innovation in artificial intelligence and machine learning presents substantial opportunities for the market. AI-powered platforms are enabling predictive analytics, real-time optimization, and autonomous adjustments in cell culture environments.
This reduces waste, enhances yield, and minimizes risk in large-scale biologics manufacturing. Cloud-based systems offer remote monitoring, data sharing, and centralization of experimental workflows, making collaboration and reproducibility easier across geographies. The push toward personalized medicine, especially autologous therapies, is also expanding the market.
These treatments require precise and scalable culturing of patient-derived cells, where automation ensures batch consistency. Regulatory agencies across developed economies are beginning to support faster approvals for AI-assisted systems and regenerative therapies, which further incentivize automation adoption and investment in this evolving sector.
As automation in cell culture grows increasingly digitized, the risk of cybersecurity threats becomes more pressing. Automated systems are now interconnected through cloud-based platforms and remote monitoring tools, creating potential vulnerabilities in sensitive medical and research data.
A breach could compromise proprietary formulations, clinical trial data, or manufacturing protocols, resulting in regulatory penalties or loss of market trust. Moreover, data integrity is crucial for regulatory compliance, and any system error in recording, monitoring, or storing data can lead to product recalls or delayed approvals.
The complexity of maintaining validation protocols for integrated automation platforms poses an ongoing challenge. Without a robust IT infrastructure and secure data governance, manufacturers and research organizations could face serious operational and reputational setbacks.
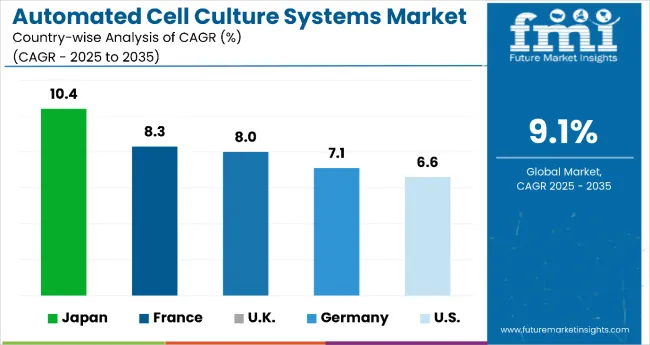
| Countries | CAGR (2025-2035) |
|---|---|
| United States | 6.6% |
| United Kingdom | 8.0% |
| France | 8.3% |
| Germany | 7.1% |
| Japan | 10.4% |
The USA automated cell culture systems market is estimated to grow at a 6.6% CAGR during the study period.The United States remains one of the most advanced markets for automated cell culture systems due to its dominant role in biotechnology, biologics production, and academic research.
The country hosts a high concentration of global pharmaceutical companies, contract manufacturing organizations, and cutting-edge life sciences institutions. Automation has become integral to ensuring compliance with the FDA’s increasingly stringent standards on data integrity and process reproducibility. With cell and gene therapies gaining commercial traction, USA based companies are expanding their production pipelines to meet rising demand, especially in oncology and rare diseases.
This expansion demands scalable, high-precision cell culture solutions, which automated systems deliver. Federal initiatives, including substantial funding from the NIH and the Cancer Moonshot project, have helped accelerate research involving cell therapy, iPSC, and regenerative medicine. Moreover, a robust infrastructure of venture capital investment and public-private collaborations supports ongoing innovation in automation technologies.
The presence of well-established healthcare providers and research hospitals further boosts the application of automated systems in both clinical and production settings.
The UK automated cell culture systems market is estimated to grow at an 8.0% CAGR during the study period, with increasing demand for automated solutions that support complex workflows. A defining strength of the UK market lies in its public-sector collaboration and infrastructure, led by the Cell and Gene Therapy Catapult.
This initiative has enabled small- and mid-sized enterprises to access state-of-the-art automation, thereby accelerating innovation. Automation is helping companies and research institutions achieve reproducibility in experiments and reduce the risk of contamination, both crucial for meeting GMP guidelines. The rise of AI-integrated platforms is also gaining attention, particularly in cell morphology monitoring and feeding schedule optimization. Brexit-related regulatory shifts have prompted domestic firms to strengthen local production capacities, thereby encouraging investment in advanced manufacturing tools.
Furthermore, the NHS’s support for cell-based trials and the integration of regenerative medicine into clinical practice are driving hospitals and labs toward automated culture systems. These developments, combined with access to funding from Innovate UK and private channels, are fueling robust market expansion.
The France automated cell culture systems market is estimated to grow at an 8.3% CAGR during the study period. France is positioning itself as a leader in bioproduction automation, supported by a strong pipeline of biologics and regenerative therapies.
The national biotechnology strategy includes tax credits, innovation grants, and infrastructure development aimed at enhancing competitiveness in cell-based product manufacturing. Organizations such as Bpifrance play a key role in bridging the gap between early-stage research and commercial deployment, helping biotechs scale through automation. The country’s top-tier pharmaceutical companies, including Sanofi and Servier, are actively investing in automated platforms to improve product consistency and reduce development timelines.
Collaborations between public research institutes like INSERM and hospital systems have expanded clinical access to stem cell therapies, increasing the need for scalable cell culture systems. The push toward decentralized biomanufacturing has made modular, automated solutions even more attractive. Regulatory clarity from ANSM and harmonization with EU GMP standards reinforce trust in automated processes. As digital health technologies gain ground in France, integration between automated lab equipment and centralized data systems is becoming a market norm.
The German automated cell culture systems market is estimated to grow at a 7.1% CAGR during the study period. Germany stands out for its engineering precision and scientific rigor, both of which have shaped its expanding market for automated cell culture systems. As a hub for global biopharmaceutical manufacturing, the country benefits from well-developed infrastructure, strong academic-industry collaboration, and highly skilled labor. Initiatives like the High-Tech Strategy 2025 promote digitization across industries, with a specific focus on biotechnology and health innovation.
German research institutes and hospitals are integrating automation to manage increasing volumes of clinical and preclinical trials involving stem cells, immunotherapies, and gene editing technologies. The emphasis on 3D cell culture, organoid modeling, and patient-specific testing is further pushing demand for programmable, contamination-free systems. With a dense network of CDMOs and biotech clusters, automated solutions are becoming essential for batch tracking, quality assurance, and regulatory documentation.
Local governments are also offering incentives to companies that adopt green and efficient technologies, including single-use bioreactors and cloud-based monitoring tools. These trends are reinforcing Germany’s position as a strategic automation market in Europe.
The Japanese automated cell culture systems market is estimated to grow at a 10.4% CAGR during the study period. Japan continues to lead in stem cell research, thanks in large part to its pioneering work in induced pluripotent stem cells (iPSCs) led by institutions such as Kyoto University. With a rapidly aging population, the country is prioritizing research into age-related diseases, including neurodegenerative and cardiovascular conditions. This has led to a rise in demand for scalable, safe, and repeatable cell culture systems.
Government support through the Regenerative Medicine Promotion Act and significant funding from AMED are driving both R&D and clinical applications of cell therapies. Hospitals and pharma companies are increasingly using automated platforms to reduce errors, maintain quality, and meet rigorous safety standards for patient-derived therapies. Japan’s early embrace of robotic technologies in healthcare gives it a natural advantage in laboratory automation.
Innovations in AI-based imaging, smart incubators, and integrated bioprocessing are finding fast adoption in the country’s high-tech labs. As local companies expand global reach, automation is seen as critical to improving reproducibility and manufacturing efficiency.
Market players in the automated cell culture systems space are actively pursuing innovation, partnerships, and portfolio expansion to meet the rising demand for scalable and high-precision solutions in biologics and cell therapy manufacturing.
A common strategic focus involves the integration of automation with artificial intelligence, enabling real-time monitoring, predictive adjustments, and reduced human intervention. Companies are also investing in modular systems that support both high-throughput and small-batch processes, catering to the dual demands of large-scale commercial production and personalized medicine. Collaborations with academic institutions and research hospitals are being leveraged to pilot advanced technologies in clinical environments.
In addition, many players are emphasizing compliance with evolving GMP standards and incorporating software-driven traceability and quality control features into their platforms. These initiatives aim to strengthen customer trust and regulatory alignment across global markets.
Leading the market, Thermo Fisher Scientific has launched integrated solutions such as the Cellmation™ software, which links various instruments under one automated workflow. Corning Incorporated is enhancing its lab automation tools by combining advanced surface technologies with automated hardware for consistent results.
Merck KGaA is pushing its BioContinuum™ platform, which integrates cell culture and downstream processes for continuous biomanufacturing. Lonza Group Ltd, a key CDMO, is expanding its portfolio with systems that support closed, scalable cell expansion. Sartorius AG is strengthening its offerings through digital twins and real-time bioprocess control. Tecan Trading AG focuses on liquid handling and robotic platforms tailored to life science applications.
Hamilton Medical AG specializes in automation-ready bioprocessing tools with an emphasis on sterile, contamination-free workflows. Biospherix offers closed cell culture environments designed for stem cell and gene therapy research. PromoCell GmbH, known for its cell culture media and primary cells, is developing compatible automation solutions to support clinical-grade cell production. These companies collectively shape the competitive landscape by merging deep expertise in cell biology with engineering and digital innovation.
| Attribute | Details |
|---|---|
| Current Total Market Size (2025) | USD 18.1 billion |
| Projected Market Size (2035) | USD 43.2 billion |
| CAGR (2025 to 2035) | 9.10% |
| Base Year for Estimation | 2024 |
| Historical Period | 2020-2024 |
| Projections Period | 2025-2035 |
| Report Parameter | Revenue in USD billion |
| By Product | Cell Culture Process Automatization Instrument or Robot (Multiple Function), Automated Bioreactor (Single or Multiple Function). Automated Cell Culture Media Exchange System (Single Function), Automated Culture Media Analyzer (Single Function), Automated Cell Wash-and-Concentrate System (Single Function), Automated Cell Counter (Single Function), Automated Fill And Finish System (Single Function), Automated Cell Storage Equipment (Single Function), and Management Software |
| By Cell Culture Type | Finite Cell Line Cultures and Infinite Cell Line Cultures |
| By Application | Cell Therapy, Drug Development, Stem Cell Research, and Regenerative Medicine |
| By End User | Mega Pharmaceutical Companies, Biopharmaceutical Companies, CDMOS/CMOS, Research Organizations, Academic Institutes, Hospitals (Providing Cell Therapy/Regenerative Medicine) |
| Regions Covered | North America, Latin America, Western Europe, South Asia, East Asia, Eastern Europe, and the Middle East & Africa |
| Countries Covered | United States, United Kingdom, France, Japan, Germany |
| Key Players | Thermo Fisher Scientific, Corning Incorporated, Merck KGaA , Lonza Group Ltd, Sartorius AG, Tecan Trading AG, Hamilton Medical AG, Biospherix , and Promocell GmbH |
| Additional Attributes | Dollar sales by value, market share analysis by region, and country-wise analysis. |
In terms of product, the industry is segmented into cell culture process automatization instrument or robot (multiple function), automated bioreactor (single or multiple function), automated cell culture media exchange system (single function), automated culture media analyzer (single function), automated cell wash-and-concentrate system (single function), automated cell counter (single function), automated fill and finish system (single function), automated cell storage equipment (single function), and management software.
In terms of cell culture type, the industry is finite cell line cultures and infinite cell line cultures.
In terms of application, the industry is segmented into cell therapy, drug development, stem cell research, and regenerative medicine.
In terms of end user, the industry is segmented into mega pharmaceutical companies, biopharmaceutical companies, CDMOs/CMOs, research organizations, academic institutes, and hospitals (providing cell therapy/regenerative medicine).
Key countries of North America, Latin America, Western Europe, Eastern Europe, South Asia and Pacific, East Asia, the Middle East, and Africa have been covered in the report.
The market is valued at USD 18.1 billion in 2025.
The market is expected to reach USD 43.2 billion by 2035.
Cell culture process automation instruments or robots are the fastest-growing product segment with a CAGR of 11.2%.
Key players include Thermo Fisher Scientific, Corning Incorporated, Merck KGaA, Lonza Group Ltd, and Sartorius AG.
Hospitals providing cell therapy and regenerative medicine are projected to grow the fastest, with a CAGR of 12.1%.


Our Research Products

The "Full Research Suite" delivers actionable market intel, deep dives on markets or technologies, so clients act faster, cut risk, and unlock growth.

The Leaderboard benchmarks and ranks top vendors, classifying them as Established Leaders, Leading Challengers, or Disruptors & Challengers.

Locates where complements amplify value and substitutes erode it, forecasting net impact by horizon

We deliver granular, decision-grade intel: market sizing, 5-year forecasts, pricing, adoption, usage, revenue, and operational KPIs—plus competitor tracking, regulation, and value chains—across 60 countries broadly.

Spot the shifts before they hit your P&L. We track inflection points, adoption curves, pricing moves, and ecosystem plays to show where demand is heading, why it is changing, and what to do next across high-growth markets and disruptive tech

Real-time reads of user behavior. We track shifting priorities, perceptions of today’s and next-gen services, and provider experience, then pace how fast tech moves from trial to adoption, blending buyer, consumer, and channel inputs with social signals (#WhySwitch, #UX).

Partner with our analyst team to build a custom report designed around your business priorities. From analysing market trends to assessing competitors or crafting bespoke datasets, we tailor insights to your needs.
Supplier Intelligence
Discovery & Profiling
Capacity & Footprint
Performance & Risk
Compliance & Governance
Commercial Readiness
Who Supplies Whom
Scorecards & Shortlists
Playbooks & Docs
Category Intelligence
Definition & Scope
Demand & Use Cases
Cost Drivers
Market Structure
Supply Chain Map
Trade & Policy
Operating Norms
Deliverables
Buyer Intelligence
Account Basics
Spend & Scope
Procurement Model
Vendor Requirements
Terms & Policies
Entry Strategy
Pain Points & Triggers
Outputs
Pricing Analysis
Benchmarks
Trends
Should-Cost
Indexation
Landed Cost
Commercial Terms
Deliverables
Brand Analysis
Positioning & Value Prop
Share & Presence
Customer Evidence
Go-to-Market
Digital & Reputation
Compliance & Trust
KPIs & Gaps
Outputs
Full Research Suite comprises of:
Market outlook & trends analysis
Interviews & case studies
Strategic recommendations
Vendor profiles & capabilities analysis
5-year forecasts
8 regions and 60+ country-level data splits
Market segment data splits
12 months of continuous data updates
DELIVERED AS:
PDF EXCEL ONLINE
Automated Cell Block Systems Market
Automated Cell Biology Systems Market Size and Share Forecast Outlook 2025 to 2035
Automated Cell Therapy Processing Systems Market Trends - Outlook & Forecast 2025 to 2035
Cell Culture Waste Aspirator Market Size and Share Forecast Outlook 2025 to 2035
Cell Culture Media Market Size and Share Forecast Outlook 2025 to 2035
Cell Culture Supplements Market Size and Share Forecast Outlook 2025 to 2035
Cell Culture Media & Cell Lines Market Size and Share Forecast Outlook 2025 to 2035
Cell Culture Media Bags Market Analysis - Size, Share, and Forecast 2025 to 2035
Cell Culture Sampling Devices Market Growth – Trends & Forecast 2025 to 2035
Cell Culture Incubator Market Growth – Trends & Forecast 2025 to 2035
Cell Culture Market Analysis – Trends, Growth & Forecast 2024-2034
Automated Cell Shakers Market Analysis by Product, Cell Culture Type, Application, End User, and Region through 2035
3D Cell Culture Market - Demand, Size & Industry Trends 2025 to 2035
Cell Therapy Systems Market Size and Share Forecast Outlook 2025 to 2035
Cell Harvesting Systems Market Size and Share Forecast Outlook 2025 to 2035
China Cell Culture Media Bags Market Insights – Size, Trends & Growth 2025-2035
India Cell Culture Media Bags Market Growth – Demand, Trends & Forecast 2025-2035
Automated Feeding Systems Market Size and Share Forecast Outlook 2025 to 2035
France Cell Culture Media Bags Market Trends – Size, Share & Growth 2025-2035
Germany Cell Culture Media Bags Market Growth – Demand, Trends & Forecast 2025-2035

Thank you!
You will receive an email from our Business Development Manager. Please be sure to check your SPAM/JUNK folder too.
Chat With
MaRIA