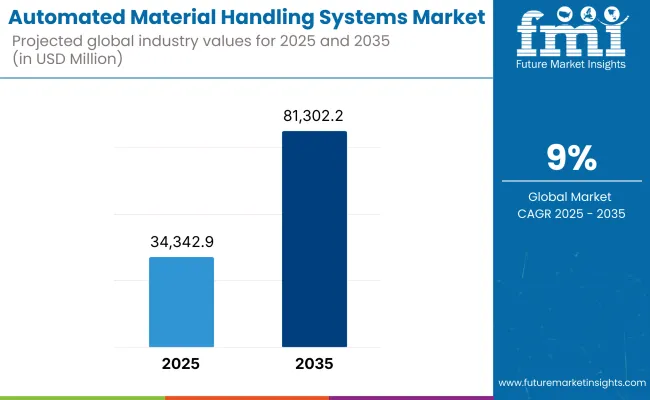
As industries move forward to Industry 4.0, the process of moving materials is becoming smart, full of data, and connected. This is done with smart sensors, AI-based choices, and IoT systems. automated material handling systems market will grow at a yearly rate of 9% from 2025 to 2035. The value of these systems will rise from USD 34,342.9 million in 2025 to USD 81,302.2 million by 2035.
However, between 2025 and 2035, the automated material handling systems market is expected to share a steady growth, due to the rising supply chain traction, ongoing automation trend among industries and widespread adoption of e-commerce-based distribution centers.

| Metric | Value |
|---|---|
| Market Size (2025E) | USD 34,342.9 Million |
| Market Value (2035F) | USD 81,302.2 Million |
| CAGR (2025 to 2035) | 9% |
Comprising conveyors, automated storage and retrieval systems (AS/RS), automated guided vehicles (AGVs) and robotic picking solutions, these systems are essential in meeting the demands of high throughput, low error rates and optimal space utilization in warehouses, production facilities and distribution centers.
North America will keep a big slice of the automated material handling systems market. This is due to wide use of machines in transport, car making, drugs, and food and drink fields. The USA is on top here, putting much money into smart storage, pushed by rising online shopping and labor lack.
Many top companies and new firms in robots, machine sight, and AI-run transport make innovation grow. Canada grows too with government help in making more smart factories and buildings. This all adds to the area's wider spread.
Europe is a stable yet growing market for automated material handling systems. High labor costs and strict rules push for more automation. Germany, France, and the Netherlands lead the way in warehouse robotics and automation innovations.
They invest big in flexible systems, smart transport platforms, and real-time flow management. Europe is also focused on green automation, with firms pushing for efficient and small AMHS systems that match the EU’s Green Deal goals. Car makers and stores use these systems the most, but there are also new chances in drug-making and cold chain logistics.
Asia is set to grow fast in the automated material handling systems market till 2035. This growth will come from strong manufacturing, more online shopping, and help from governments for smart factories. China leads with big plans for factory automation and local big names improving logistics.
Japan and South Korea add new tech in robots and AI, focusing on precise control and reliable systems. India is changing its storage system because of online shopping, new tax laws like GST, and big projects. ASEAN countries, such as Vietnam and Thailand, are using more AMHS in light factories, assembly spots, and logistics centers serving the world.
High Capital Expenditure and System Complexity
The initial investment needed to install automated material handling systems is huge, requiring not only hardware and software purchases, but also infrastructure upgrades, personnel training, and maintenance for the long term. For smaller and medium enterprises (SMEs), this cost can be prohibitive to adoption, particularly in geographies where they're either less access to automation funding or projects.
Furthermore, retrofitting the existing facilities with AMHS solutions gain system compatibility challenges stemming from the floor layout fixture and process reengineering. As a result, implementation delays, scalability challenges, and return-on-investment concerns become common.
Expansion of Industry 4.0 and Smart Logistics
The integration of AMHS with Industry 4.0 technologies offers enormous opportunities in logistics, manufacturing and distribution. AMHS solutions are increasingly becoming intelligent, agile, and user-centric through the incorporation of advanced data analytics, real-time monitoring, digital twins, and cloud-based control platforms. It provides for predictive maintenance, dynamic routing, and optimal inventory management, which leads to more agile operations.
Also, the growing focus on sustainability and carbon footprint reduction is driving the need for energy-efficient AMHS assemblies, including regenerative drives and modular designs, very much in tune with green supply chain initiatives. Systems with the aforementioned qualities scalable, software defined, and interoperable will help ensure that vendors can remain successful with the vortexing nature of market evolution.
From 2020 to 2024, the automated material handling systems market has changed a lot. This is due to the need to make warehouses better, cut labor costs, and simplify goods movement after the pandemic. More online shopping, fast growth of factories, and smart manufacturing have pushed up demand for systems like automated vehicles, conveyor belts, storage and picking systems, and robot arms. These tools help firms store items better, get orders right, and work safer.
Looking ahead to 2025 through 2035, the market will change faster with new tech such as AI, smart cameras, Internet of Things, and speedy 5G networks. There will be more focus on smart, connected, and flexible warehouses. Green energy needs and fewer workers will make people use more eco-friendly and self-driven machines.
Growing places, like Asia-Pacific and Latin America, will see chances to grow due to more spending on building and automating supply chains. Cloud systems and smart predictions will help make tasks better, cut down lost time, and allow quick choices in many businesses.
Market Shifts: 2020 to 2024 vs. 2025 to 2035
| Key Dimensions | 2020 to 2024 |
|---|---|
| Technology Adoption | Basic automation and semi-autonomous systems |
| Deployment Focus | Warehouse automation, e-commerce fulfillment |
| End-User Industries | Retail, e-commerce, automotive, and electronics |
| Integration Capabilities | Standalone and siloed systems |
| Geographical Demand | High demand in North America and Western Europe |
| Sustainability Trends | Limited focus on green automation |
| Workforce Dynamics | Labor-assisted automation |
| System Intelligence | Rule-based programmable machines |
| Customer Expectations | Faster order fulfillment |
| Key Dimensions | 2025 to 2035 |
|---|---|
| Technology Adoption | AI-driven, self-learning, and adaptive handling systems |
| Deployment Focus | End-to-end smart logistics and predictive supply chain management |
| End-User Industries | Expansion into pharmaceuticals, food & beverage, and aerospace |
| Integration Capabilities | Seamless integration with WMS, ERP, and IoT ecosystems |
| Geographical Demand | Surge in Asia-Pacific, Latin America, and Middle East |
| Sustainability Trends | Energy-efficient, recyclable materials and low-emission systems |
| Workforce Dynamics | Labor-independent and collaborative robotics ( cobots ) |
| System Intelligence | AI and machine learning-based decision-making |
| Customer Expectations | Predictive inventory, same-day delivery, adaptive logistics |

The automated material handling systems market in the USA are growing fast. There is a need for faster work in warehouses, e-commerce, and saving on labor costs. Groups such as OSHA and ANSI make sure that these systems are safe and meet standards.
Main trends include more use of robots-for-service in warehouses. Autonomous mobile robots (AMRs) are getting popular. AI is being used for predictive maintenance in sorting and conveyor systems.
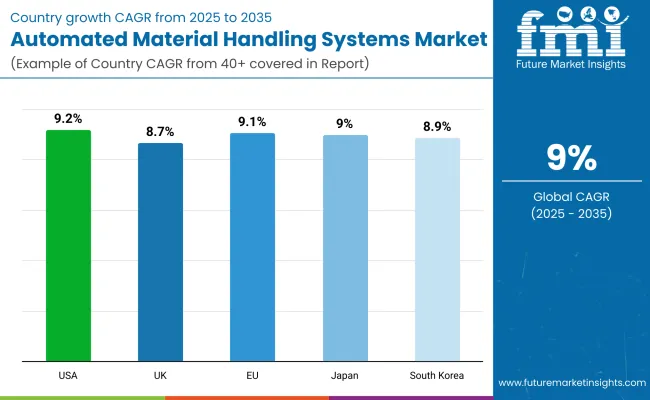
| Country | CAGR (2025 to 2035) |
|---|---|
| USA | 9.2% |
The UK automated material handling systems market keeps growing as logistics hubs need better productivity, online shopping demand stays strong, and smart warehouses get more money. The Health and Safety Executive (HSE) and British Standards Institution (BSI) make sure rules are followed.
Trends show more use of automated guided vehicles (AGVs), AI helps with inventory, and robots work in distribution centers.
| Country | CAGR (2025 to 2035) |
|---|---|
| UK | 8.7% |
The automated material handling systems market in Europe is growing fast. More factories turn to robots since they don't have enough workers. They need to move goods fast in countries like Germany, France, and the Netherlands. The European Committee for Standardization (CEN) and the European Agency for Safety and Health at Work (EU-OSHA) set rules for safety and automation.
Key trends include saving energy with better conveyor belts, using smart robotic arms with cameras, and making material movement better with data analysis.
| Country | CAGR (2025 to 2035) |
|---|---|
| European Union | 9.1% |
Japan’s automated material handling systems market are top-notch and full of new ideas. They are used a lot in cars, electronics, and stores. Groups like the Ministry of Economy and Trade and the Japan Industrial Safety and Health Association help make rules and keep things safe.
Important changes involve smart conveyor belts with sensors, robots that use AI to pick items, and 5G networks for fast warehouse checks.
| Country | CAGR (2025 to 2035) |
|---|---|
| Japan | 9.0% |
South Korea's automated material handling systems market is quickly changing. Key focuses are on smart manufacturing, making warehouses digital, and factory automation. The Ministry of Employment and Labor (MOEL) and the Korean Standards Association (KSA) set rules and safety for automation.
New trends include team-working robots, smart logistics software, and fully automated cold storage for online shopping and medicine logistics.
| Country | CAGR (2025 to 2035) |
|---|---|
| South Korea | 8.9% |

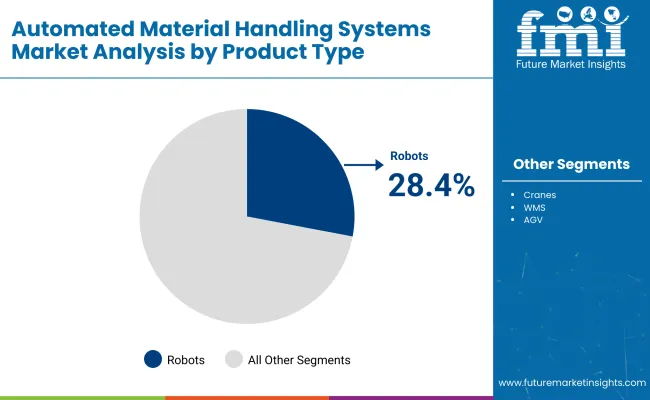
Market Share by Product (2025)
| Product Type | Market Share (2025) |
|---|---|
| Robots | 28.4% |
The AMHS (Automated Material Handling Systems) Market has found itself at the helm of a transformation that has accelerated by the minute due to rapid advancements in robotics, IoT, and warehouse automation technologies. Greater emphasis on simplifying supply chain operations, lowering labor costs and the need for high-speed order fulfillment, particularly in e-commerce, has resulted in wide-scale adoption of automated solutions.
Within segmentation, robots & unit load systems are expected to be the notable revenue contributors through 2030.

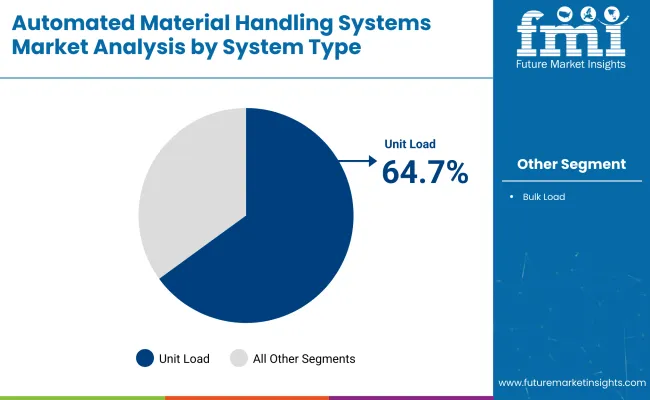
Market Share by System Type (2025)
| System Type | Market Share (2025) |
|---|---|
| Unit Load | 64.7% |
At the forefront of the automated material handling systems market are robots that are fast and precise for various tasks such as material handling, palletizing, and order picking. They’re being used extensively in smart warehouses, automotive manufacturing, and electronics assembly to improve throughput and scalability.
With developments in AI, vision systems, and cobotics (collaborative robots), the industry is moving on flexible robotic platforms that can work alongside human operators and reduce downtime.
The unit load segment dominates the market because of its wide applicability for handling discrete packages, pallets, and containers in distribution centers, airports, and automotive facilities. They serve ASRS, conveyor integrations, and AGV fleet systems to ensure the smooth movement of materials.
Through WMS (Warehouse Management Systems), unit load systems are also benefitting from the integration of software which allows real-time tracking of inventory, data analytics and predictive maintenance.
The automated material handling systems market is growing fast. This is because more industries like manufacturing, online shopping, cars, and medicine are using machines. They need to handle stuff quickly, correctly, and cheaply. So, AMHS now uses robots, AI, and smart tech. These new tools help make more things, keep workers safe, and improve the way items are moved around. The market keeps changing as tech gets better, and big companies team up to meet the needs of these industries.
Market Share Analysis by Company
| Company Name | Estimated Market Share (%) |
|---|---|
| Daifuku Co., Ltd. | 15-18% |
| KION Group AG | 12-15% |
| Toyota Industries Corporation | 10-13% |
| Honeywell International Inc. | 8-11% |
| SSI SCHAEFER | 6-9% |
| Other Companies (combined) | 35-49% |
| Company Name | Key Offerings/Activities |
|---|---|
| Daifuku Co., Ltd. | In 2024, added more automated storage systems for online shops. In 2025, teamed up with robot firms to improve warehouse automation. |
| KION Group AG | In 2024, launched new guided vehicles with better navigation. In 2025, bought a software firm to add AI to handling gear. |
| Toyota Industries Corporation | In 2024, introduced smart forklifts that connect to the Internet. In 2025, worked with logistics firms to make custom automation setups. |
| Honeywell International Inc. | In 2024, rolled out a system using AI for fast decisions in warehouses. In 2025, grew its robot team to better fulfill orders. |
| SSI SCHAEFER | In 2024, brought out new modular conveyors that save energy. In 2025, aimed for green solutions in material handling. |
Key Company Insights
Daifuku Co., Ltd. (15-18%)
Daifuku leads the AMHS market with a comprehensive range of automated storage and retrieval systems, focusing on enhancing efficiency in warehouse operations, particularly in the rapidly growing e-commerce sector.
KION Group AG (12-15%)
KION Group specializes in material handling solutions, including AGVs and forklifts, emphasizing innovation through AI integration and strategic acquisitions to strengthen its market position.
Toyota Industries Corporation (10-13%)
Toyota Industries offers a diverse portfolio of material handling equipment, with recent developments in autonomous forklifts and IoT-enabled solutions, aiming to optimize logistics and warehouse operations.
Honeywell International Inc. (8-11%)
Honeywell focuses on integrating AI and robotics into material handling systems, providing advanced warehouse execution systems that facilitate real-time decision-making and improved order fulfillment.
SSI SCHAEFER (6-9%)
SSI SCHAEFER emphasizes modular and energy-efficient conveyor systems, with a commitment to sustainability and eco-friendly solutions in material handling.
Other Key Players (35-49% Combined)
Several other companies contribute significantly to the AMHS market:
The overall market size for the automated material handling systems market was USD 34,342.9 Million in 2025.
The automated material handling systems market is expected to reach USD 81,302.2 Million in 2035.
Increasing demand for warehouse automation, rising adoption in e-commerce and manufacturing sectors, growing labor costs, and advancements in robotics and AI-driven logistics technologies will drive market growth.
The United States, China, Germany, Japan, and South Korea are key contributors.
The automated storage and retrieval systems (ASRS) segment is expected to lead due to its efficiency in space utilization, inventory management, and labor reduction in warehouses and distribution centers.


Our Research Products

The "Full Research Suite" delivers actionable market intel, deep dives on markets or technologies, so clients act faster, cut risk, and unlock growth.

The Leaderboard benchmarks and ranks top vendors, classifying them as Established Leaders, Leading Challengers, or Disruptors & Challengers.

Locates where complements amplify value and substitutes erode it, forecasting net impact by horizon

We deliver granular, decision-grade intel: market sizing, 5-year forecasts, pricing, adoption, usage, revenue, and operational KPIs—plus competitor tracking, regulation, and value chains—across 60 countries broadly.

Spot the shifts before they hit your P&L. We track inflection points, adoption curves, pricing moves, and ecosystem plays to show where demand is heading, why it is changing, and what to do next across high-growth markets and disruptive tech

Real-time reads of user behavior. We track shifting priorities, perceptions of today’s and next-gen services, and provider experience, then pace how fast tech moves from trial to adoption, blending buyer, consumer, and channel inputs with social signals (#WhySwitch, #UX).

Partner with our analyst team to build a custom report designed around your business priorities. From analysing market trends to assessing competitors or crafting bespoke datasets, we tailor insights to your needs.
Supplier Intelligence
Discovery & Profiling
Capacity & Footprint
Performance & Risk
Compliance & Governance
Commercial Readiness
Who Supplies Whom
Scorecards & Shortlists
Playbooks & Docs
Category Intelligence
Definition & Scope
Demand & Use Cases
Cost Drivers
Market Structure
Supply Chain Map
Trade & Policy
Operating Norms
Deliverables
Buyer Intelligence
Account Basics
Spend & Scope
Procurement Model
Vendor Requirements
Terms & Policies
Entry Strategy
Pain Points & Triggers
Outputs
Pricing Analysis
Benchmarks
Trends
Should-Cost
Indexation
Landed Cost
Commercial Terms
Deliverables
Brand Analysis
Positioning & Value Prop
Share & Presence
Customer Evidence
Go-to-Market
Digital & Reputation
Compliance & Trust
KPIs & Gaps
Outputs
Full Research Suite comprises of:
Market outlook & trends analysis
Interviews & case studies
Strategic recommendations
Vendor profiles & capabilities analysis
5-year forecasts
8 regions and 60+ country-level data splits
Market segment data splits
12 months of continuous data updates
DELIVERED AS:
PDF EXCEL ONLINE
Automated Material Handling Equipment Market Size and Share Forecast Outlook 2025 to 2035
Automated Liquid Handling Systems Market
Automated Microplate Handling Systems Market Size and Share Forecast Outlook 2025 to 2035
Material Handling Integration Market Size and Share Forecast Outlook 2025 to 2035
Material Handling Equipment Market Growth - Trends & Forecast 2025 to 2035
Material Handling Monorails Market
BOP Handling Systems Market Growth - Trends & Forecast 2025 to 2035
Automated Feeding Systems Market Size and Share Forecast Outlook 2025 to 2035
Bulk Material Handling System Market Growth - Trends & Forecast 2025 to 2035
Crate Handling Systems Market Size and Share Forecast Outlook 2025 to 2035
Automated Cell Block Systems Market
Automated Compounding Systems Market
Cattle Handling Systems Market Size and Share Forecast Outlook 2025 to 2035
Automated Cell Culture Systems Market Analysis - Size, Share & Forecast 2025-2035
Automated Cell Biology Systems Market Size and Share Forecast Outlook 2025 to 2035
Automated Tool Grinding Systems Market Size and Share Forecast Outlook 2025 to 2035
Automated Colony Picking Systems Market Size and Share Forecast Outlook 2025 to 2035
Automated Sample Storage Systems Market Growth - Trends & Forecast 2025 to 2035
Automated Breast Ultrasound Systems Market Outlook - Share, Growth & Forecast 2025 to 2035
Automated Microbial Detection Systems Market

Thank you!
You will receive an email from our Business Development Manager. Please be sure to check your SPAM/JUNK folder too.
Chat With
MaRIA